| Param | Original file | Final file |
|---|---|---|
| Filename | modeM0/AS1A05_180T01_9000002992_20098cztM0_level2.evt | modeM0/AS1A05_180T01_9000002992_20098cztM0_level2_quad_clean.evt |
| Size (bytes) | 1,034,542,080 | 160,562,880 |
| Size | 986.6 MB | 153.1 MB |
| Events in quadrant A | 7,421,451 | 1,028,757 |
| Events in quadrant B | 6,959,505 | 1,050,284 |
| Events in quadrant C | 5,603,127 | 1,019,123 |
| Events in quadrant D | 10,555,510 | 953,873 |
| Mode M9 | |||
|---|---|---|---|
| Quadrant | BADHDUFLAG | Total packets | Discarded packets |
| A | 0 | 13 | 0 |
| B | 0 | 14 | 0 |
| C | 0 | 14 | 0 |
| D | 0 | 14 | 0 |
| Mode M0 | |||
|---|---|---|---|
| Quadrant | BADHDUFLAG | Total packets | Discarded packets |
| A | 0 | 29795 | 3 |
| B | 0 | 28571 | 3 |
| C | 0 | 24317 | 3 |
| D | 0 | 39414 | 7 |
| Mode SS | |||
|---|---|---|---|
| Quadrant | BADHDUFLAG | Total packets | Discarded packets |
| A | 0 | 238 | 0 |
| B | 0 | 238 | 0 |
| C | 0 | 238 | 0 |
| D | 0 | 238 | 0 |
| Quadrant | Total seconds | Saturated seconds | Saturation percentage |
|---|---|---|---|
| A | 11715 | 631 | 5.386257% |
| B | 11715 | 255 | 2.176697% |
| C | 11715 | 158 | 1.348698% |
| D | 11714 | 1937 | 16.535769% |
Noise dominated data is calculated using 1-second bins in cleaned event files. If a bin has >2000 counts, and if more than 50% of those come from <1% of pixels, then it is considered to be noise-dominated and hence unusable.
| Quadrant | # 1 sec bins | Bins with >0 counts | Bins with >2000 counts | High rate bins dominated by noise | Noise dominated (total time) | Noise dominated (detector-on time) | Marked lightcurve |
|---|---|---|---|---|---|---|---|
| A | 12845 | 11717 | 379 | 379 | 2.95% | 3.23% | 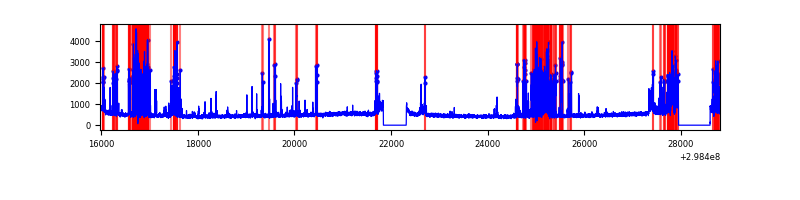 |
| B | 12845 | 11717 | 22 | 22 | 0.17% | 0.19% | 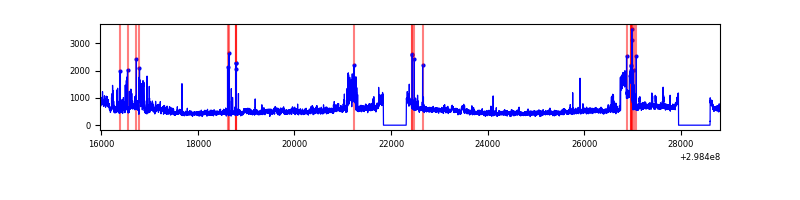 |
| C | 12845 | 11717 | 0 | 0 | 0.00% | 0.00% | 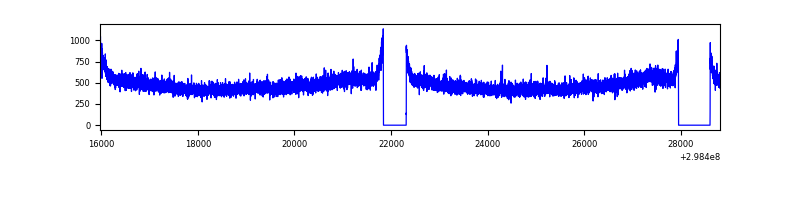 |
| D | 12844 | 11716 | 1723 | 1723 | 13.41% | 14.71% | 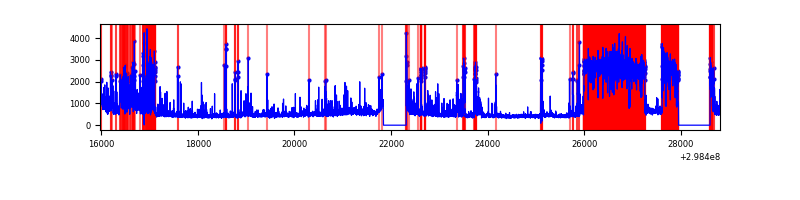 |
Top three noisy pixels from each quadrant. If the there are fewer than three noisy pixels in the level2.evt file, extra rows are filled as -1
| Pixel properties | Quadrant properties | ||||||
|---|---|---|---|---|---|---|---|
| Quadrant | DetID | PixID | Counts | Sigma | Mean | Median | Sigma |
| A | 14 | 238 | 1242569 | 4355.65 | 1417 | 1390 | 285.0 |
| A | 14 | 254 | 672489 | 2355.08 | 1417 | 1390 | 285.0 |
| A | 9 | 143 | 51294 | 175.13 | 1417 | 1390 | 285.0 |
| B | 10 | 245 | 1217882 | 4467.21 | 1424 | 1388 | 272.3 |
| B | 4 | 80 | 72293 | 260.38 | 1424 | 1388 | 272.3 |
| B | 0 | 198 | 34663 | 122.19 | 1424 | 1388 | 272.3 |
| C | 14 | 238 | 215725 | 662.45 | 1380 | 1394 | 323.5 |
| C | 3 | 233 | 12757 | 35.12 | 1380 | 1394 | 323.5 |
| C | 13 | 61 | 9670 | 25.58 | 1380 | 1394 | 323.5 |
| D | 1 | 52 | 5007669 | 16244.96 | 1263 | 1229 | 308.2 |
| D | 12 | 218 | 531816 | 1721.65 | 1263 | 1229 | 308.2 |
| D | 2 | 184 | 203357 | 655.87 | 1263 | 1229 | 308.2 |
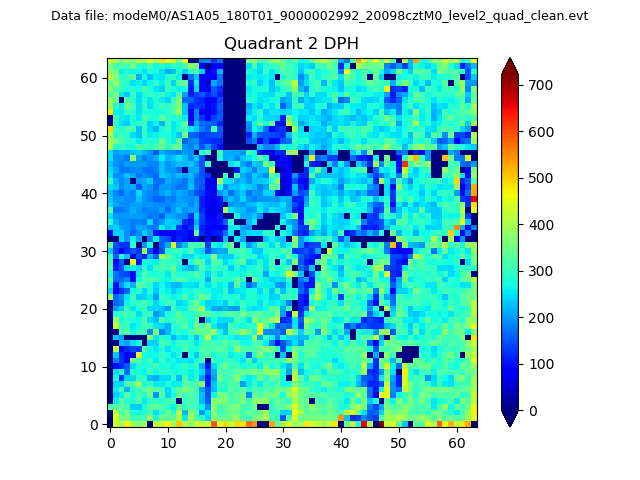
Histogram calculated using DETX and DETY for each event in the final _common_clean file
| Quadrant A |  |
 |
Quadrant B |
|---|---|---|---|
| Quadrant D | 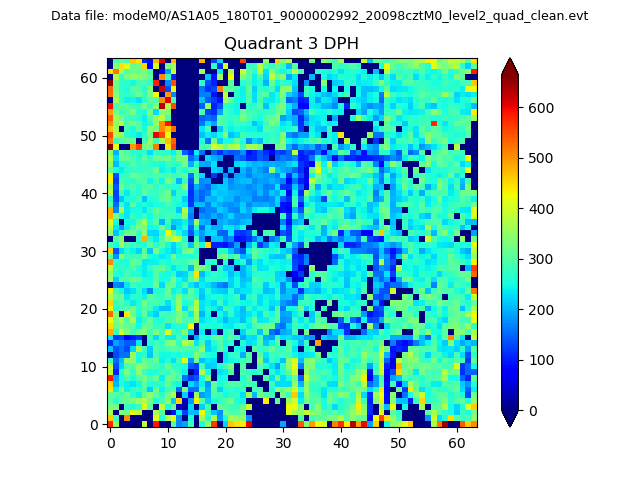 |
 |
Quadrant C |
| Plot type | Count rate plots | Images |
|---|---|---|
| Comparison with Poisson distribution Blue bars denote a histogram of data divided into 1 sec bins. Red curve is a Poisson curve with rate = median count rate of data. |
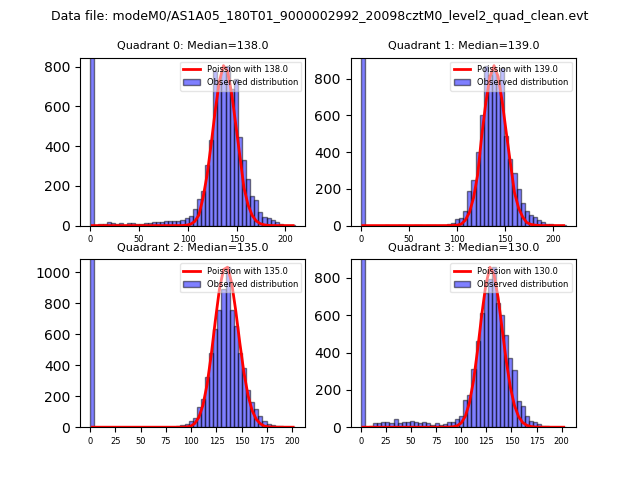 |
 |
| Quadrant-wise count rates Data is divided into 100 sec bins |
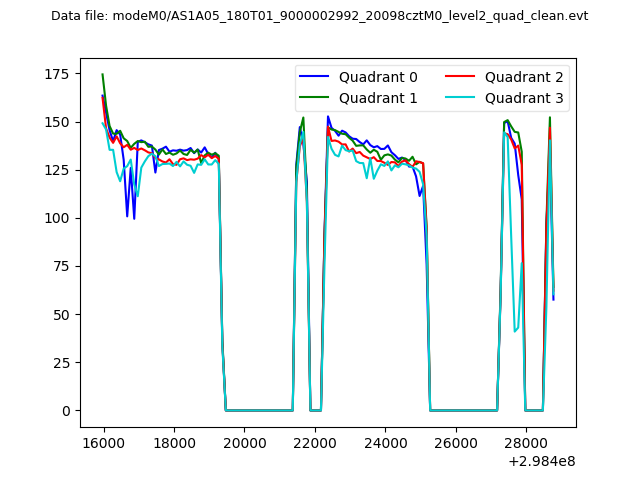 |
|
| Module-wise count rates for Quadrant A Data is divided into 100 sec bins |
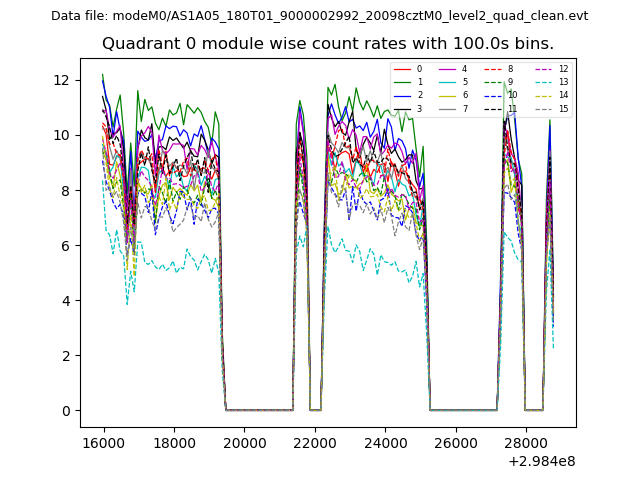 |
 |
| Module-wise count rates for Quadrant B Data is divided into 100 sec bins |
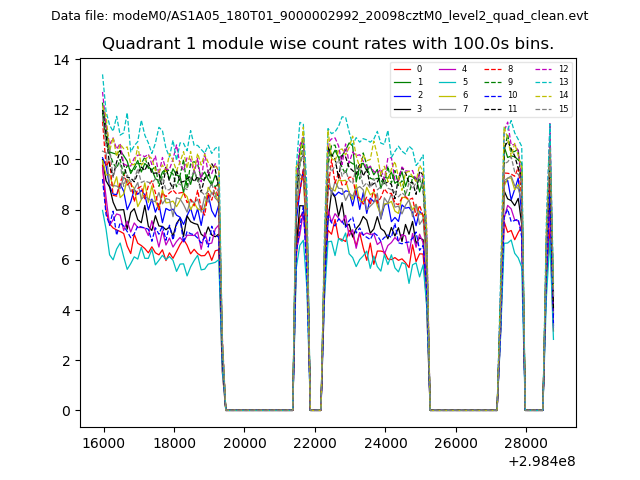 |
 |
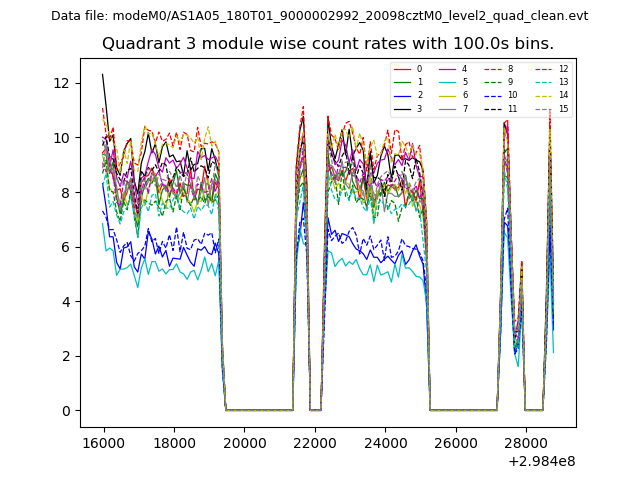
| Module-wise count rates for Quadrant C Data is divided into 100 sec bins |
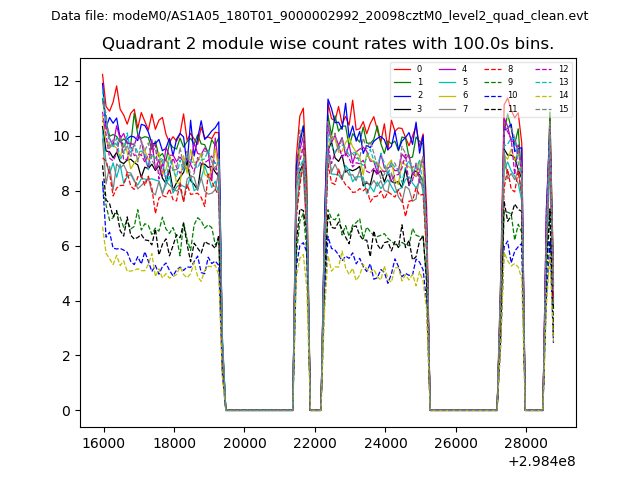 |
 |
| Module-wise count rates for Quadrant D Data is divided into 100 sec bins |
 |
 |
| Parameter | Plot |
|---|---|
| CZT HV Monitor | 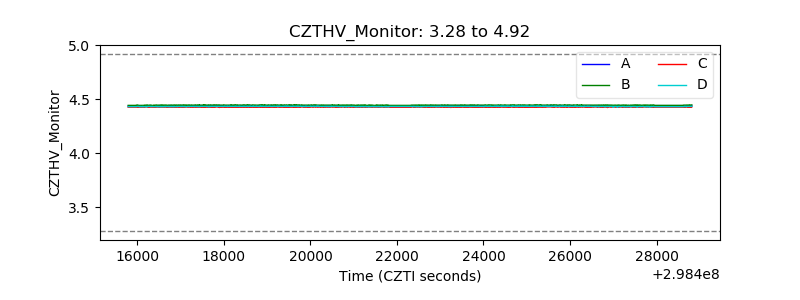 |
| D_VDD | 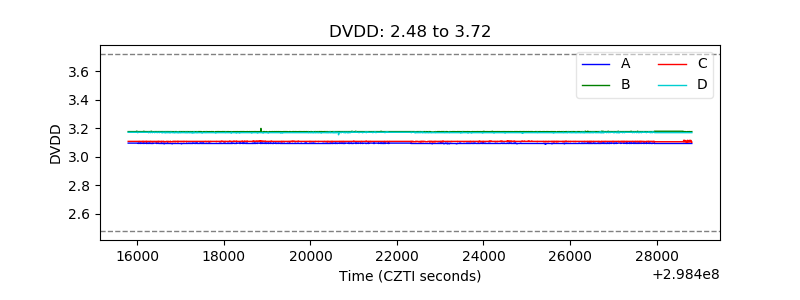 |
| Temperature 1 | 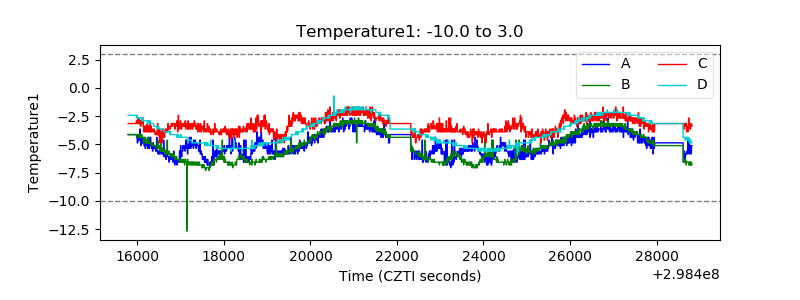 |
| Veto HV Monitor | 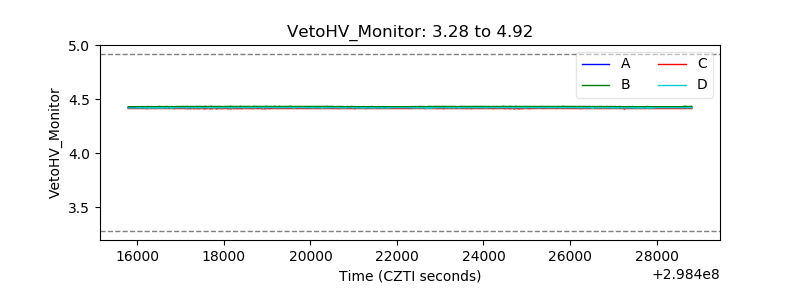 |
| Veto LLD | 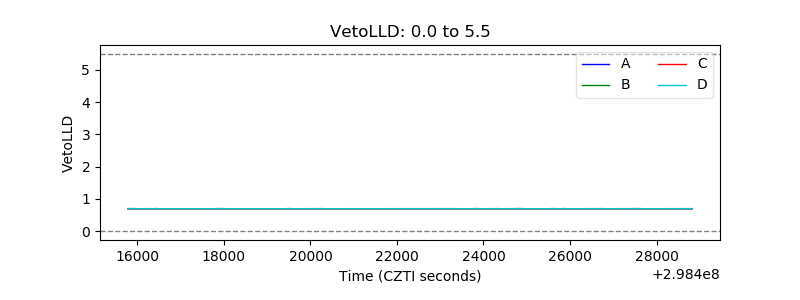 |
| Alpha Counter | 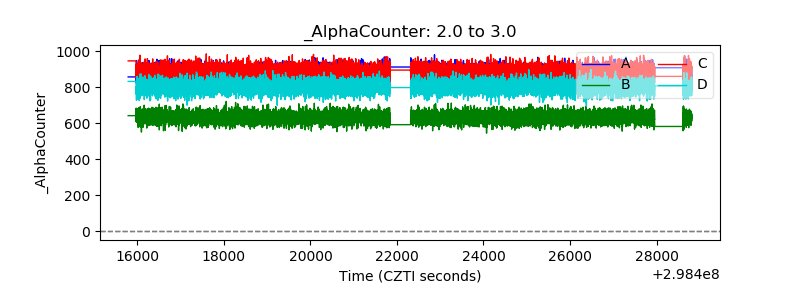 |
| _CPM_Rate | 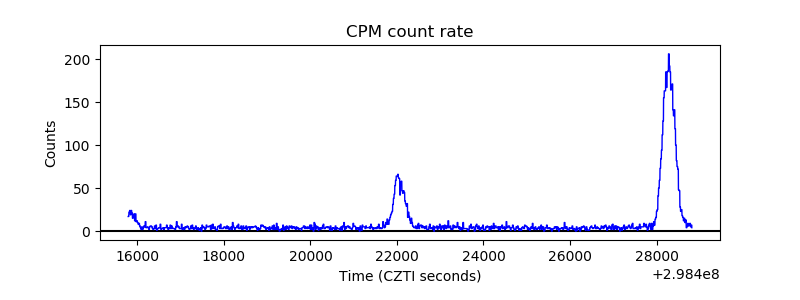 |
| CZT Counter | 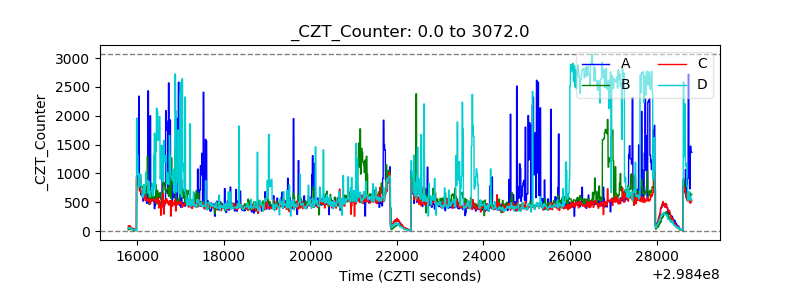 |
| +2.5 Volts monitor |  |
| +5 Volts monitor | 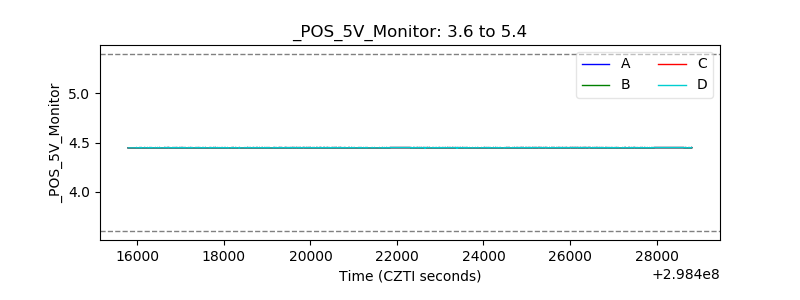 |
| _ROLL_ROT | 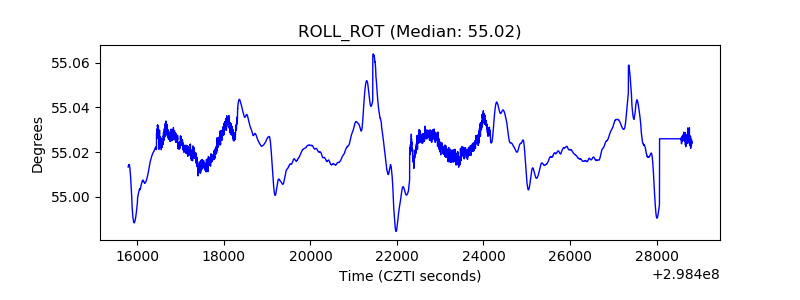 |
| _Roll_DEC | 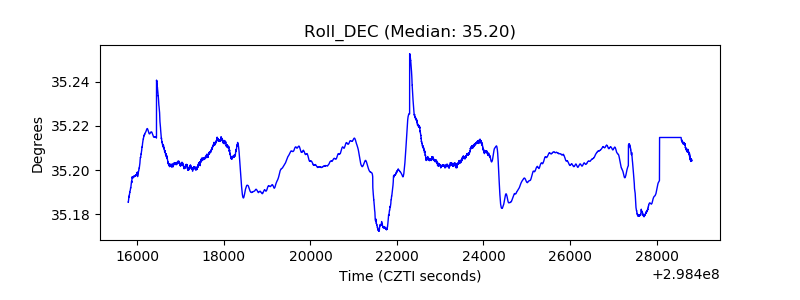 |
| _Roll_RA | 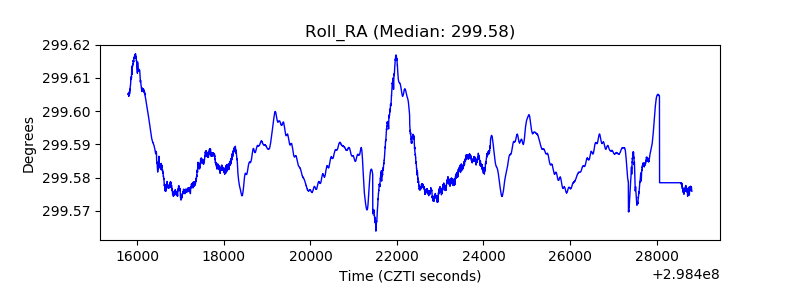 |
| Veto Counter |  |