| Param | Original file | Final file |
|---|---|---|
| Filename | modeM0/AS1A05_180T01_9000002992_20099cztM0_level2.evt | modeM0/AS1A05_180T01_9000002992_20099cztM0_level2_quad_clean.evt |
| Size (bytes) | 705,067,200 | 99,627,840 |
| Size | 672.4 MB | 95.0 MB |
| Events in quadrant A | 6,908,208 | 587,208 |
| Events in quadrant B | 4,092,279 | 683,797 |
| Events in quadrant C | 3,297,894 | 659,139 |
| Events in quadrant D | 6,585,177 | 602,687 |
| Mode M9 | |||
|---|---|---|---|
| Quadrant | BADHDUFLAG | Total packets | Discarded packets |
| A | 0 | 11 | 0 |
| B | 0 | 12 | 0 |
| C | 0 | 12 | 0 |
| D | 0 | 12 | 0 |
| Mode M0 | |||
|---|---|---|---|
| Quadrant | BADHDUFLAG | Total packets | Discarded packets |
| A | 0 | 25189 | 2 |
| B | 0 | 16584 | 2 |
| C | 0 | 14297 | 3 |
| D | 0 | 24375 | 2 |
| Mode SS | |||
|---|---|---|---|
| Quadrant | BADHDUFLAG | Total packets | Discarded packets |
| A | 0 | 140 | 0 |
| B | 0 | 140 | 0 |
| C | 0 | 140 | 0 |
| D | 0 | 140 | 0 |
| Quadrant | Total seconds | Saturated seconds | Saturation percentage |
|---|---|---|---|
| A | 6942 | 1512 | 21.780467% |
| B | 6942 | 73 | 1.051570% |
| C | 6941 | 70 | 1.008500% |
| D | 6941 | 976 | 14.061374% |
Noise dominated data is calculated using 1-second bins in cleaned event files. If a bin has >2000 counts, and if more than 50% of those come from <1% of pixels, then it is considered to be noise-dominated and hence unusable.
| Quadrant | # 1 sec bins | Bins with >0 counts | Bins with >2000 counts | High rate bins dominated by noise | Noise dominated (total time) | Noise dominated (detector-on time) | Marked lightcurve |
|---|---|---|---|---|---|---|---|
| A | 7752 | 6943 | 952 | 952 | 12.28% | 13.71% | 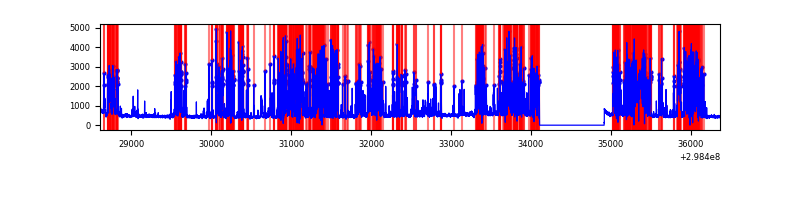 |
| B | 7752 | 6943 | 11 | 11 | 0.14% | 0.16% | 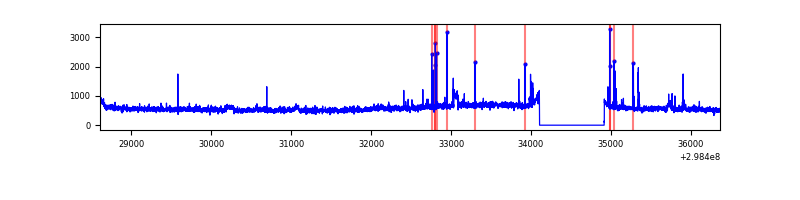 |
| C | 7751 | 6942 | 0 | 0 | 0.00% | 0.00% | 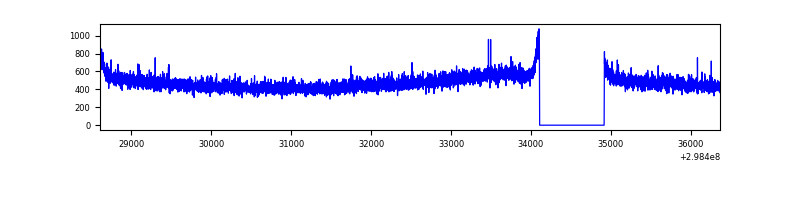 |
| D | 7751 | 6942 | 866 | 866 | 11.17% | 12.47% | 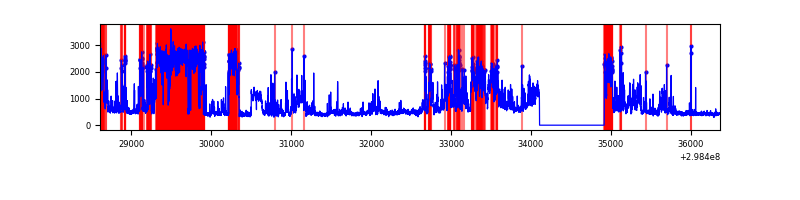 |
Top three noisy pixels from each quadrant. If the there are fewer than three noisy pixels in the level2.evt file, extra rows are filled as -1
| Pixel properties | Quadrant properties | ||||||
|---|---|---|---|---|---|---|---|
| Quadrant | DetID | PixID | Counts | Sigma | Mean | Median | Sigma |
| A | 14 | 238 | 3510206 | 23511.85 | 739 | 725 | 149.3 |
| A | 14 | 254 | 531158 | 3553.65 | 739 | 725 | 149.3 |
| A | 14 | 237 | 10784 | 67.39 | 739 | 725 | 149.3 |
| B | 10 | 245 | 704953 | 4355.78 | 837 | 817 | 161.7 |
| B | 4 | 80 | 51378 | 312.77 | 837 | 817 | 161.7 |
| B | 0 | 198 | 28125 | 168.93 | 837 | 817 | 161.7 |
| C | 14 | 238 | 125270 | 654.46 | 807 | 814 | 190.2 |
| C | 8 | 128 | 14186 | 70.32 | 807 | 814 | 190.2 |
| C | 8 | 112 | 6210 | 28.38 | 807 | 814 | 190.2 |
| D | 1 | 52 | 2992399 | 15663.9 | 782 | 759 | 191.0 |
| D | 12 | 218 | 519995 | 2718.66 | 782 | 759 | 191.0 |
| D | 2 | 184 | 46352 | 238.72 | 782 | 759 | 191.0 |
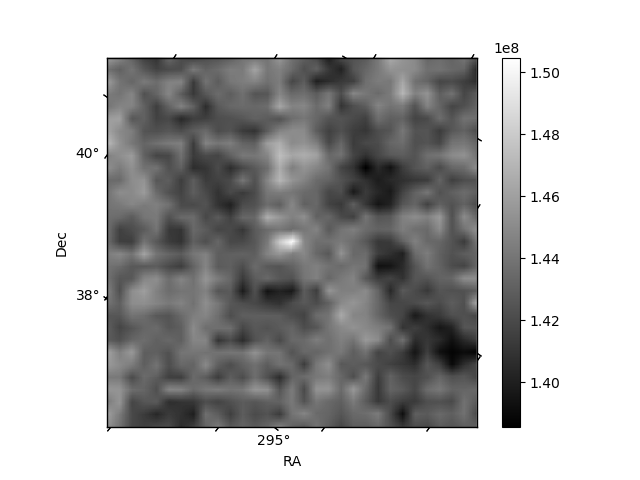
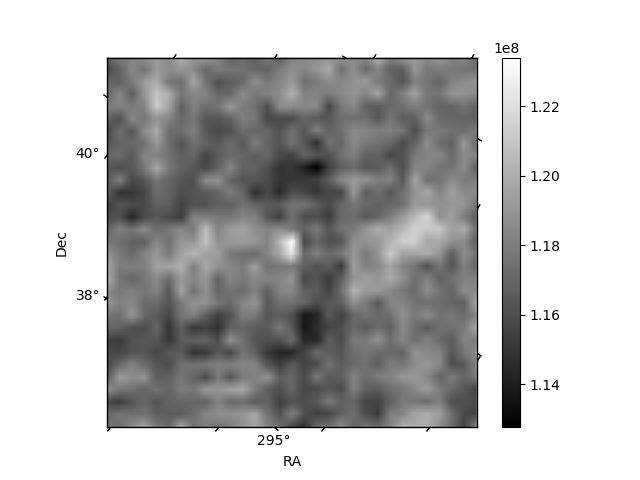
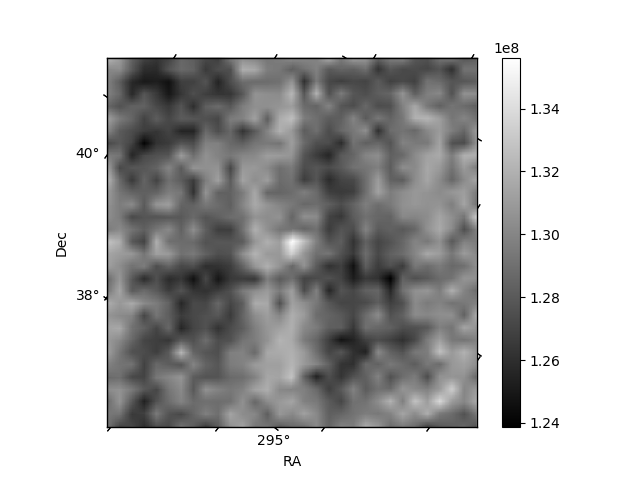
Histogram calculated using DETX and DETY for each event in the final _common_clean file
| Quadrant A | 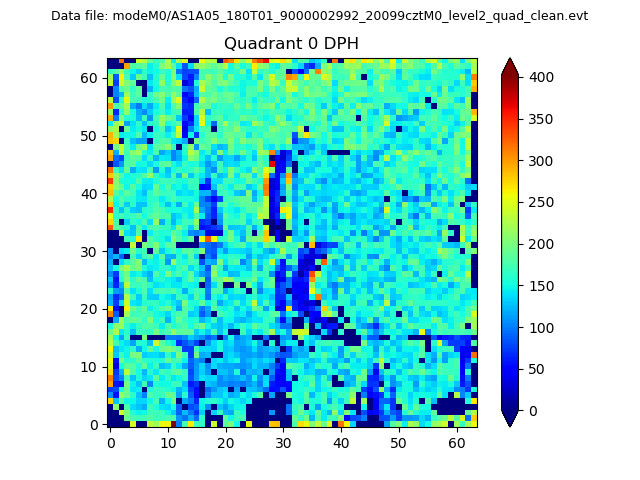 |
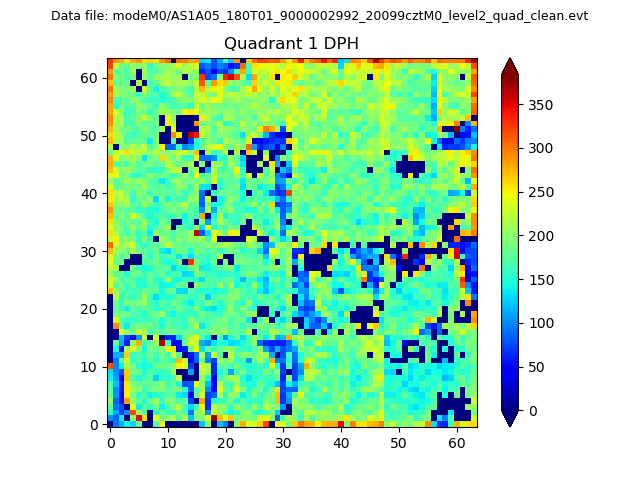 |
Quadrant B |
|---|---|---|---|
| Quadrant D | 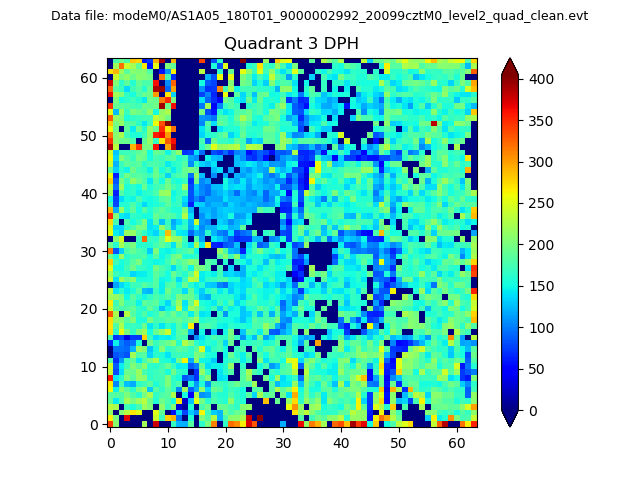 |
 |
Quadrant C |
| Plot type | Count rate plots | Images |
|---|---|---|
| Comparison with Poisson distribution Blue bars denote a histogram of data divided into 1 sec bins. Red curve is a Poisson curve with rate = median count rate of data. |
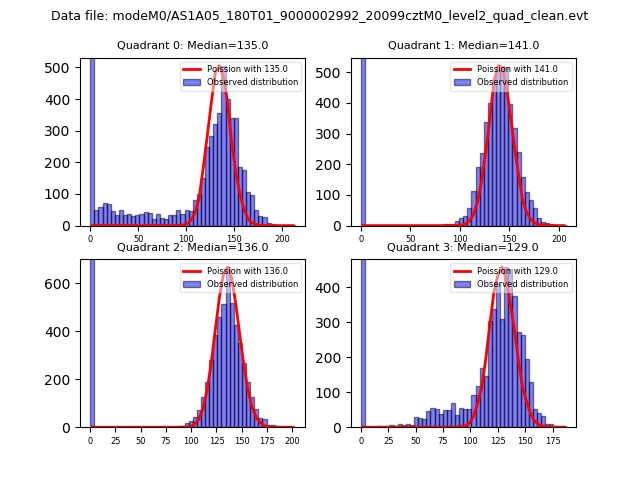 |
 |
| Quadrant-wise count rates Data is divided into 100 sec bins |
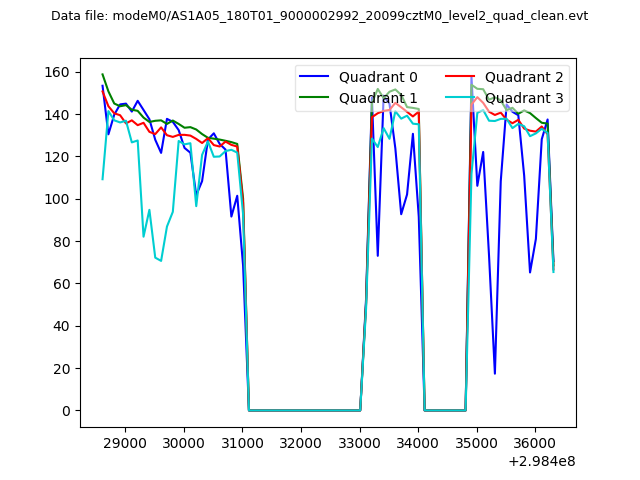 |
|
| Module-wise count rates for Quadrant A Data is divided into 100 sec bins |
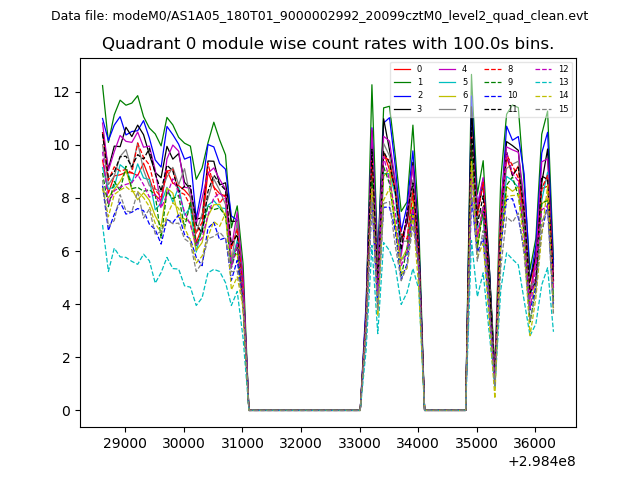 |
 |
| Module-wise count rates for Quadrant B Data is divided into 100 sec bins |
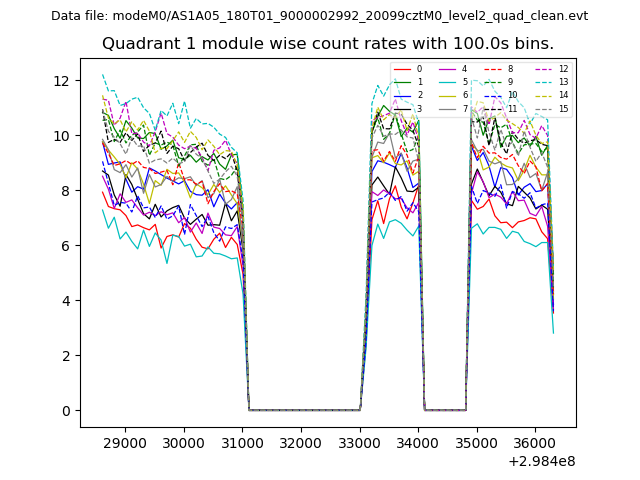 |
 |
| Module-wise count rates for Quadrant C Data is divided into 100 sec bins |
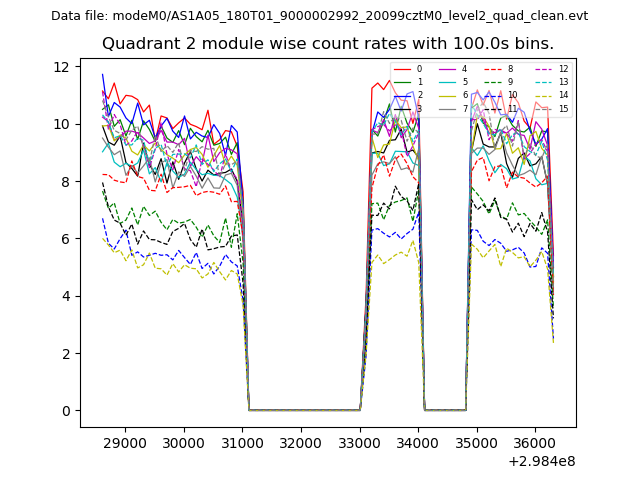 |
 |
| Module-wise count rates for Quadrant D Data is divided into 100 sec bins |
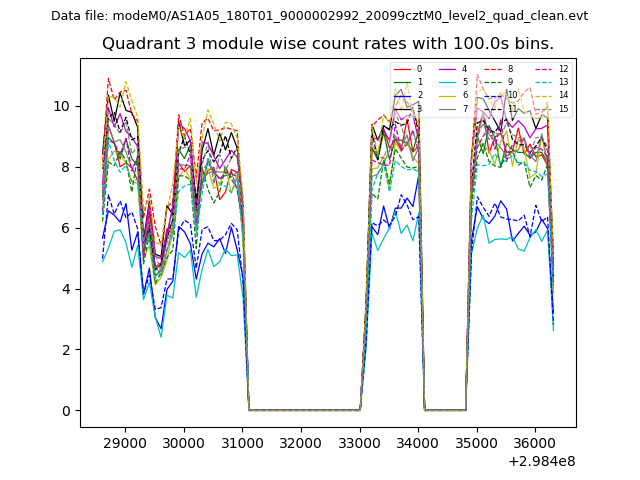 |
 |
| Parameter | Plot |
|---|---|
| CZT HV Monitor | 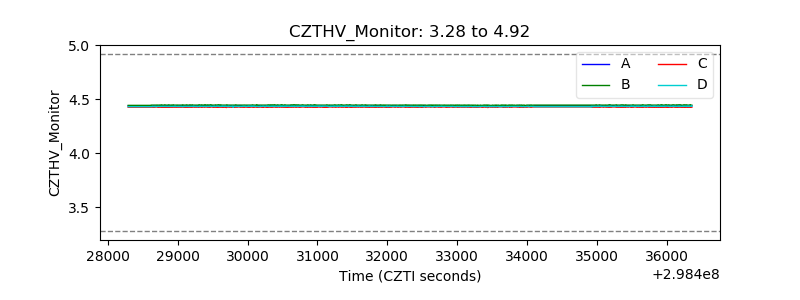 |
| D_VDD | 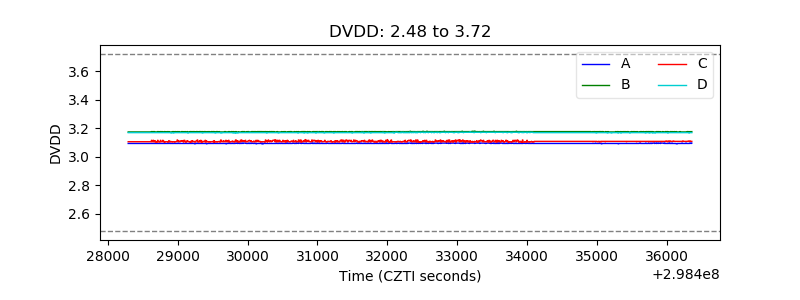 |
| Temperature 1 |  |
| Veto HV Monitor |  |
| Veto LLD | 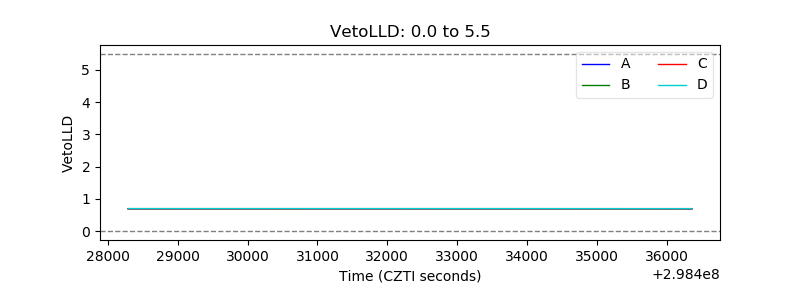 |
| Alpha Counter | 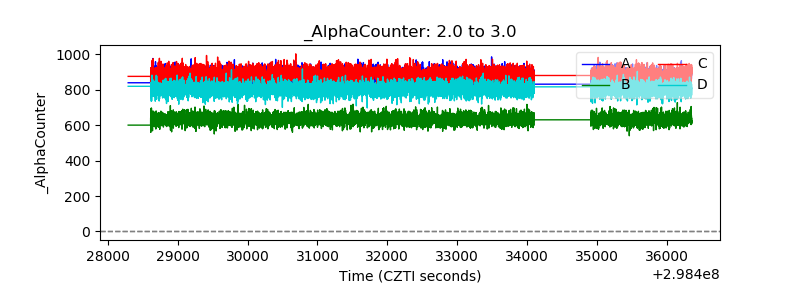 |
| _CPM_Rate | 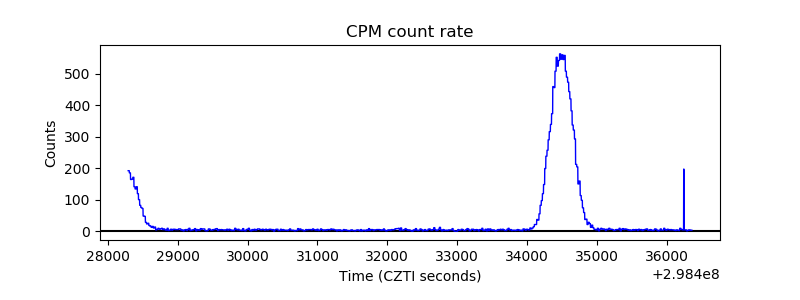 |
| CZT Counter |  |
| +2.5 Volts monitor | 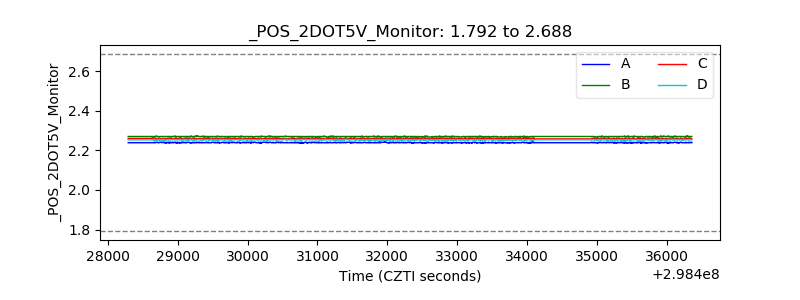 |
| +5 Volts monitor | 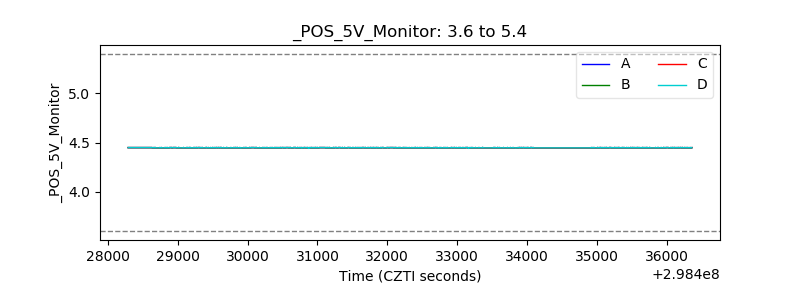 |
| _ROLL_ROT | 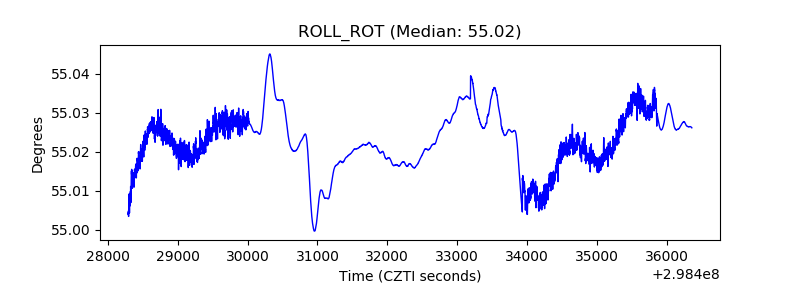 |
| _Roll_DEC | 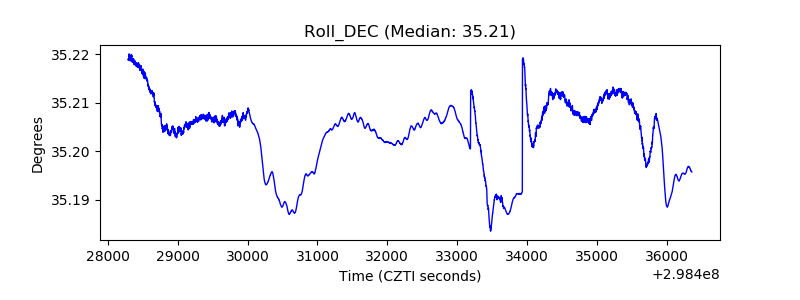 |
| _Roll_RA |  |
| Veto Counter | 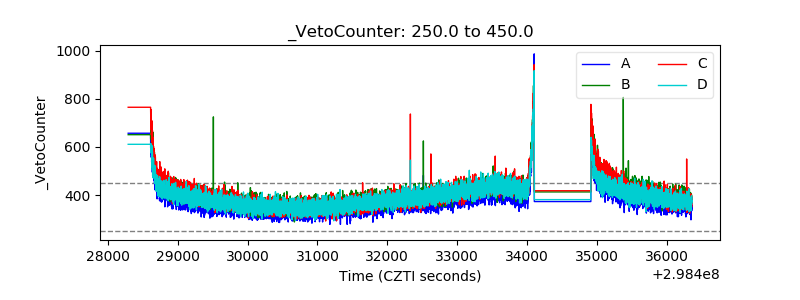 |