| Param | Original file | Final file |
|---|---|---|
| Filename | modeM0/AS1A05_180T01_9000002992_20100cztM0_level2.evt | modeM0/AS1A05_180T01_9000002992_20100cztM0_level2_quad_clean.evt |
| Size (bytes) | 566,562,240 | 99,587,520 |
| Size | 540.3 MB | 95.0 MB |
| Events in quadrant A | 5,257,527 | 600,015 |
| Events in quadrant B | 3,917,895 | 673,578 |
| Events in quadrant C | 3,207,134 | 645,711 |
| Events in quadrant D | 4,324,490 | 632,164 |
| Mode M9 | |||
|---|---|---|---|
| Quadrant | BADHDUFLAG | Total packets | Discarded packets |
| A | 0 | 11 | 0 |
| B | 0 | 12 | 0 |
| C | 0 | 12 | 0 |
| D | 0 | 12 | 0 |
| Mode M0 | |||
|---|---|---|---|
| Quadrant | BADHDUFLAG | Total packets | Discarded packets |
| A | 0 | 19924 | 2 |
| B | 0 | 16093 | 2 |
| C | 0 | 13757 | 2 |
| D | 0 | 17404 | 2 |
| Mode SS | |||
|---|---|---|---|
| Quadrant | BADHDUFLAG | Total packets | Discarded packets |
| A | 0 | 134 | 0 |
| B | 0 | 134 | 0 |
| C | 0 | 134 | 0 |
| D | 0 | 134 | 0 |
| Quadrant | Total seconds | Saturated seconds | Saturation percentage |
|---|---|---|---|
| A | 6660 | 933 | 14.009009% |
| B | 6660 | 78 | 1.171171% |
| C | 6660 | 78 | 1.171171% |
| D | 6660 | 255 | 3.828829% |
Noise dominated data is calculated using 1-second bins in cleaned event files. If a bin has >2000 counts, and if more than 50% of those come from <1% of pixels, then it is considered to be noise-dominated and hence unusable.
| Quadrant | # 1 sec bins | Bins with >0 counts | Bins with >2000 counts | High rate bins dominated by noise | Noise dominated (total time) | Noise dominated (detector-on time) | Marked lightcurve |
|---|---|---|---|---|---|---|---|
| A | 7645 | 6660 | 532 | 532 | 6.96% | 7.99% | 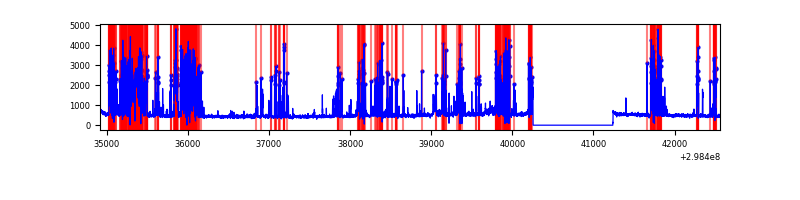 |
| B | 7645 | 6661 | 8 | 8 | 0.10% | 0.12% | 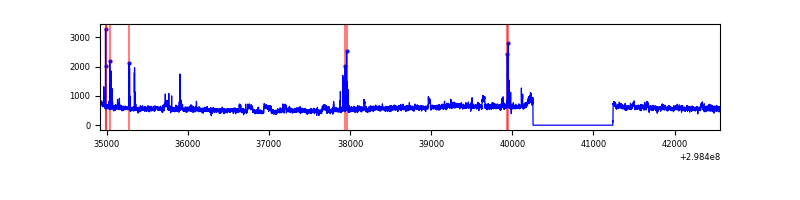 |
| C | 7645 | 6661 | 0 | 0 | 0.00% | 0.00% |  |
| D | 7645 | 6661 | 169 | 169 | 2.21% | 2.54% | 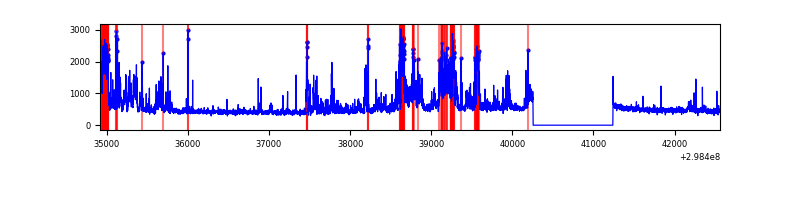 |
Top three noisy pixels from each quadrant. If the there are fewer than three noisy pixels in the level2.evt file, extra rows are filled as -1
| Pixel properties | Quadrant properties | ||||||
|---|---|---|---|---|---|---|---|
| Quadrant | DetID | PixID | Counts | Sigma | Mean | Median | Sigma |
| A | 14 | 238 | 2279619 | 14972.82 | 756 | 742 | 152.2 |
| A | 14 | 237 | 42608 | 275.07 | 756 | 742 | 152.2 |
| A | 14 | 254 | 11051 | 67.73 | 756 | 742 | 152.2 |
| B | 10 | 245 | 645479 | 4142.74 | 815 | 796 | 155.6 |
| B | 4 | 80 | 54888 | 347.6 | 815 | 796 | 155.6 |
| B | 12 | 111 | 18928 | 116.52 | 815 | 796 | 155.6 |
| C | 14 | 238 | 123201 | 663.75 | 784 | 790 | 184.4 |
| C | 3 | 233 | 27929 | 147.16 | 784 | 790 | 184.4 |
| C | 13 | 61 | 5447 | 25.25 | 784 | 790 | 184.4 |
| D | 1 | 52 | 807292 | 4215.58 | 787 | 765 | 191.3 |
| D | 12 | 218 | 470323 | 2454.3 | 787 | 765 | 191.3 |
| D | 2 | 234 | 32334 | 165.01 | 787 | 765 | 191.3 |
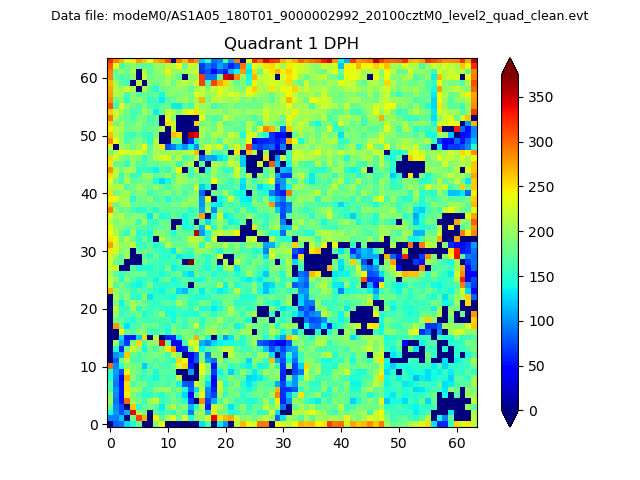
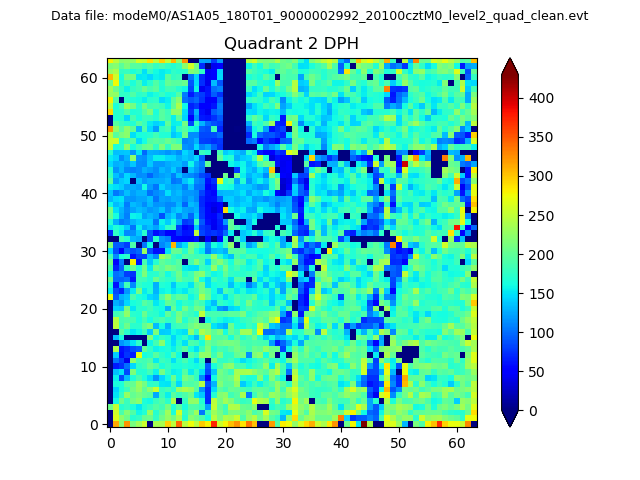
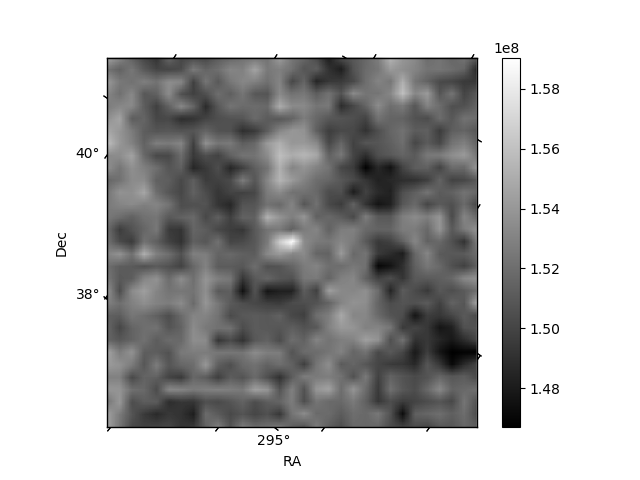
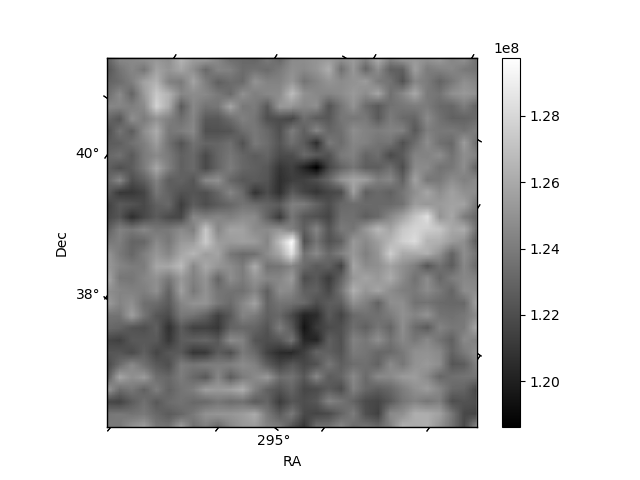
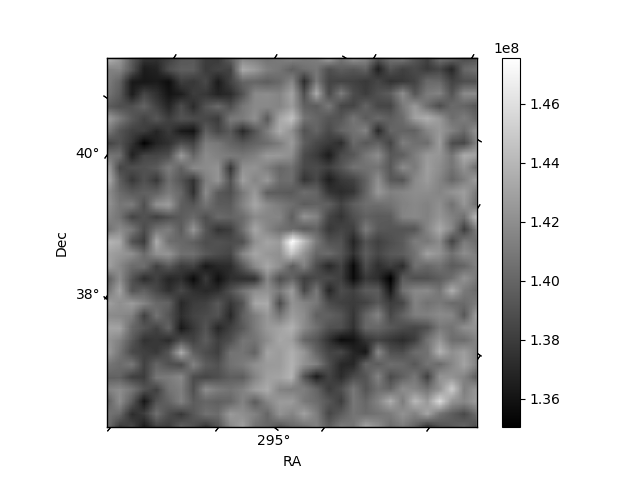
Histogram calculated using DETX and DETY for each event in the final _common_clean file
| Quadrant A | 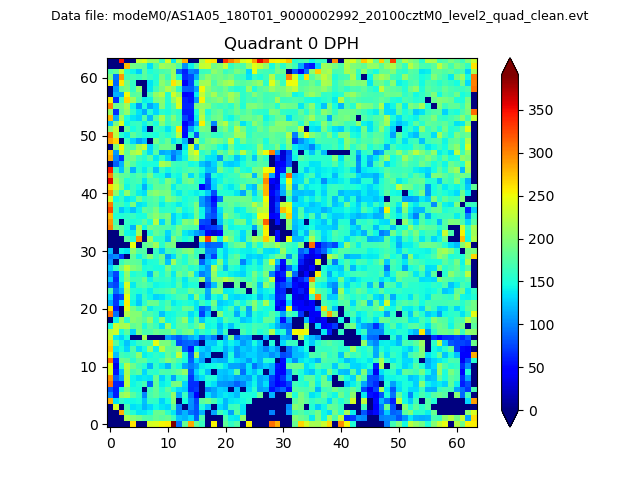 |
 |
Quadrant B |
|---|---|---|---|
| Quadrant D |  |
 |
Quadrant C |
| Plot type | Count rate plots | Images |
|---|---|---|
| Comparison with Poisson distribution Blue bars denote a histogram of data divided into 1 sec bins. Red curve is a Poisson curve with rate = median count rate of data. |
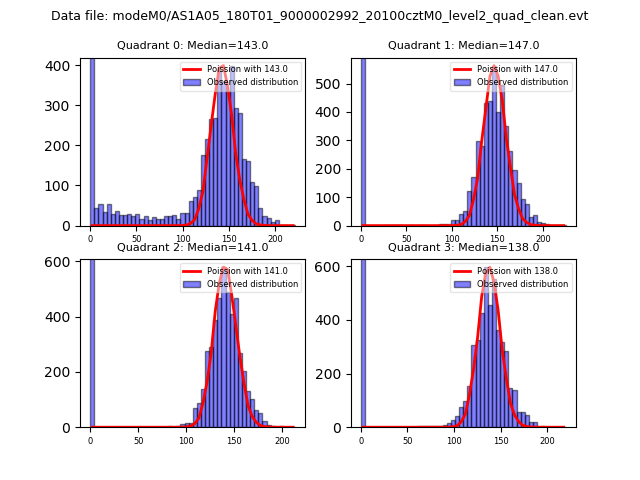 |
 |
| Quadrant-wise count rates Data is divided into 100 sec bins |
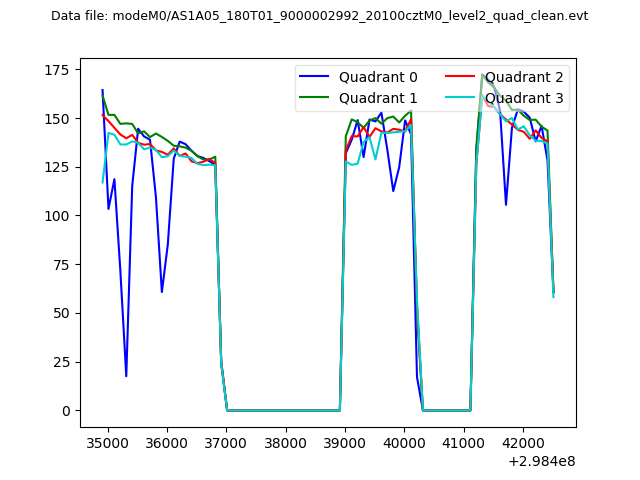 |
|
| Module-wise count rates for Quadrant A Data is divided into 100 sec bins |
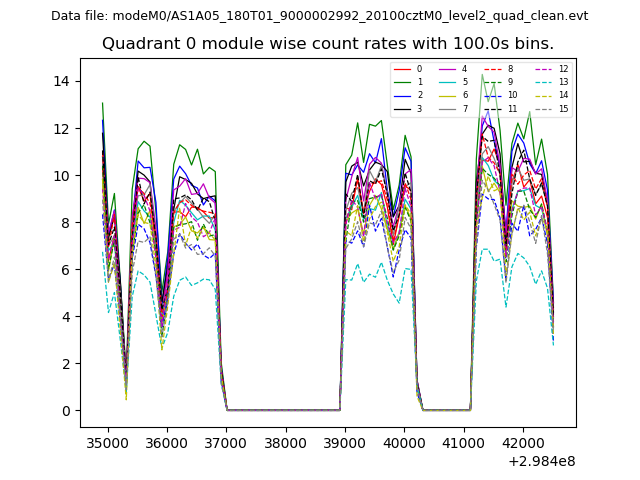 |
 |
| Module-wise count rates for Quadrant B Data is divided into 100 sec bins |
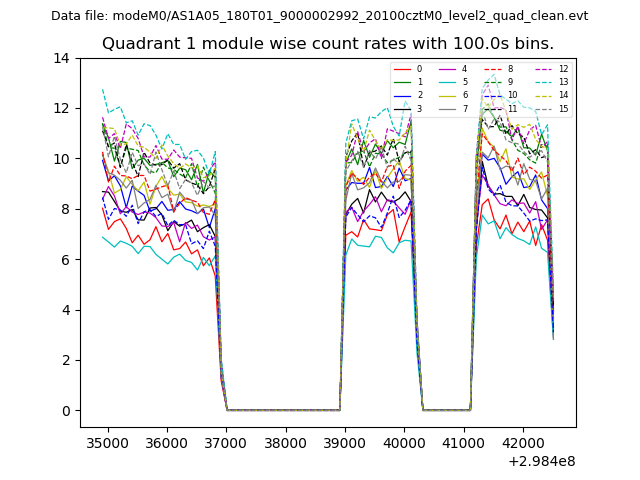 |
 |
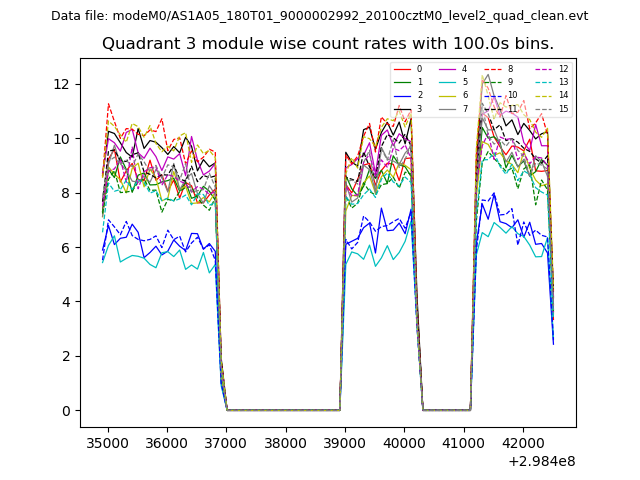
| Module-wise count rates for Quadrant C Data is divided into 100 sec bins |
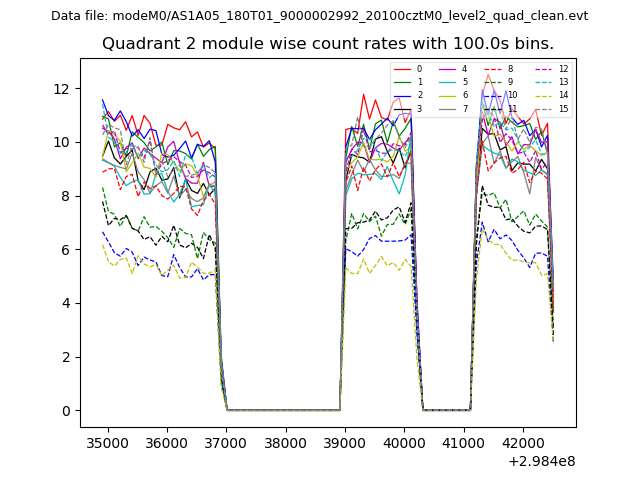 |
 |
| Module-wise count rates for Quadrant D Data is divided into 100 sec bins |
 |
 |
| Parameter | Plot |
|---|---|
| CZT HV Monitor | 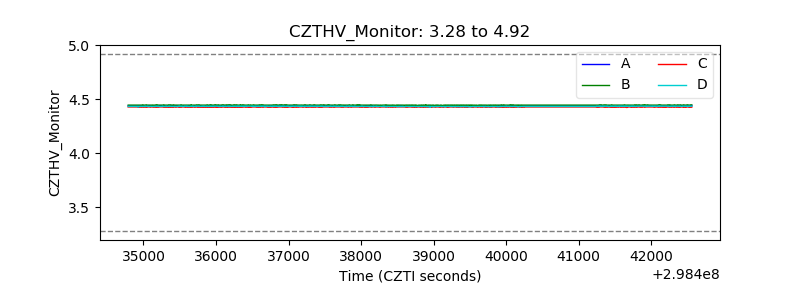 |
| D_VDD | 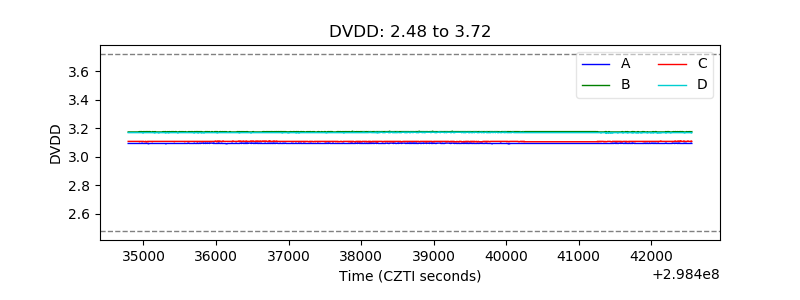 |
| Temperature 1 | 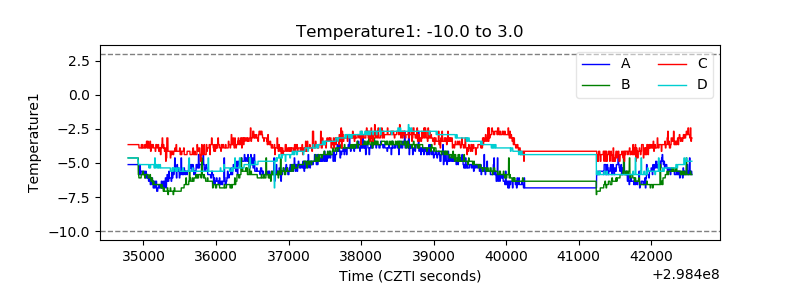 |
| Veto HV Monitor | 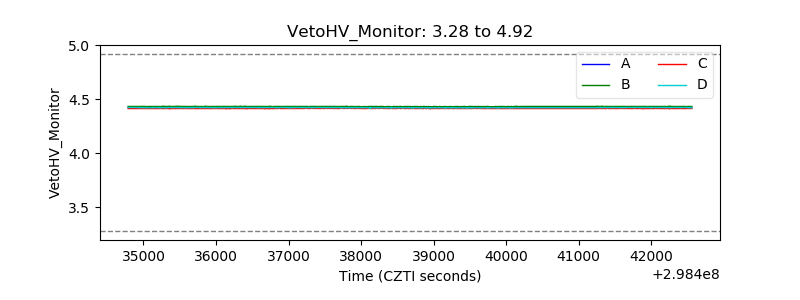 |
| Veto LLD | 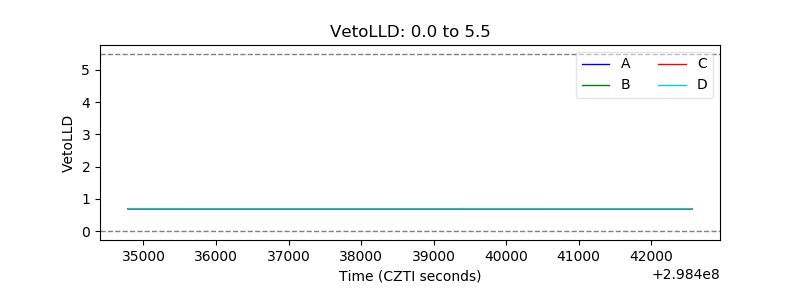 |
| Alpha Counter | 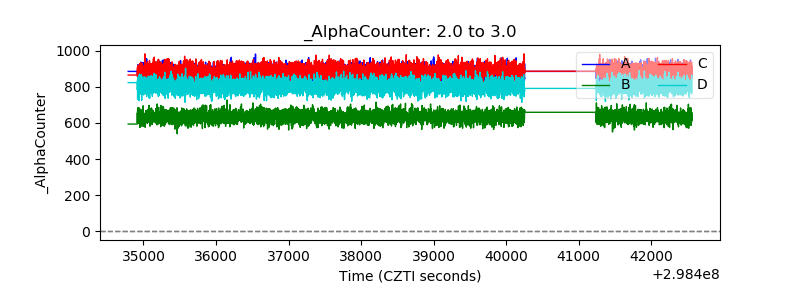 |
| _CPM_Rate | 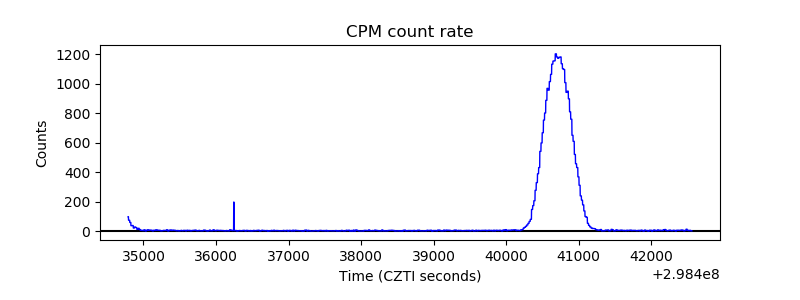 |
| CZT Counter | 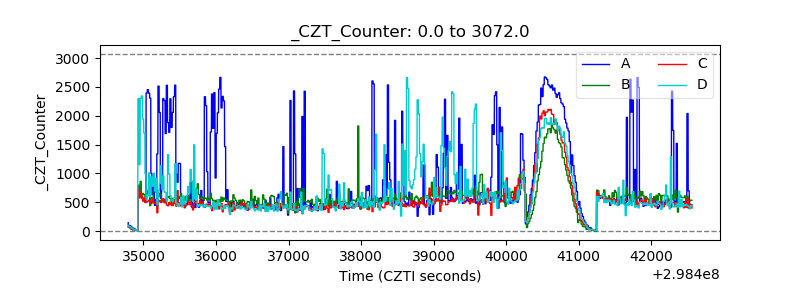 |
| +2.5 Volts monitor |  |
| +5 Volts monitor |  |
| _ROLL_ROT | 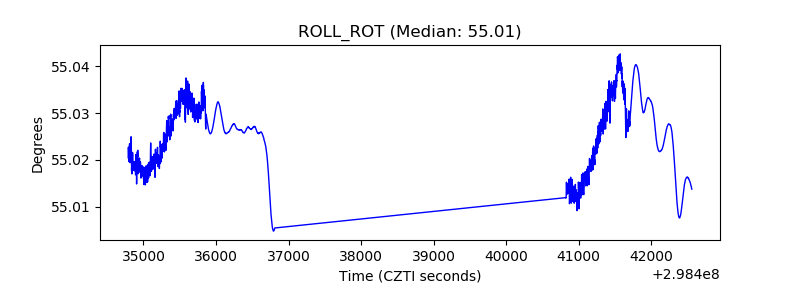 |
| _Roll_DEC | 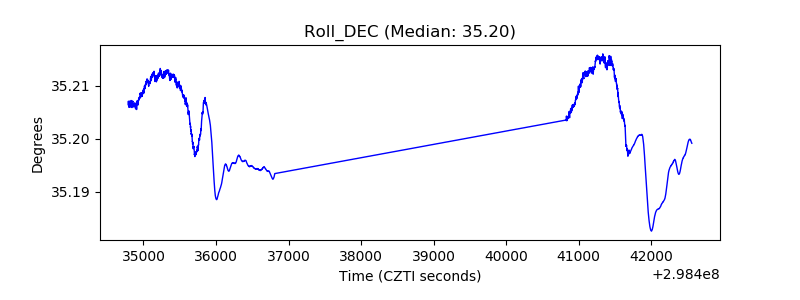 |
| _Roll_RA |  |
| Veto Counter | 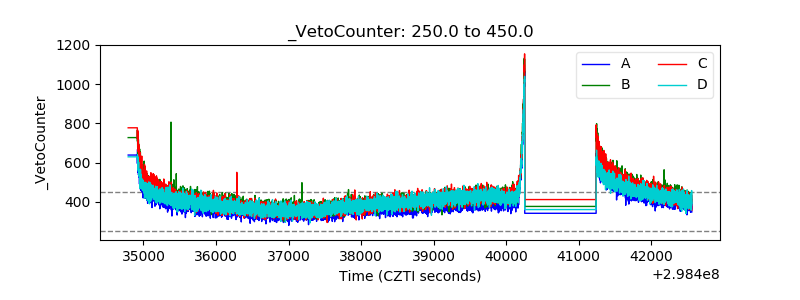 |