| Param | Original file | Final file |
|---|---|---|
| Filename | modeM0/AS1A05_180T01_9000002992_20103cztM0_level2.evt | modeM0/AS1A05_180T01_9000002992_20103cztM0_level2_quad_clean.evt |
| Size (bytes) | 579,346,560 | 80,602,560 |
| Size | 552.5 MB | 76.9 MB |
| Events in quadrant A | 4,502,316 | 504,508 |
| Events in quadrant B | 5,386,999 | 519,973 |
| Events in quadrant C | 3,042,850 | 505,087 |
| Events in quadrant D | 4,213,172 | 497,997 |
| Mode M9 | |||
|---|---|---|---|
| Quadrant | BADHDUFLAG | Total packets | Discarded packets |
| A | 0 | 12 | 0 |
| B | 0 | 12 | 0 |
| C | 0 | 12 | 0 |
| D | 0 | 12 | 0 |
| Mode M0 | |||
|---|---|---|---|
| Quadrant | BADHDUFLAG | Total packets | Discarded packets |
| A | 0 | 17041 | 1 |
| B | 0 | 20141 | 1 |
| C | 0 | 12568 | 2 |
| D | 0 | 16241 | 1 |
| Mode SS | |||
|---|---|---|---|
| Quadrant | BADHDUFLAG | Total packets | Discarded packets |
| A | 0 | 120 | 0 |
| B | 0 | 120 | 0 |
| C | 0 | 120 | 0 |
| D | 0 | 120 | 0 |
| Quadrant | Total seconds | Saturated seconds | Saturation percentage |
|---|---|---|---|
| A | 5911 | 622 | 10.522754% |
| B | 5911 | 676 | 11.436305% |
| C | 5910 | 93 | 1.573604% |
| D | 5911 | 285 | 4.821519% |
Noise dominated data is calculated using 1-second bins in cleaned event files. If a bin has >2000 counts, and if more than 50% of those come from <1% of pixels, then it is considered to be noise-dominated and hence unusable.
| Quadrant | # 1 sec bins | Bins with >0 counts | Bins with >2000 counts | High rate bins dominated by noise | Noise dominated (total time) | Noise dominated (detector-on time) | Marked lightcurve |
|---|---|---|---|---|---|---|---|
| A | 7131 | 5912 | 389 | 389 | 5.46% | 6.58% | 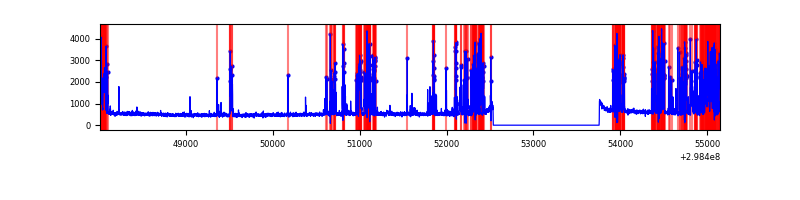 |
| B | 7131 | 5912 | 505 | 505 | 7.08% | 8.54% |  |
| C | 7130 | 5911 | 0 | 0 | 0.00% | 0.00% |  |
| D | 7131 | 5912 | 255 | 255 | 3.58% | 4.31% | 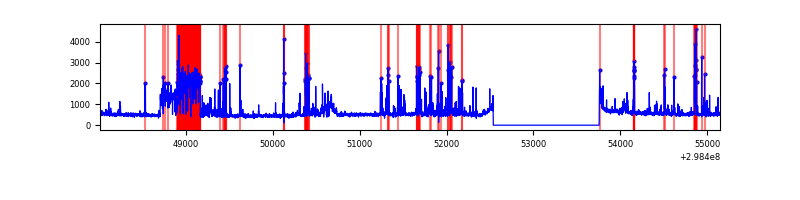 |
Top three noisy pixels from each quadrant. If the there are fewer than three noisy pixels in the level2.evt file, extra rows are filled as -1
| Pixel properties | Quadrant properties | ||||||
|---|---|---|---|---|---|---|---|
| Quadrant | DetID | PixID | Counts | Sigma | Mean | Median | Sigma |
| A | 14 | 238 | 1404150 | 9232.74 | 763 | 753 | 152.0 |
| A | 14 | 254 | 148520 | 972.14 | 763 | 753 | 152.0 |
| A | 13 | 254 | 7527 | 44.57 | 763 | 753 | 152.0 |
| B | 10 | 245 | 2268989 | 15649.3 | 768 | 753 | 144.9 |
| B | 4 | 80 | 60621 | 413.05 | 768 | 753 | 144.9 |
| B | 0 | 198 | 44482 | 301.7 | 768 | 753 | 144.9 |
| C | 14 | 238 | 120222 | 690.75 | 748 | 756 | 173.0 |
| C | 13 | 61 | 5226 | 25.85 | 748 | 756 | 173.0 |
| C | 3 | 233 | 4670 | 22.63 | 748 | 756 | 173.0 |
| D | 7 | 238 | 605769 | 3298.93 | 760 | 741 | 183.4 |
| D | 7 | 96 | 394033 | 2144.43 | 760 | 741 | 183.4 |
| D | 11 | 176 | 288381 | 1568.36 | 760 | 741 | 183.4 |
Histogram calculated using DETX and DETY for each event in the final _common_clean file
| Quadrant A | 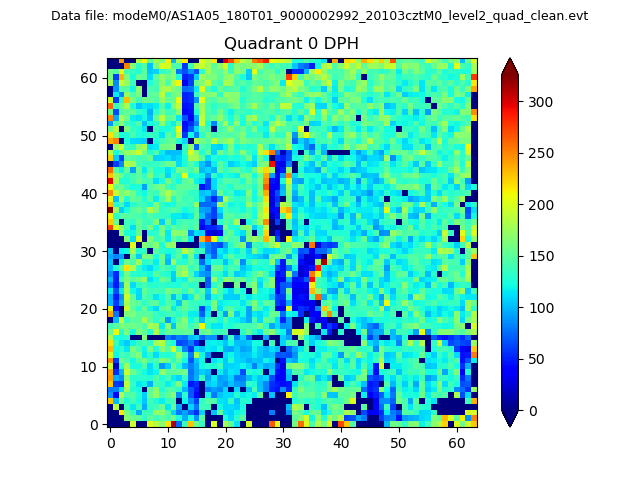 |
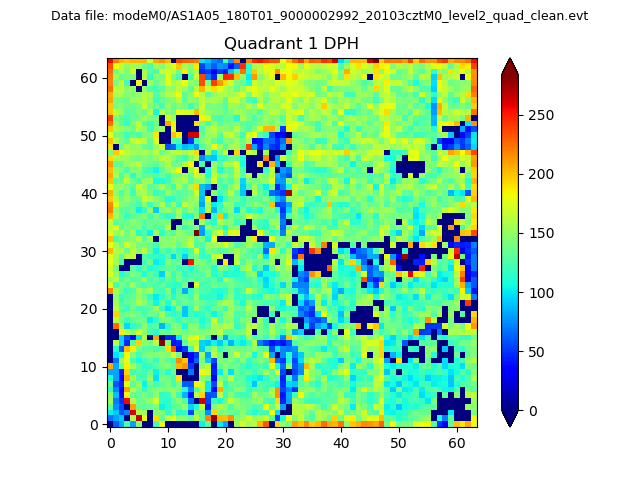 |
Quadrant B |
|---|---|---|---|
| Quadrant D | 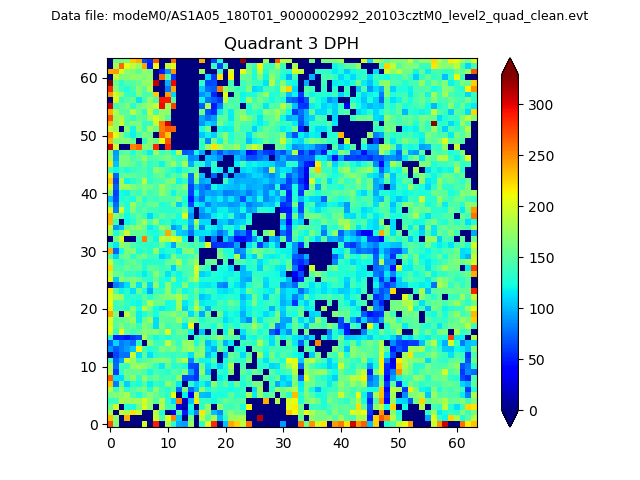 |
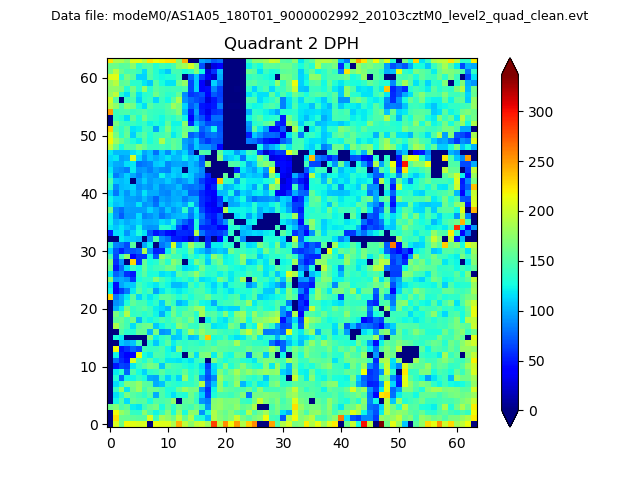 |
Quadrant C |
| Plot type | Count rate plots | Images |
|---|---|---|
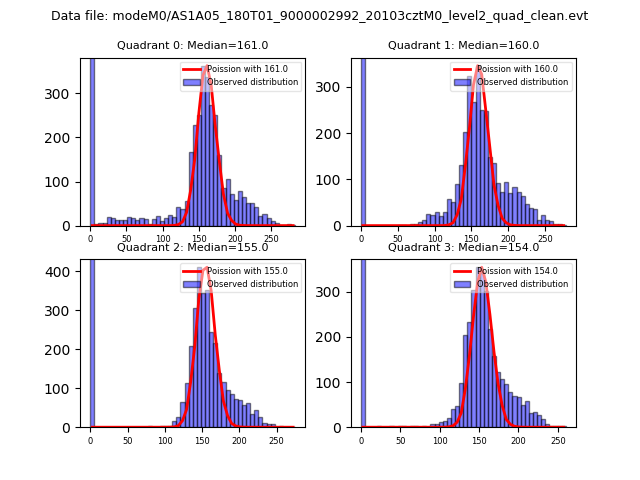
| Comparison with Poisson distribution Blue bars denote a histogram of data divided into 1 sec bins. Red curve is a Poisson curve with rate = median count rate of data. |
 |
 |
| Quadrant-wise count rates Data is divided into 100 sec bins |
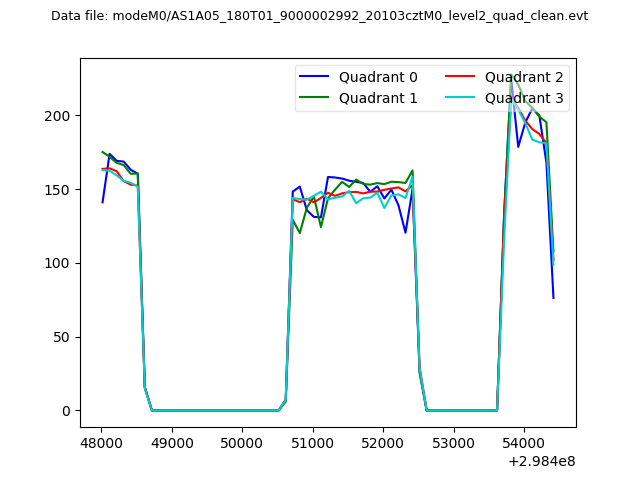 |
|
| Module-wise count rates for Quadrant A Data is divided into 100 sec bins |
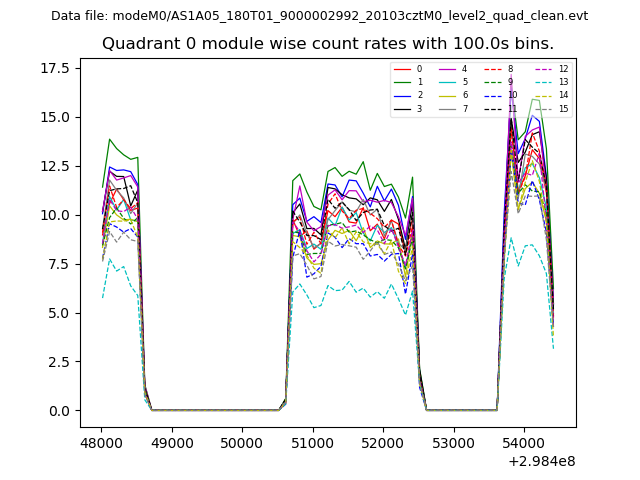 |
 |
| Module-wise count rates for Quadrant B Data is divided into 100 sec bins |
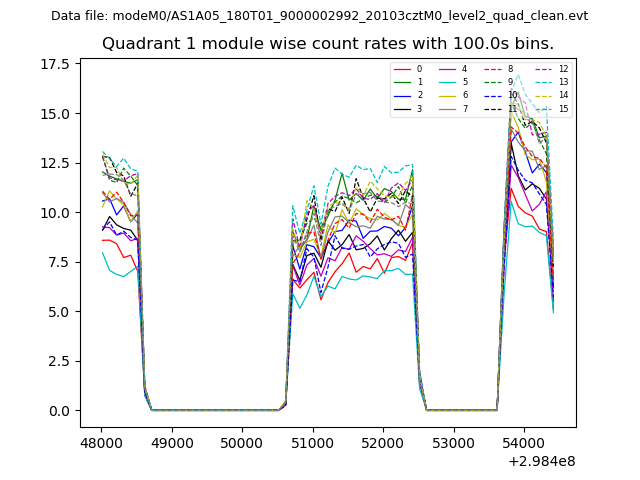 |
 |
| Module-wise count rates for Quadrant C Data is divided into 100 sec bins |
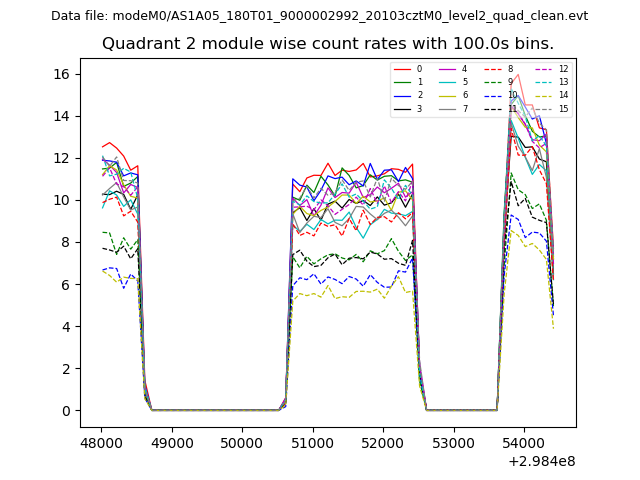 |
 |
| Module-wise count rates for Quadrant D Data is divided into 100 sec bins |
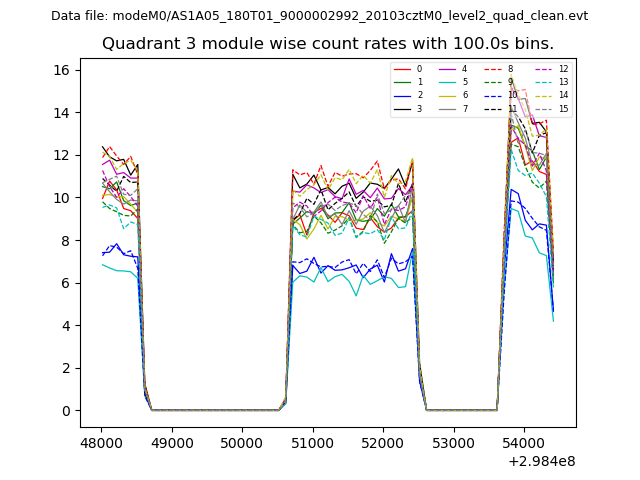 |
 |
| Parameter | Plot |
|---|---|
| CZT HV Monitor | 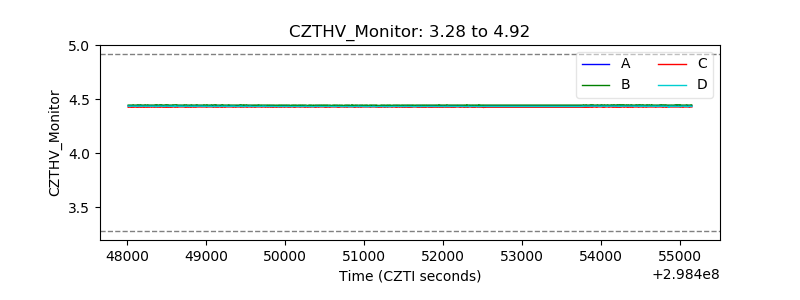 |
| D_VDD | 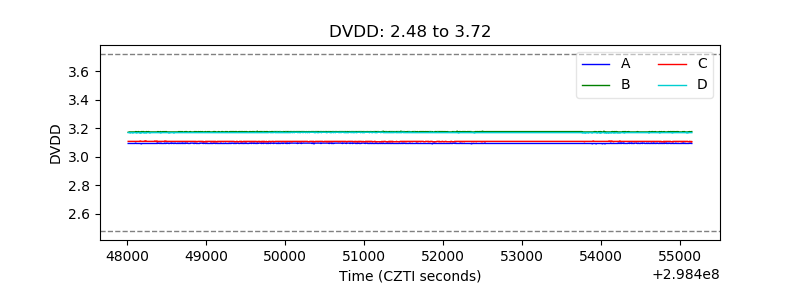 |
| Temperature 1 | 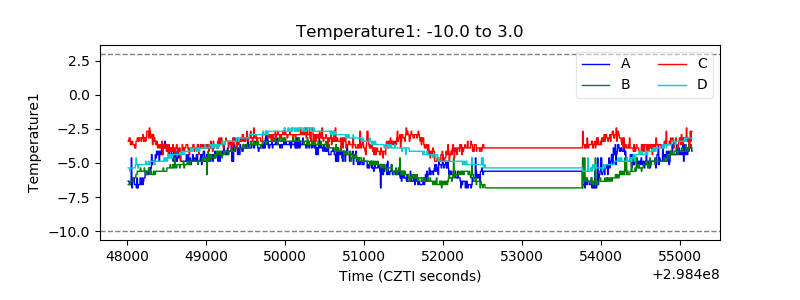 |
| Veto HV Monitor | 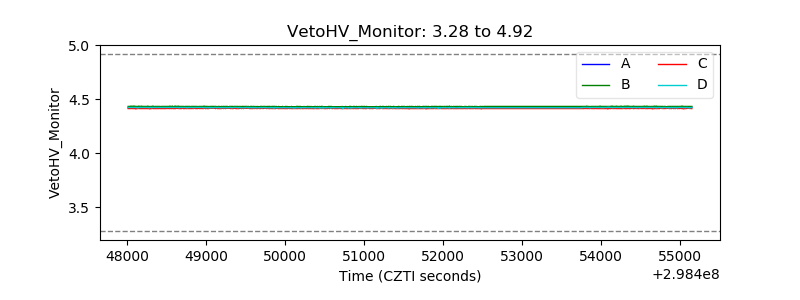 |
| Veto LLD | 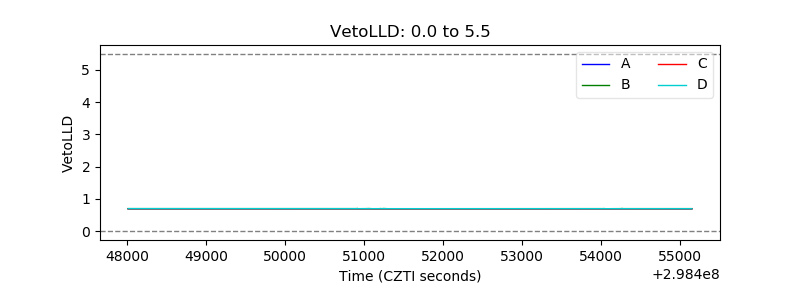 |
| Alpha Counter | 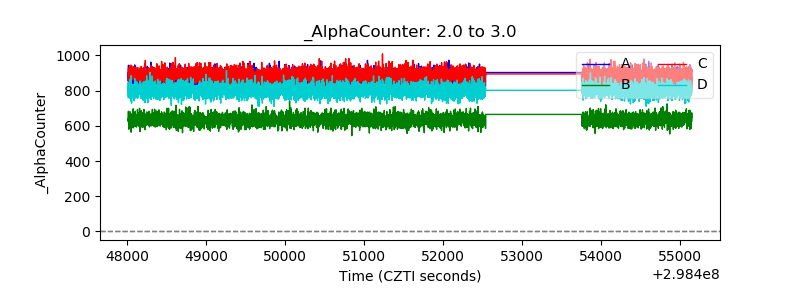 |
| _CPM_Rate | 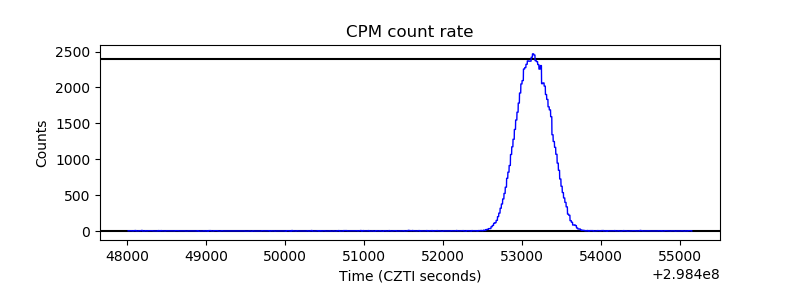 |
| CZT Counter | 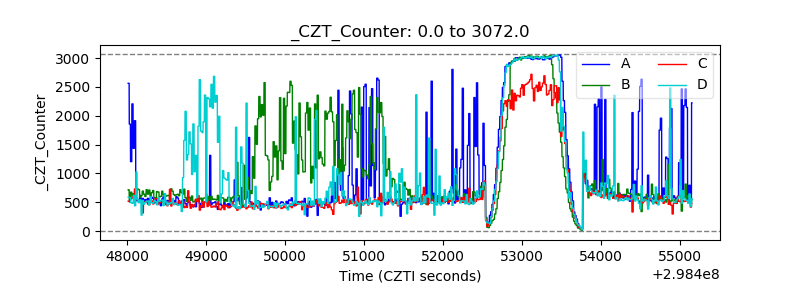 |
| +2.5 Volts monitor |  |
| +5 Volts monitor |  |
| _ROLL_ROT | 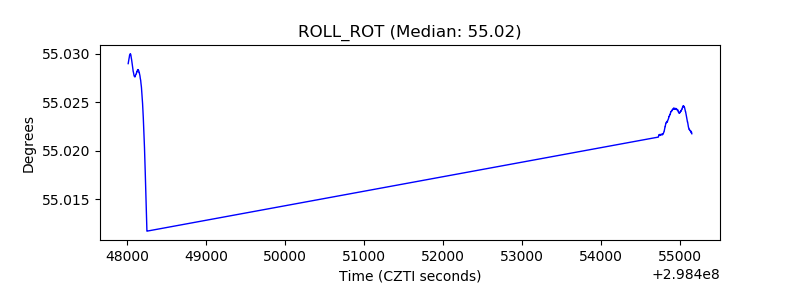 |
| _Roll_DEC | 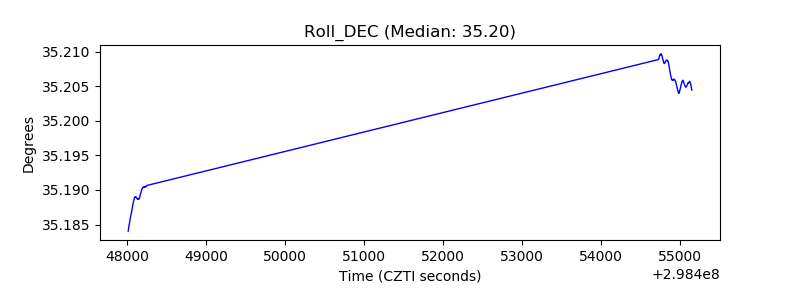 |
| _Roll_RA | 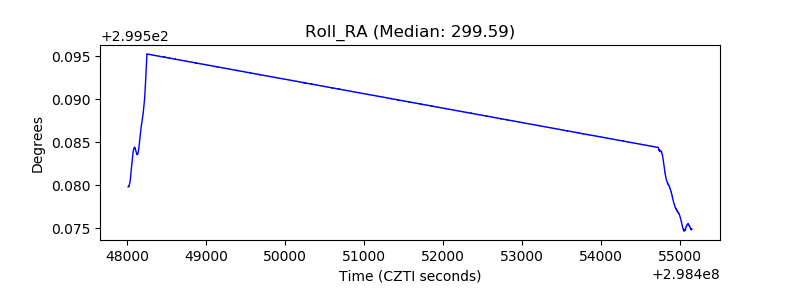 |
| Veto Counter | 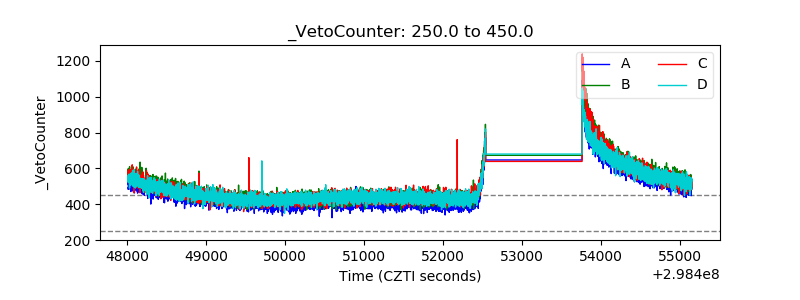 |