| Param | Original file | Final file |
|---|---|---|
| Filename | modeM0/AS1A05_180T01_9000002992_20104cztM0_level2.evt | modeM0/AS1A05_180T01_9000002992_20104cztM0_level2_quad_clean.evt |
| Size (bytes) | 660,614,400 | 84,718,080 |
| Size | 630.0 MB | 80.8 MB |
| Events in quadrant A | 6,105,398 | 515,289 |
| Events in quadrant B | 5,988,713 | 546,398 |
| Events in quadrant C | 3,471,933 | 534,130 |
| Events in quadrant D | 4,012,288 | 526,959 |
| Mode M9 | |||
|---|---|---|---|
| Quadrant | BADHDUFLAG | Total packets | Discarded packets |
| A | 0 | 15 | 0 |
| B | 0 | 16 | 0 |
| C | 0 | 16 | 0 |
| D | 0 | 16 | 0 |
| Mode M0 | |||
|---|---|---|---|
| Quadrant | BADHDUFLAG | Total packets | Discarded packets |
| A | 0 | 22290 | 2 |
| B | 0 | 22301 | 2 |
| C | 0 | 14036 | 2 |
| D | 0 | 15843 | 2 |
| Mode SS | |||
|---|---|---|---|
| Quadrant | BADHDUFLAG | Total packets | Discarded packets |
| A | 0 | 130 | 0 |
| B | 0 | 130 | 0 |
| C | 0 | 130 | 0 |
| D | 0 | 130 | 0 |
| Quadrant | Total seconds | Saturated seconds | Saturation percentage |
|---|---|---|---|
| A | 6333 | 1127 | 17.795673% |
| B | 6333 | 718 | 11.337439% |
| C | 6333 | 110 | 1.736934% |
| D | 6333 | 144 | 2.273804% |
Noise dominated data is calculated using 1-second bins in cleaned event files. If a bin has >2000 counts, and if more than 50% of those come from <1% of pixels, then it is considered to be noise-dominated and hence unusable.
| Quadrant | # 1 sec bins | Bins with >0 counts | Bins with >2000 counts | High rate bins dominated by noise | Noise dominated (total time) | Noise dominated (detector-on time) | Marked lightcurve |
|---|---|---|---|---|---|---|---|
| A | 7653 | 6334 | 720 | 720 | 9.41% | 11.37% | 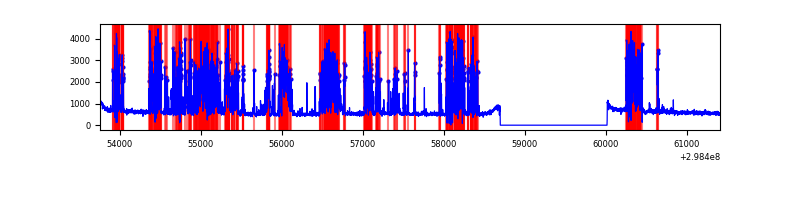 |
| B | 7653 | 6334 | 462 | 462 | 6.04% | 7.29% | 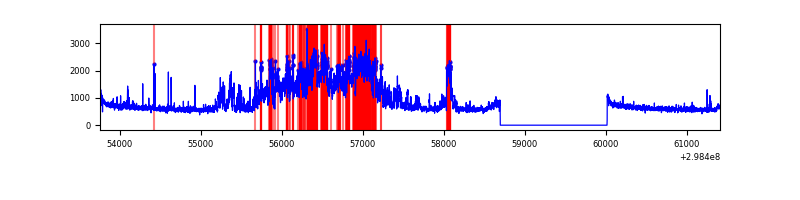 |
| C | 7653 | 6334 | 0 | 0 | 0.00% | 0.00% | 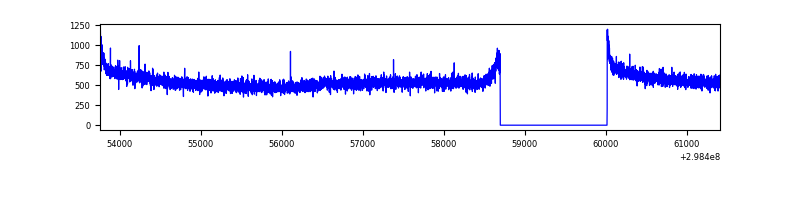 |
| D | 7653 | 6334 | 62 | 62 | 0.81% | 0.98% | 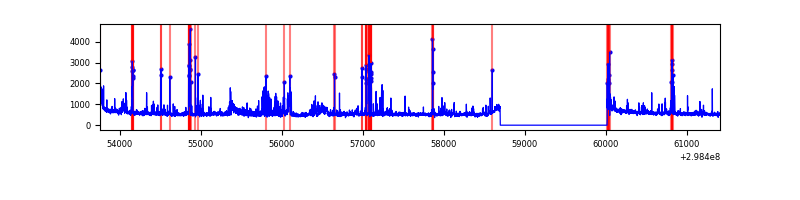 |
Top three noisy pixels from each quadrant. If the there are fewer than three noisy pixels in the level2.evt file, extra rows are filled as -1
| Pixel properties | Quadrant properties | ||||||
|---|---|---|---|---|---|---|---|
| Quadrant | DetID | PixID | Counts | Sigma | Mean | Median | Sigma |
| A | 14 | 238 | 1727736 | 10318.88 | 844 | 832 | 167.4 |
| A | 14 | 254 | 1106089 | 6604.32 | 844 | 832 | 167.4 |
| A | 14 | 237 | 19726 | 112.9 | 844 | 832 | 167.4 |
| B | 10 | 245 | 2484592 | 15106.84 | 880 | 863 | 164.4 |
| B | 0 | 183 | 27341 | 161.05 | 880 | 863 | 164.4 |
| B | 4 | 80 | 23186 | 135.78 | 880 | 863 | 164.4 |
| C | 14 | 238 | 138978 | 704.55 | 853 | 864 | 196.0 |
| C | 3 | 233 | 6349 | 27.98 | 853 | 864 | 196.0 |
| C | 13 | 61 | 5904 | 25.71 | 853 | 864 | 196.0 |
| D | 11 | 176 | 215715 | 1029.65 | 874 | 851 | 208.7 |
| D | 12 | 218 | 188667 | 900.03 | 874 | 851 | 208.7 |
| D | 7 | 96 | 167236 | 797.33 | 874 | 851 | 208.7 |
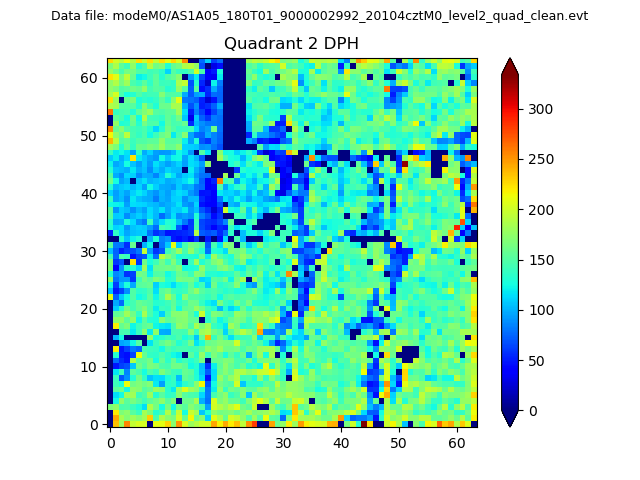
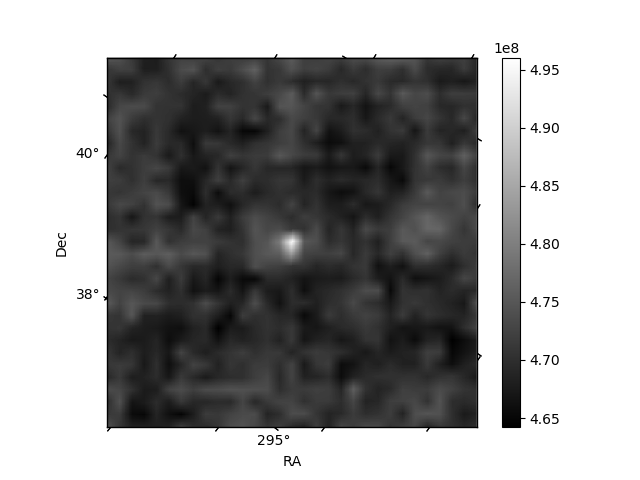
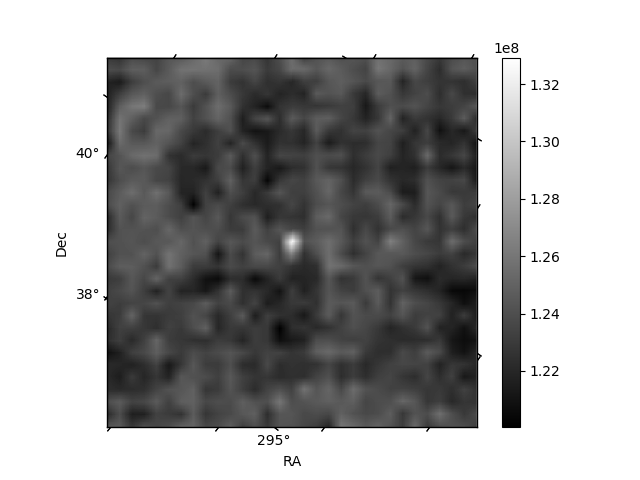
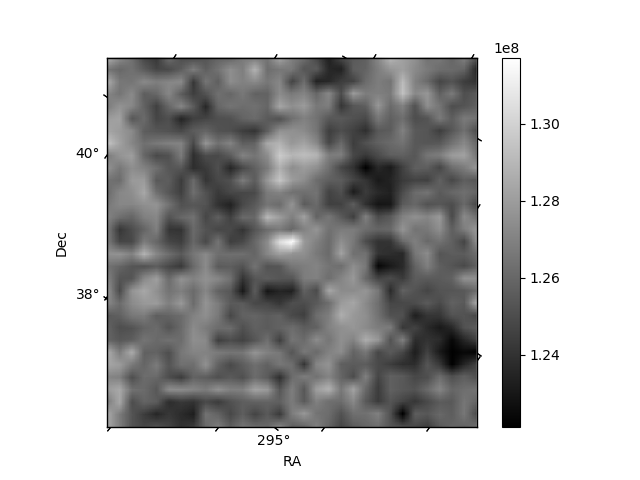
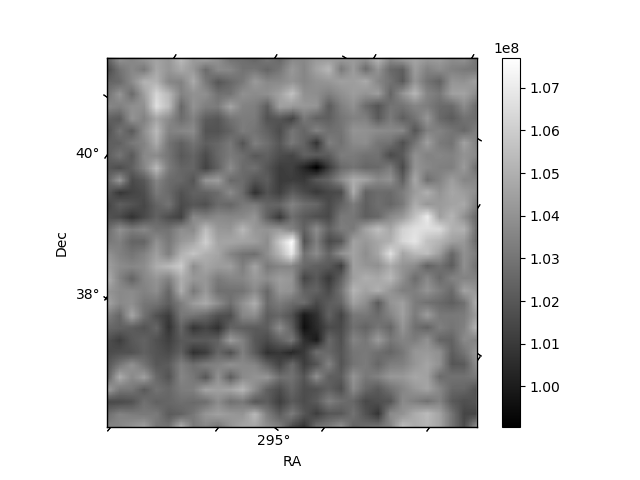
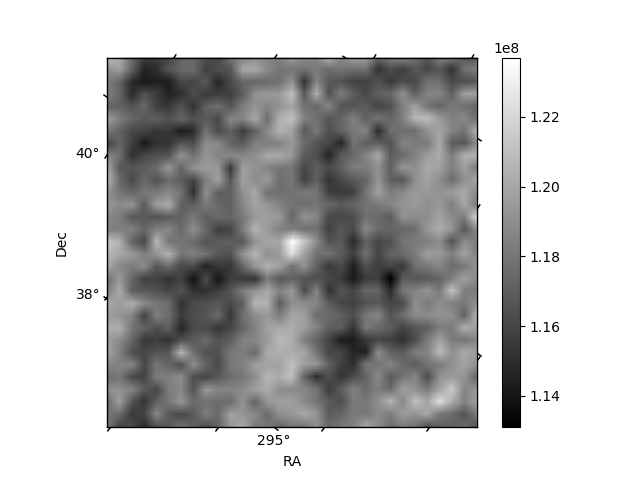
Histogram calculated using DETX and DETY for each event in the final _common_clean file
| Quadrant A | 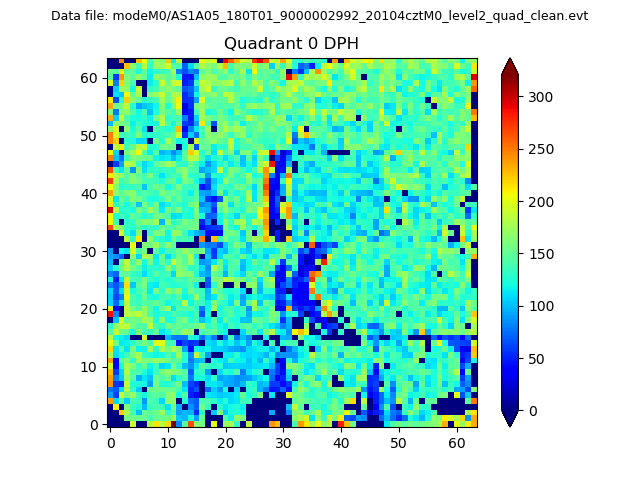 |
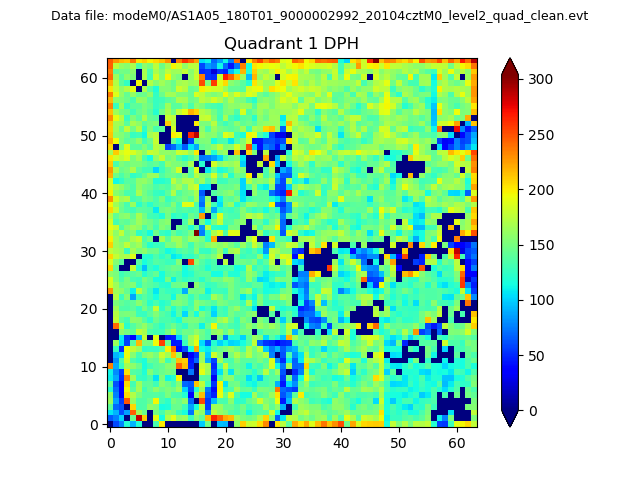 |
Quadrant B |
|---|---|---|---|
| Quadrant D | 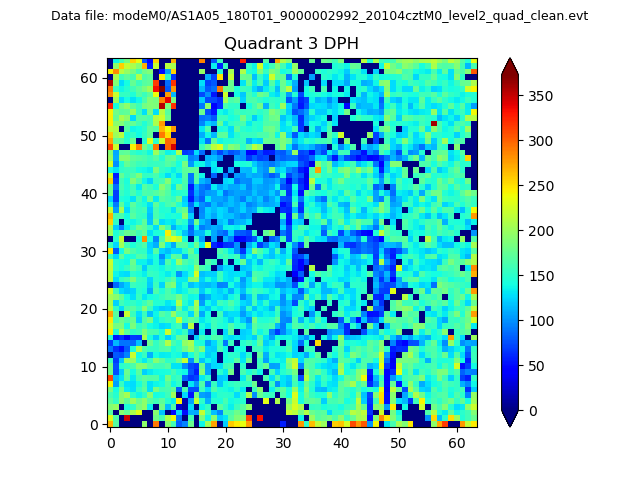 |
 |
Quadrant C |
| Plot type | Count rate plots | Images |
|---|---|---|
| Comparison with Poisson distribution Blue bars denote a histogram of data divided into 1 sec bins. Red curve is a Poisson curve with rate = median count rate of data. |
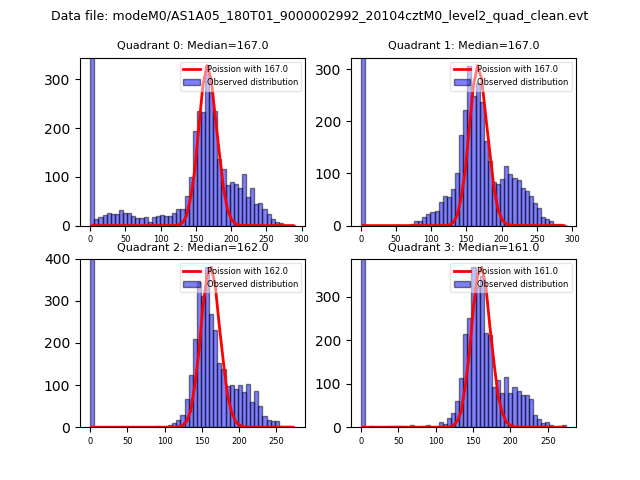 |
 |
| Quadrant-wise count rates Data is divided into 100 sec bins |
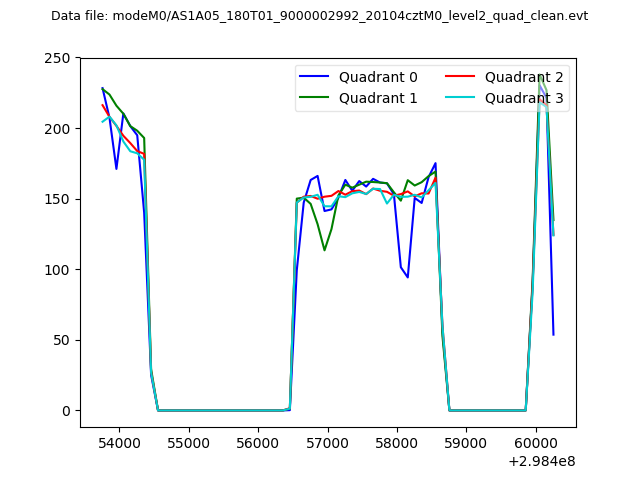 |
|
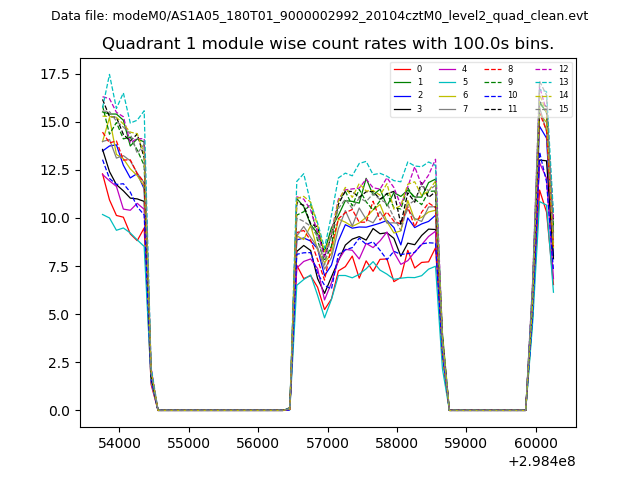
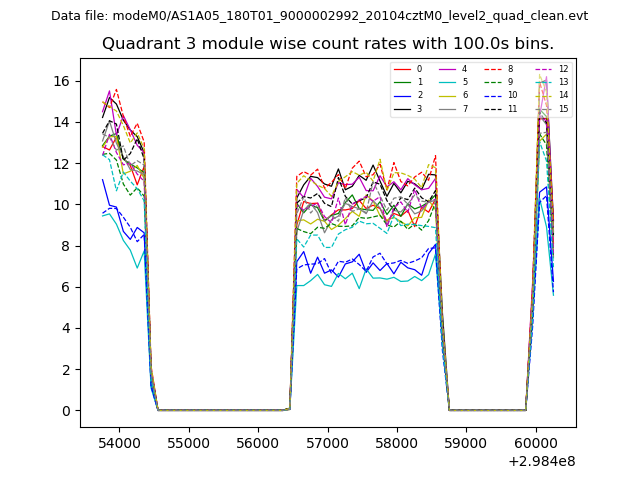
| Module-wise count rates for Quadrant A Data is divided into 100 sec bins |
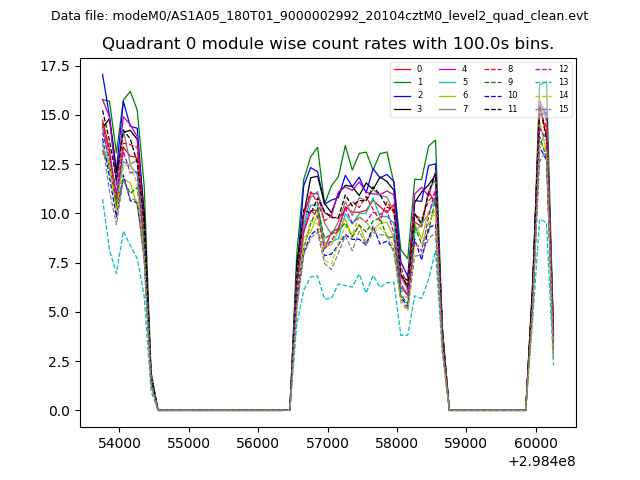 |
 |
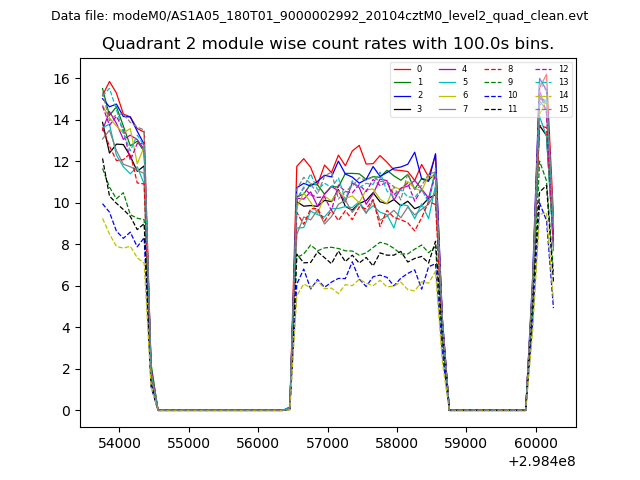
| Module-wise count rates for Quadrant B Data is divided into 100 sec bins |
 |
 |
| Module-wise count rates for Quadrant C Data is divided into 100 sec bins |
 |
 |
| Module-wise count rates for Quadrant D Data is divided into 100 sec bins |
 |
 |
| Parameter | Plot |
|---|---|
| CZT HV Monitor | 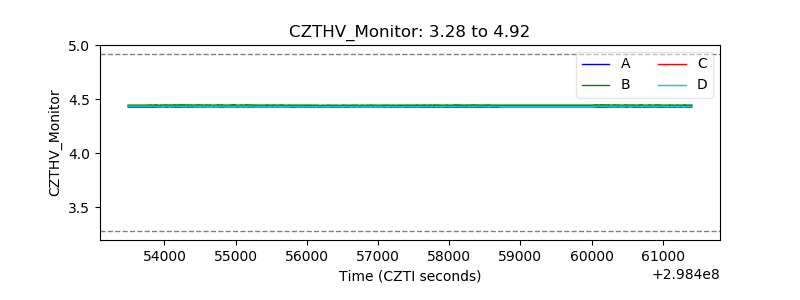 |
| D_VDD | 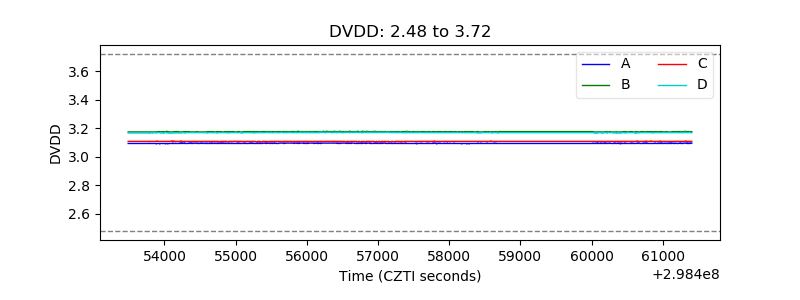 |
| Temperature 1 | 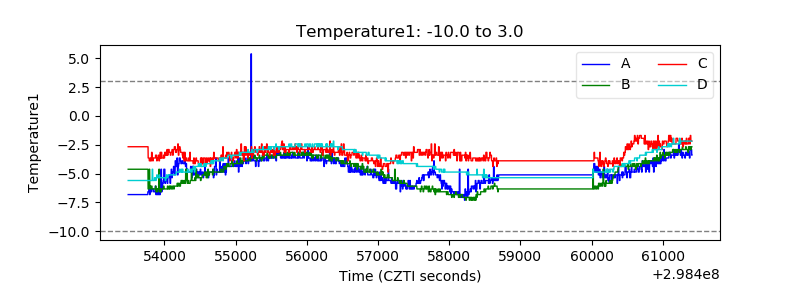 |
| Veto HV Monitor | 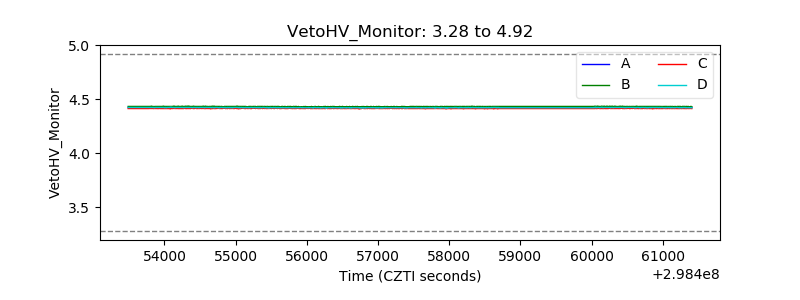 |
| Veto LLD | 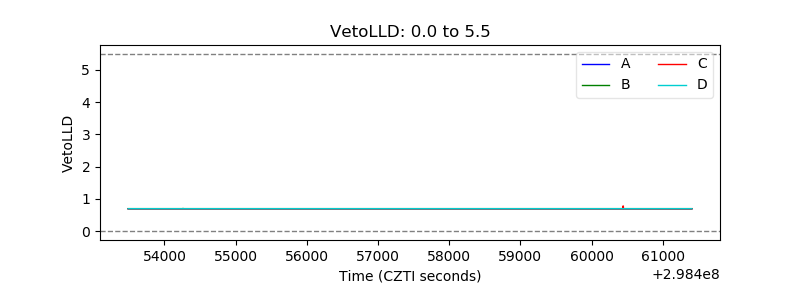 |
| Alpha Counter | 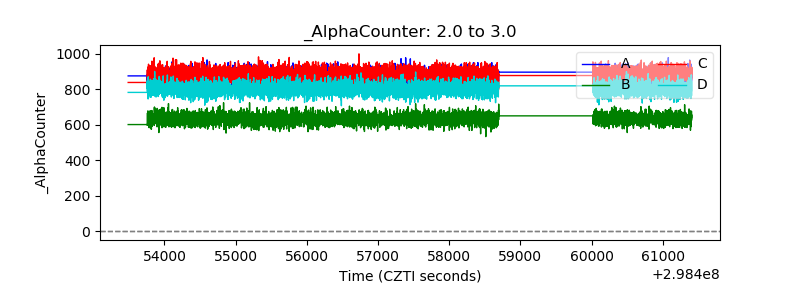 |
| _CPM_Rate | 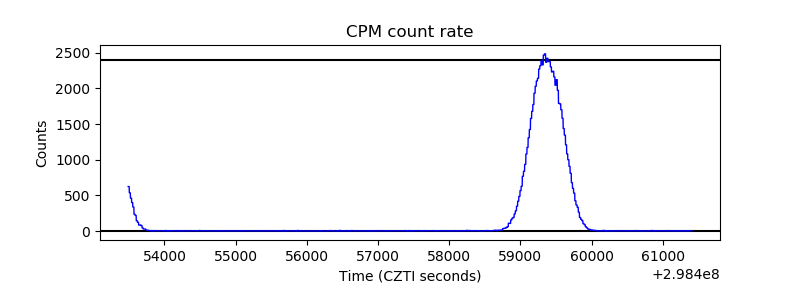 |
| CZT Counter | 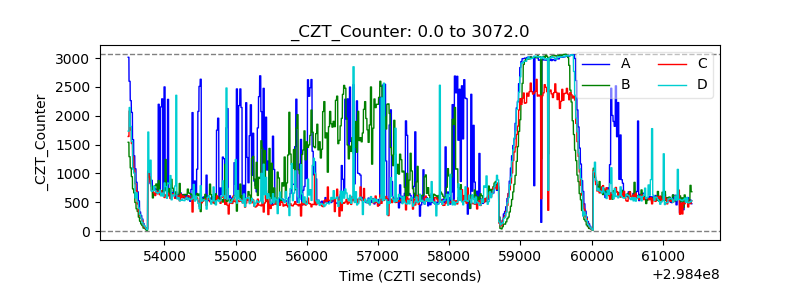 |
| +2.5 Volts monitor | 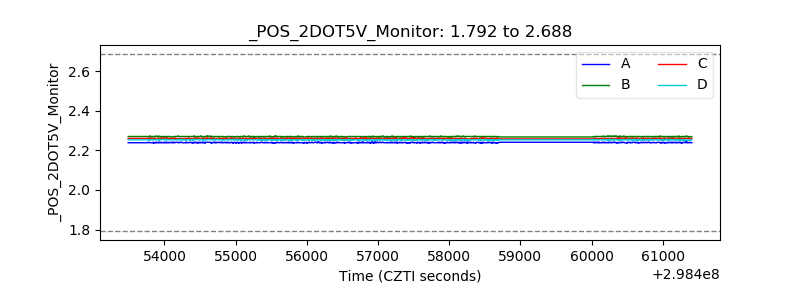 |
| +5 Volts monitor |  |
| _ROLL_ROT | 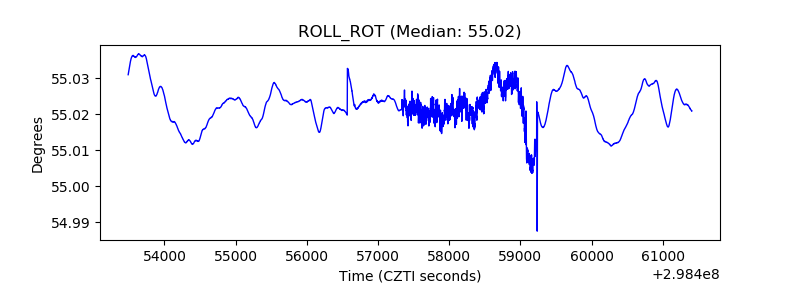 |
| _Roll_DEC | 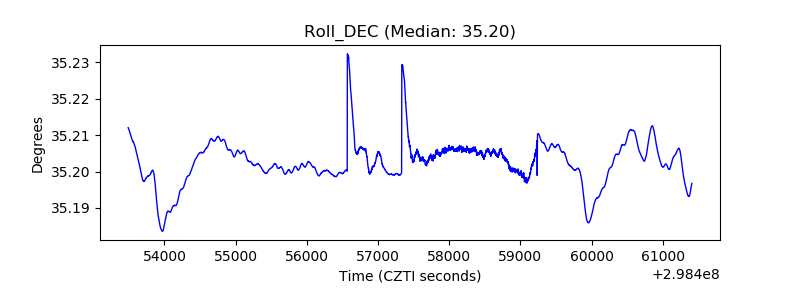 |
| _Roll_RA | 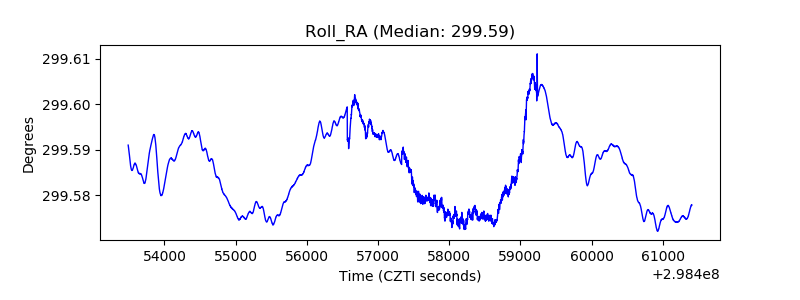 |
| Veto Counter | 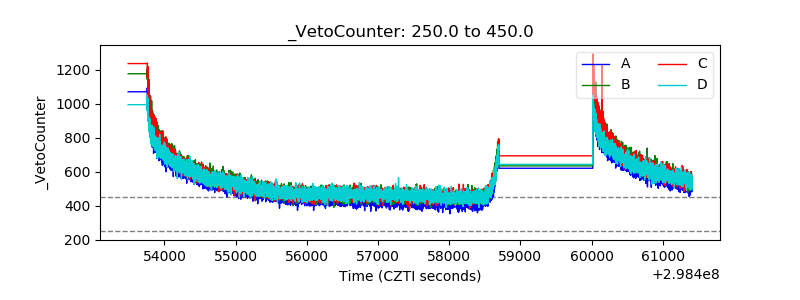 |