| Param | Original file | Final file |
|---|---|---|
| Filename | modeM0/AS1A05_180T01_9000002992_20107cztM0_level2.evt | modeM0/AS1A05_180T01_9000002992_20107cztM0_level2_quad_clean.evt |
| Size (bytes) | 650,600,640 | 83,088,000 |
| Size | 620.5 MB | 79.2 MB |
| Events in quadrant A | 4,973,565 | 532,681 |
| Events in quadrant B | 7,260,083 | 415,908 |
| Events in quadrant C | 3,445,041 | 556,876 |
| Events in quadrant D | 3,583,602 | 555,543 |
| Mode M9 | |||
|---|---|---|---|
| Quadrant | BADHDUFLAG | Total packets | Discarded packets |
| A | 0 | 21 | 0 |
| B | 0 | 22 | 0 |
| C | 0 | 22 | 0 |
| D | 0 | 22 | 0 |
| Mode M0 | |||
|---|---|---|---|
| Quadrant | BADHDUFLAG | Total packets | Discarded packets |
| A | 0 | 18730 | 2 |
| B | 0 | 26083 | 2 |
| C | 0 | 13865 | 2 |
| D | 0 | 14514 | 2 |
| Mode SS | |||
|---|---|---|---|
| Quadrant | BADHDUFLAG | Total packets | Discarded packets |
| A | 0 | 132 | 0 |
| B | 0 | 132 | 0 |
| C | 0 | 132 | 0 |
| D | 0 | 132 | 0 |
| Quadrant | Total seconds | Saturated seconds | Saturation percentage |
|---|---|---|---|
| A | 6513 | 722 | 11.085521% |
| B | 6513 | 1759 | 27.007523% |
| C | 6513 | 155 | 2.379856% |
| D | 6513 | 115 | 1.765699% |
Noise dominated data is calculated using 1-second bins in cleaned event files. If a bin has >2000 counts, and if more than 50% of those come from <1% of pixels, then it is considered to be noise-dominated and hence unusable.
| Quadrant | # 1 sec bins | Bins with >0 counts | Bins with >2000 counts | High rate bins dominated by noise | Noise dominated (total time) | Noise dominated (detector-on time) | Marked lightcurve |
|---|---|---|---|---|---|---|---|
| A | 7603 | 6514 | 378 | 378 | 4.97% | 5.80% | 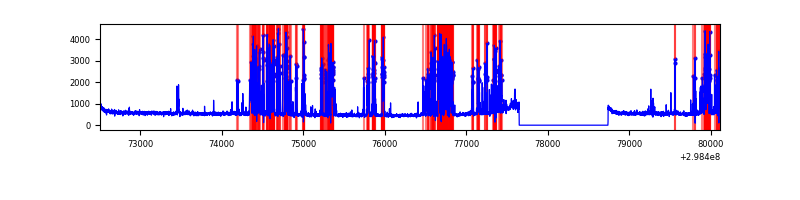 |
| B | 7603 | 6513 | 1156 | 1156 | 15.20% | 17.75% | 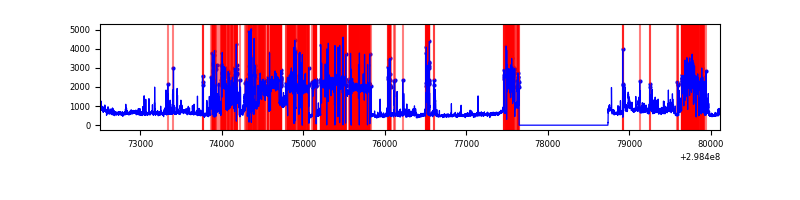 |
| C | 7603 | 6514 | 0 | 0 | 0.00% | 0.00% | 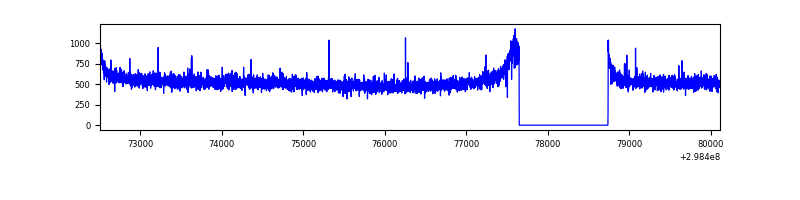 |
| D | 7603 | 6514 | 17 | 17 | 0.22% | 0.26% | 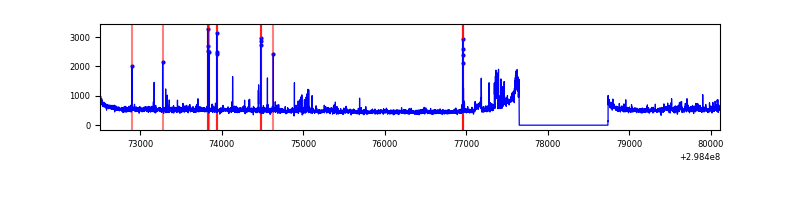 |
Top three noisy pixels from each quadrant. If the there are fewer than three noisy pixels in the level2.evt file, extra rows are filled as -1
| Pixel properties | Quadrant properties | ||||||
|---|---|---|---|---|---|---|---|
| Quadrant | DetID | PixID | Counts | Sigma | Mean | Median | Sigma |
| A | 14 | 238 | 1588353 | 9278.9 | 851 | 835 | 171.1 |
| A | 14 | 254 | 104436 | 605.54 | 851 | 835 | 171.1 |
| A | 0 | 226 | 7277 | 37.65 | 851 | 835 | 171.1 |
| B | 10 | 245 | 4198032 | 30350.69 | 726 | 711 | 138.3 |
| B | 3 | 64 | 109075 | 783.58 | 726 | 711 | 138.3 |
| B | 0 | 183 | 36521 | 258.94 | 726 | 711 | 138.3 |
| C | 14 | 238 | 135395 | 689.11 | 846 | 856 | 195.2 |
| C | 3 | 233 | 11466 | 54.34 | 846 | 856 | 195.2 |
| C | 13 | 61 | 5711 | 24.87 | 846 | 856 | 195.2 |
| D | 11 | 176 | 147576 | 696.16 | 866 | 843 | 210.8 |
| D | 7 | 238 | 104734 | 492.9 | 866 | 843 | 210.8 |
| D | 1 | 52 | 36905 | 171.09 | 866 | 843 | 210.8 |
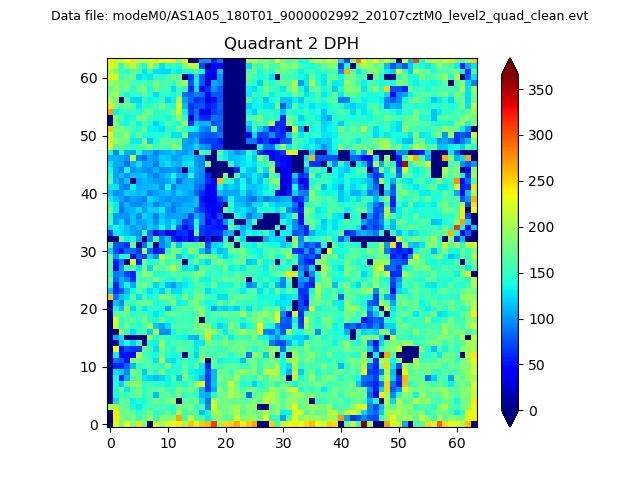
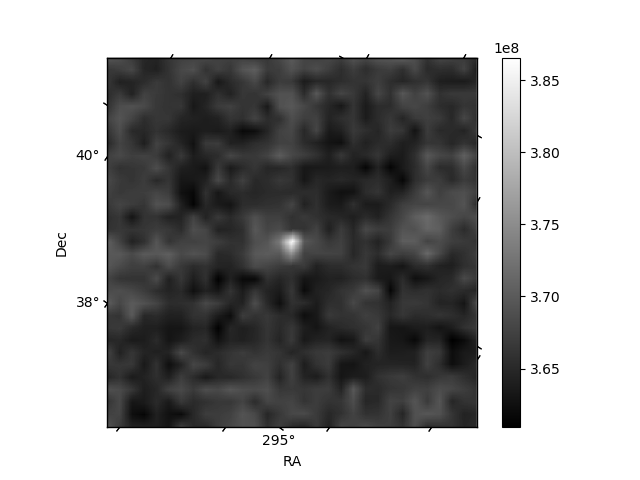
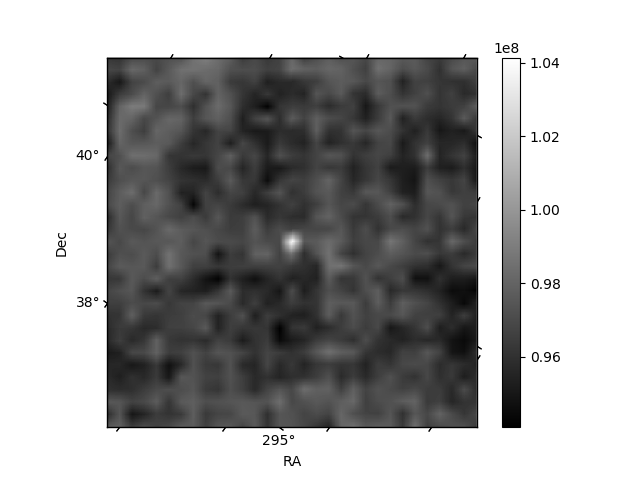
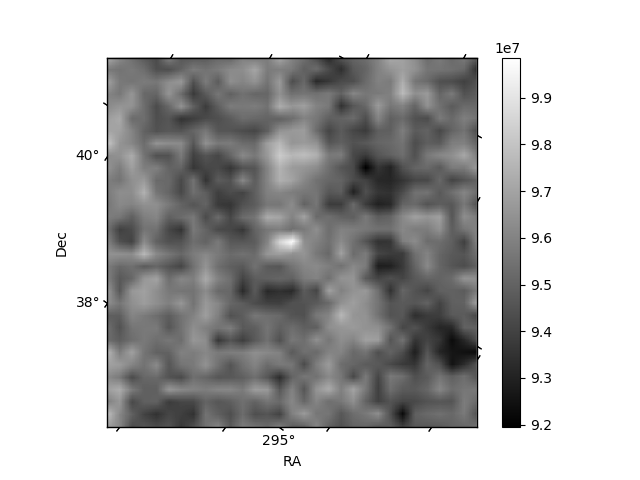
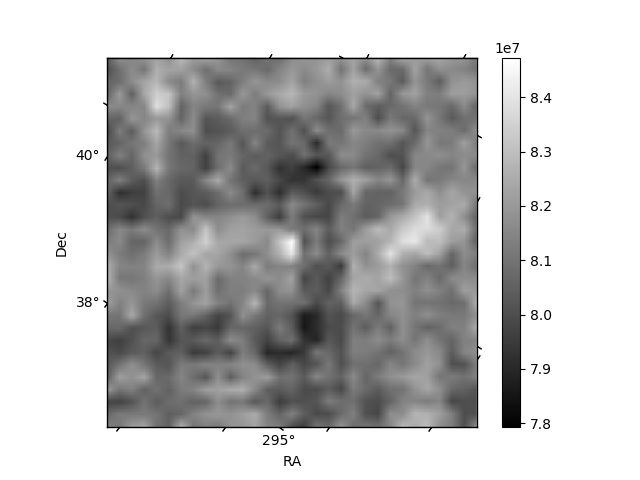
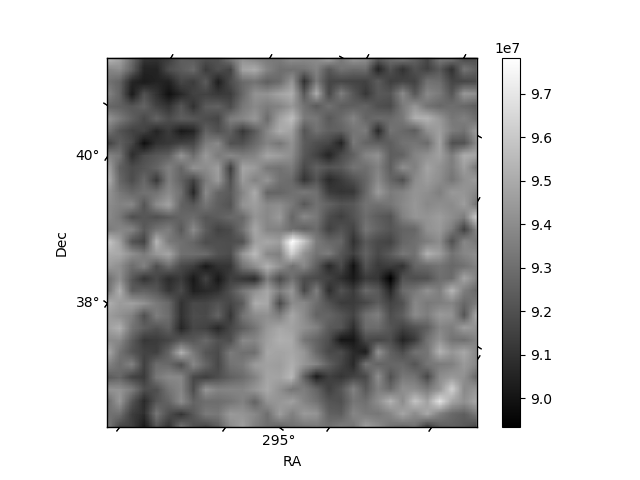
Histogram calculated using DETX and DETY for each event in the final _common_clean file
| Quadrant A | 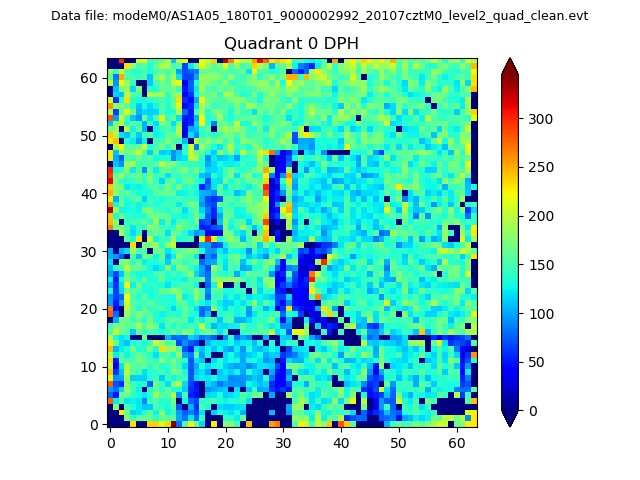 |
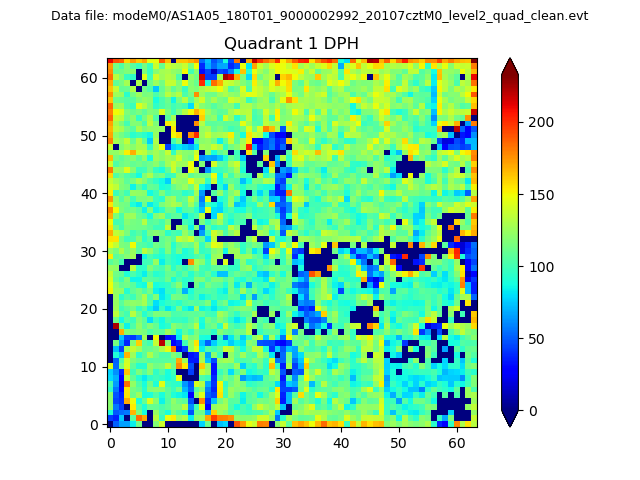 |
Quadrant B |
|---|---|---|---|
| Quadrant D | 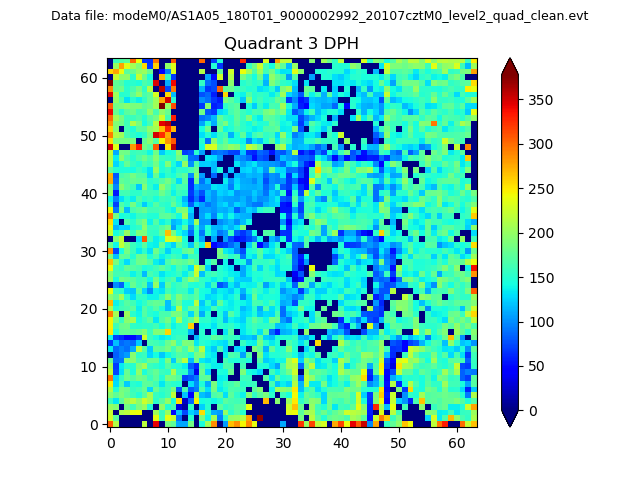 |
 |
Quadrant C |
| Plot type | Count rate plots | Images |
|---|---|---|
| Comparison with Poisson distribution Blue bars denote a histogram of data divided into 1 sec bins. Red curve is a Poisson curve with rate = median count rate of data. |
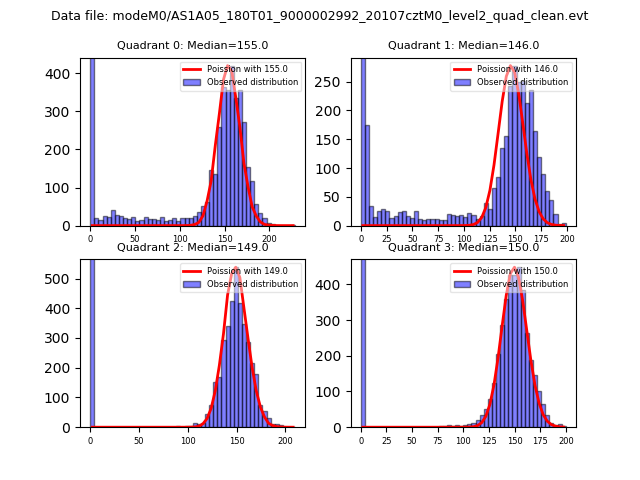 |
 |
| Quadrant-wise count rates Data is divided into 100 sec bins |
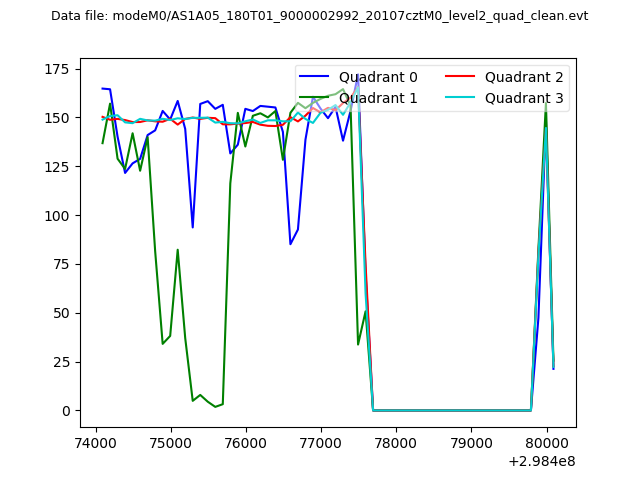 |
|
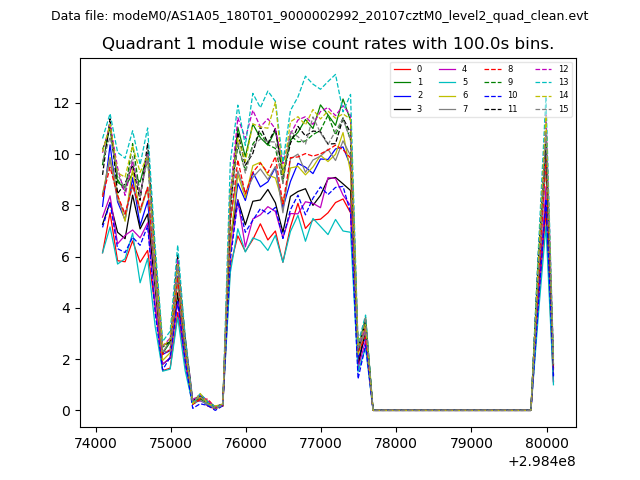
| Module-wise count rates for Quadrant A Data is divided into 100 sec bins |
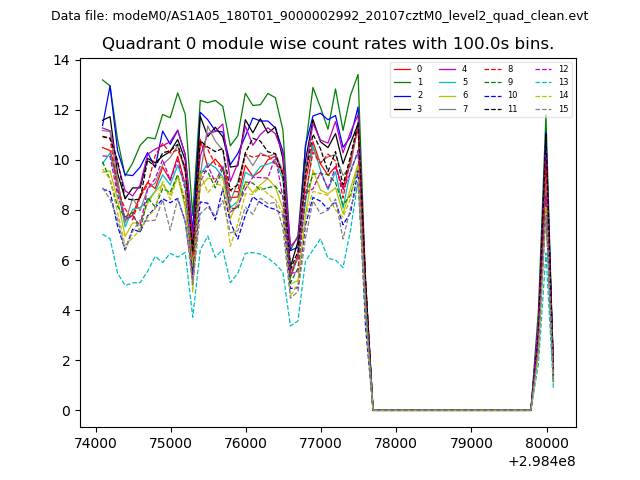 |
 |
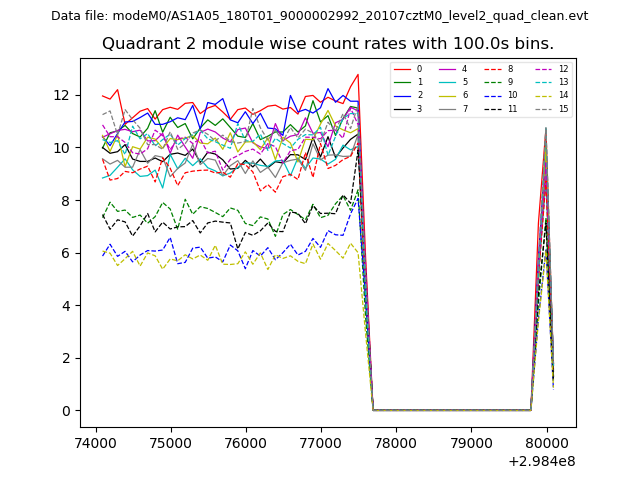
| Module-wise count rates for Quadrant B Data is divided into 100 sec bins |
 |
 |
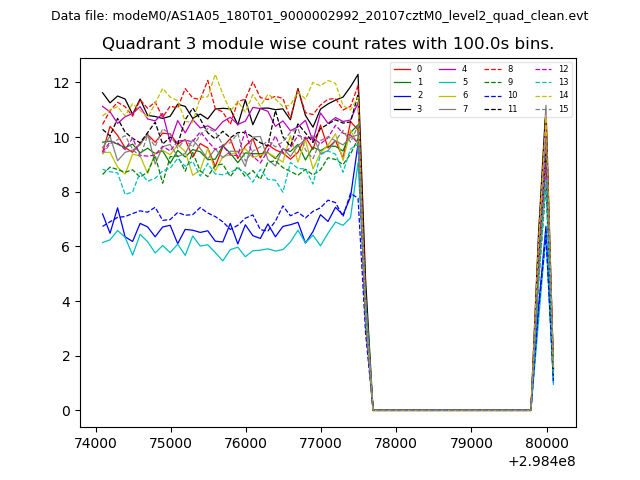
| Module-wise count rates for Quadrant C Data is divided into 100 sec bins |
 |
 |
| Module-wise count rates for Quadrant D Data is divided into 100 sec bins |
 |
 |
| Parameter | Plot |
|---|---|
| CZT HV Monitor | 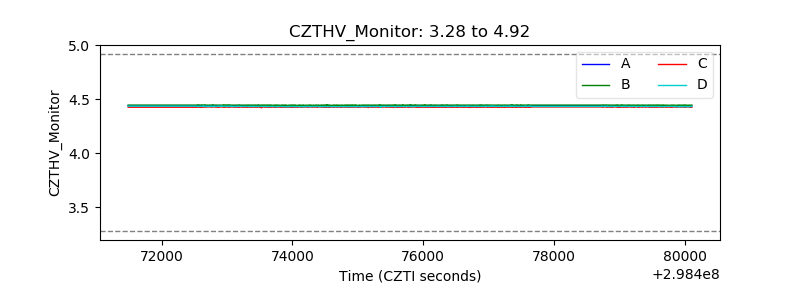 |
| D_VDD | 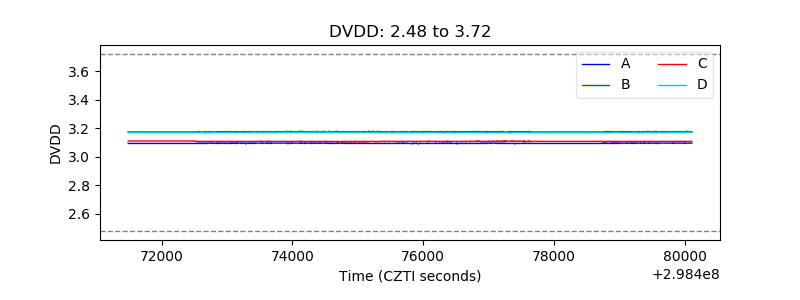 |
| Temperature 1 | 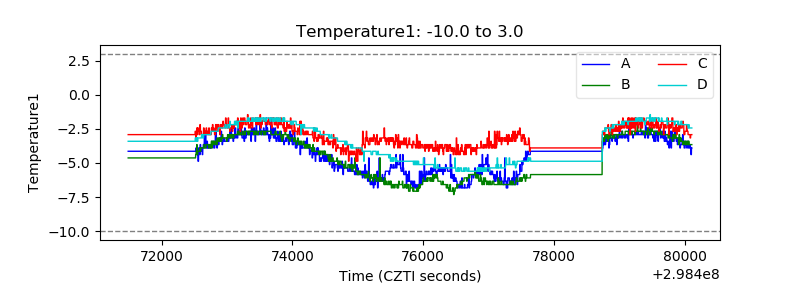 |
| Veto HV Monitor | 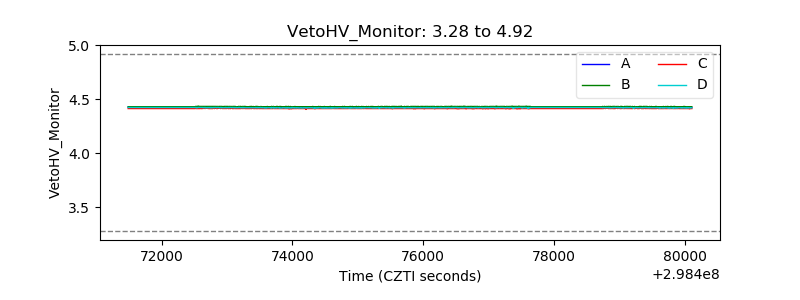 |
| Veto LLD | 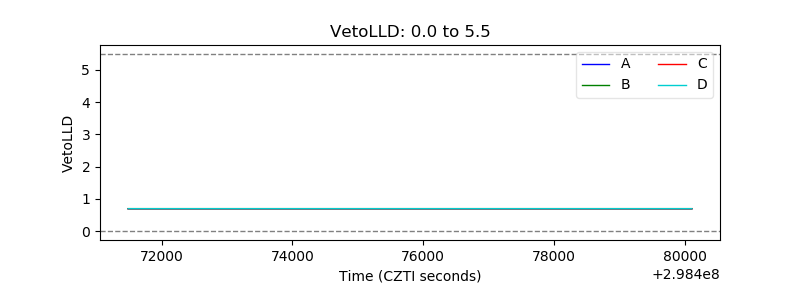 |
| Alpha Counter | 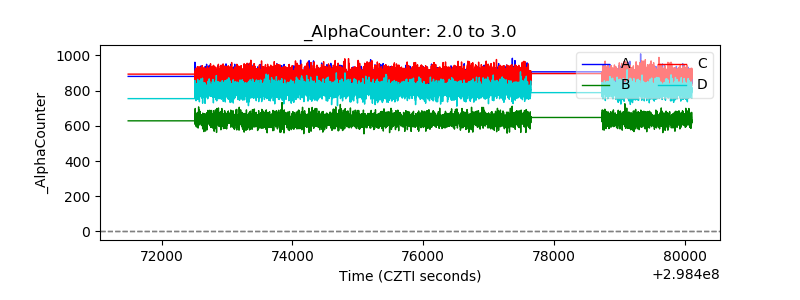 |
| _CPM_Rate | 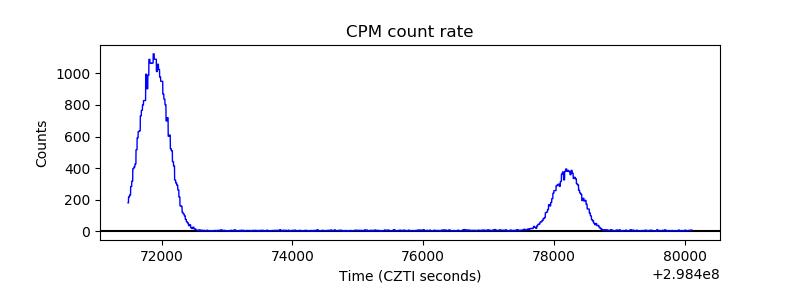 |
| CZT Counter |  |
| +2.5 Volts monitor |  |
| +5 Volts monitor |  |
| _ROLL_ROT | 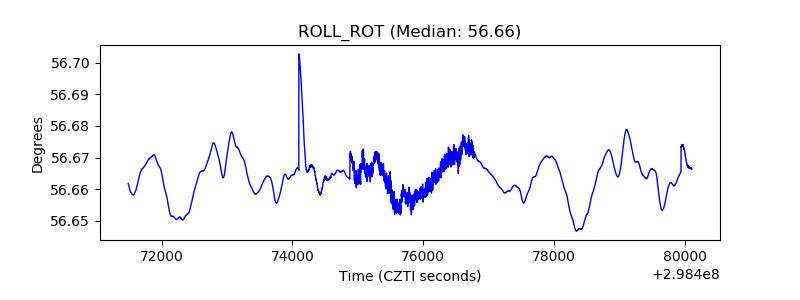 |
| _Roll_DEC | 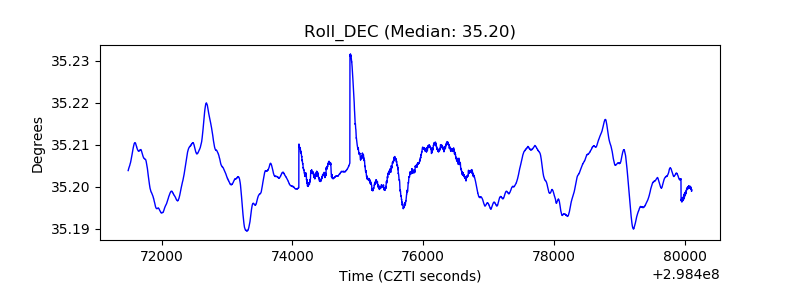 |
| _Roll_RA | 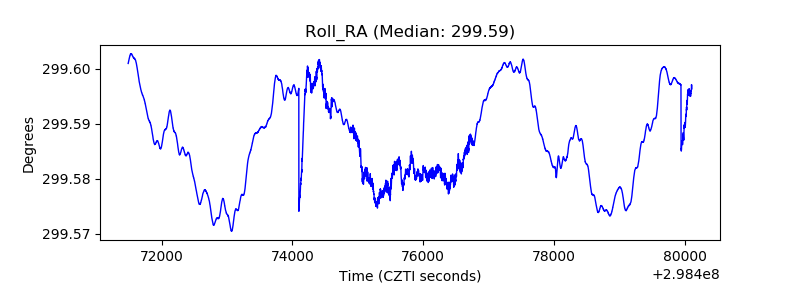 |
| Veto Counter | 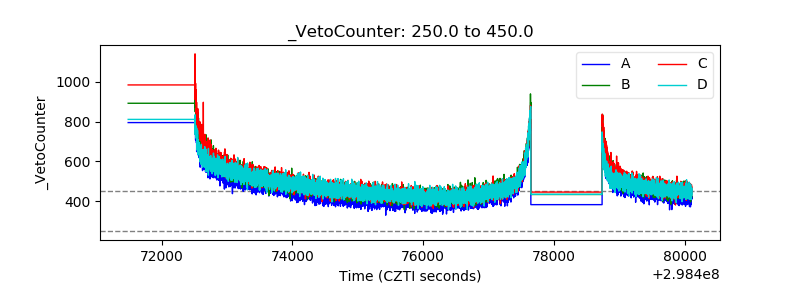 |