| Param | Original file | Final file |
|---|---|---|
| Filename | modeM0/AS1A05_180T01_9000002992_20109cztM0_level2.evt | modeM0/AS1A05_180T01_9000002992_20109cztM0_level2_quad_clean.evt |
| Size (bytes) | 961,640,640 | 97,107,840 |
| Size | 917.1 MB | 92.6 MB |
| Events in quadrant A | 9,354,822 | 477,240 |
| Events in quadrant B | 10,244,303 | 589,127 |
| Events in quadrant C | 3,966,348 | 666,822 |
| Events in quadrant D | 5,024,772 | 657,110 |
| Mode M9 | |||
|---|---|---|---|
| Quadrant | BADHDUFLAG | Total packets | Discarded packets |
| A | 0 | 10 | 0 |
| B | 0 | 10 | 0 |
| C | 0 | 10 | 0 |
| D | 0 | 10 | 0 |
| Mode M0 | |||
|---|---|---|---|
| Quadrant | BADHDUFLAG | Total packets | Discarded packets |
| A | 0 | 33028 | 2 |
| B | 0 | 35833 | 2 |
| C | 0 | 16500 | 2 |
| D | 0 | 20190 | 2 |
| Mode SS | |||
|---|---|---|---|
| Quadrant | BADHDUFLAG | Total packets | Discarded packets |
| A | 0 | 162 | 0 |
| B | 0 | 162 | 0 |
| C | 0 | 162 | 0 |
| D | 0 | 162 | 0 |
| Quadrant | Total seconds | Saturated seconds | Saturation percentage |
|---|---|---|---|
| A | 7894 | 2753 | 34.874588% |
| B | 7894 | 2789 | 35.330631% |
| C | 7894 | 185 | 2.343552% |
| D | 7894 | 300 | 3.800355% |
Noise dominated data is calculated using 1-second bins in cleaned event files. If a bin has >2000 counts, and if more than 50% of those come from <1% of pixels, then it is considered to be noise-dominated and hence unusable.
| Quadrant | # 1 sec bins | Bins with >0 counts | Bins with >2000 counts | High rate bins dominated by noise | Noise dominated (total time) | Noise dominated (detector-on time) | Marked lightcurve |
|---|---|---|---|---|---|---|---|
| A | 8964 | 7895 | 1558 | 1558 | 17.38% | 19.73% |  |
| B | 8964 | 7896 | 2138 | 2138 | 23.85% | 27.08% | 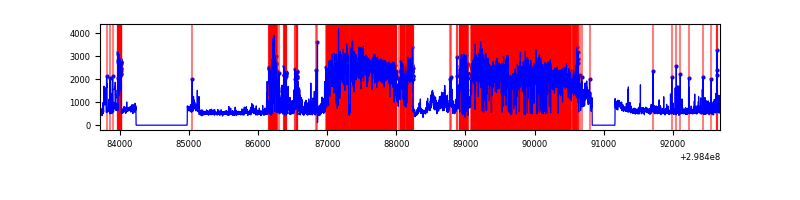 |
| C | 8964 | 7896 | 0 | 0 | 0.00% | 0.00% | 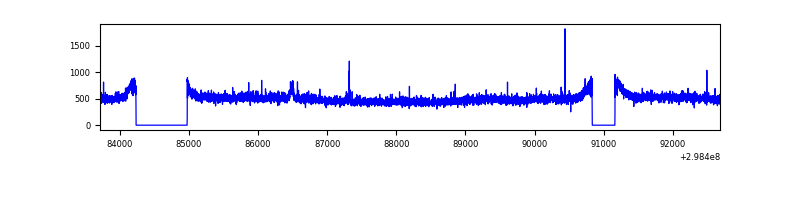 |
| D | 8964 | 7896 | 134 | 134 | 1.49% | 1.70% | 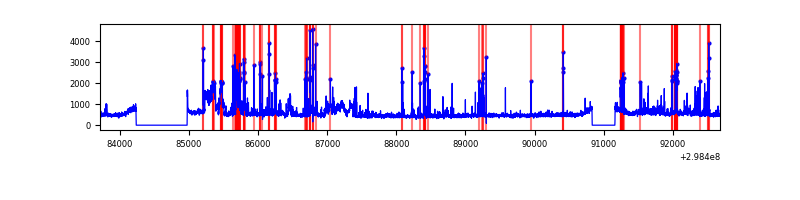 |
Top three noisy pixels from each quadrant. If the there are fewer than three noisy pixels in the level2.evt file, extra rows are filled as -1
| Pixel properties | Quadrant properties | ||||||
|---|---|---|---|---|---|---|---|
| Quadrant | DetID | PixID | Counts | Sigma | Mean | Median | Sigma |
| A | 14 | 238 | 5719336 | 35494.09 | 802 | 788 | 161.1 |
| A | 14 | 254 | 403755 | 2501.15 | 802 | 788 | 161.1 |
| A | 14 | 237 | 137953 | 851.36 | 802 | 788 | 161.1 |
| B | 10 | 245 | 6609692 | 38235.78 | 898 | 875 | 172.8 |
| B | 4 | 80 | 44097 | 250.06 | 898 | 875 | 172.8 |
| B | 0 | 183 | 33713 | 189.99 | 898 | 875 | 172.8 |
| C | 14 | 238 | 152167 | 669.74 | 968 | 976 | 225.7 |
| C | 3 | 233 | 30793 | 132.08 | 968 | 976 | 225.7 |
| C | 0 | 207 | 10820 | 43.61 | 968 | 976 | 225.7 |
| D | 1 | 52 | 778697 | 3289.33 | 978 | 952 | 236.4 |
| D | 7 | 238 | 373436 | 1575.35 | 978 | 952 | 236.4 |
| D | 7 | 38 | 52060 | 216.15 | 978 | 952 | 236.4 |
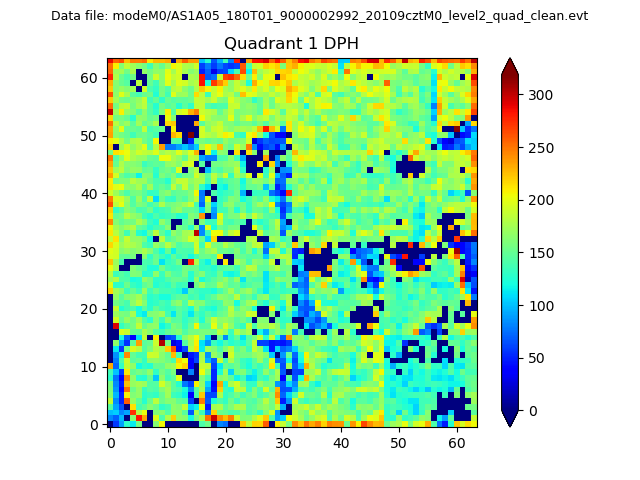
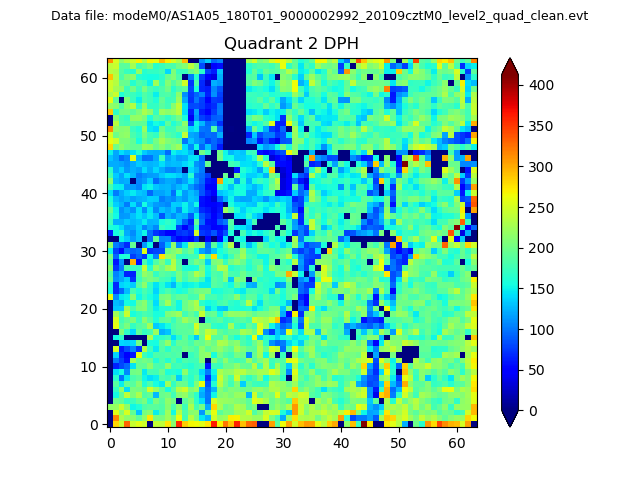
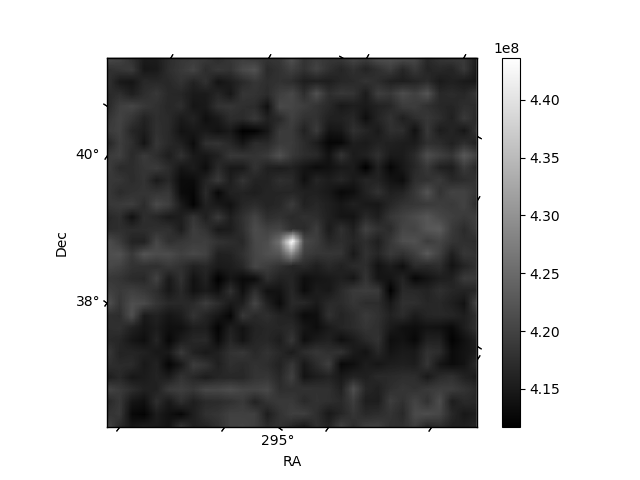
Histogram calculated using DETX and DETY for each event in the final _common_clean file
| Quadrant A | 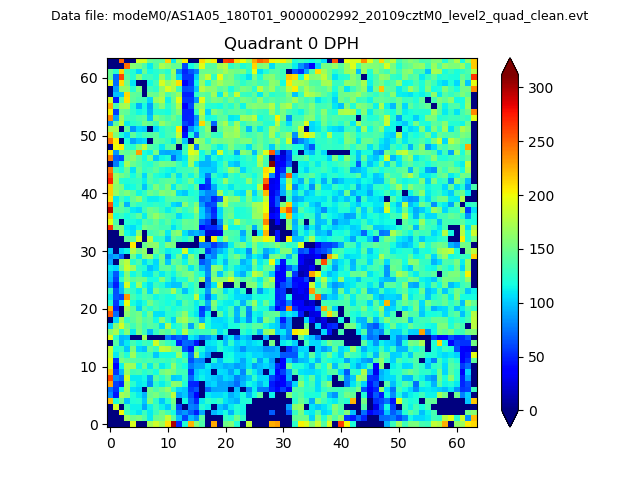 |
 |
Quadrant B |
|---|---|---|---|
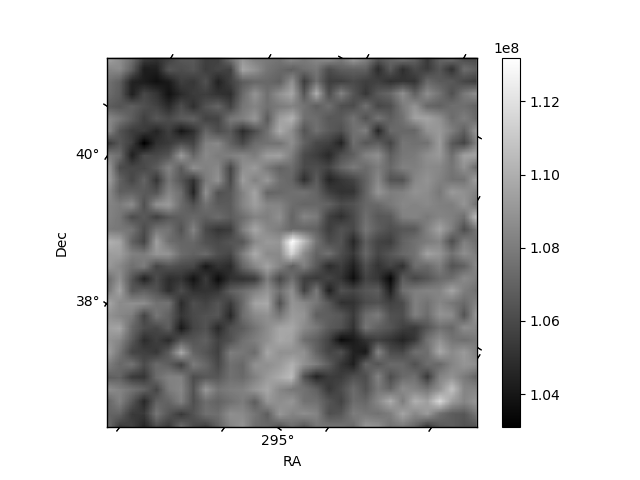
| Quadrant D | 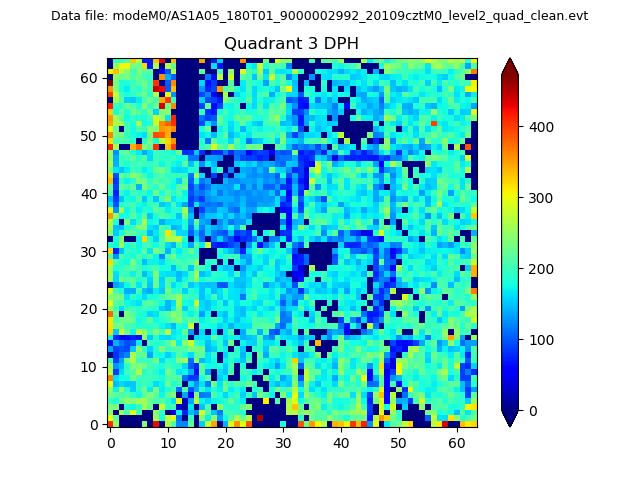 |
 |
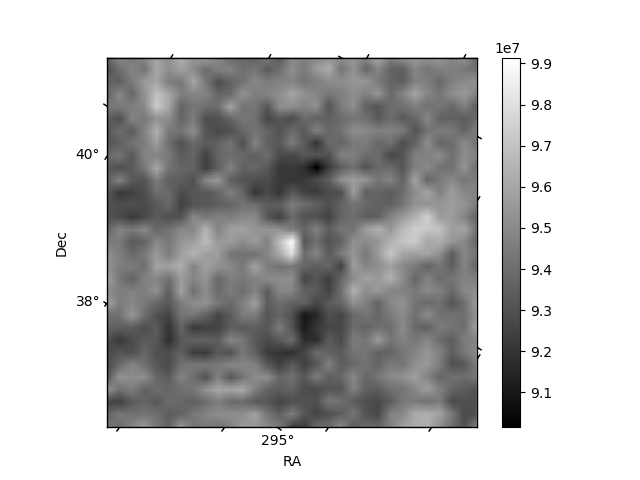
Quadrant C |
| Plot type | Count rate plots | Images |
|---|---|---|
| Comparison with Poisson distribution Blue bars denote a histogram of data divided into 1 sec bins. Red curve is a Poisson curve with rate = median count rate of data. |
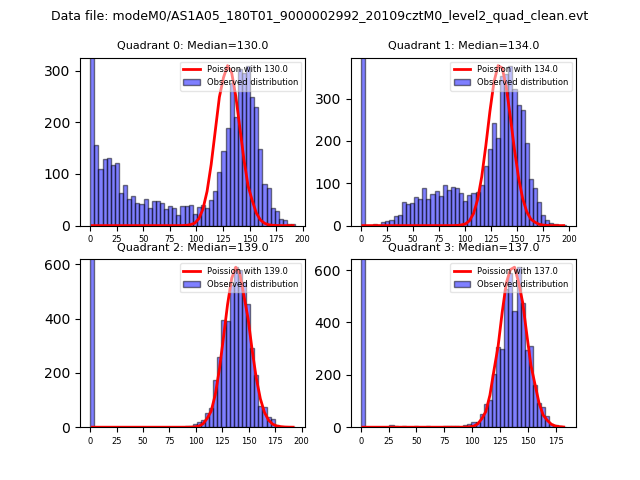 |
 |
| Quadrant-wise count rates Data is divided into 100 sec bins |
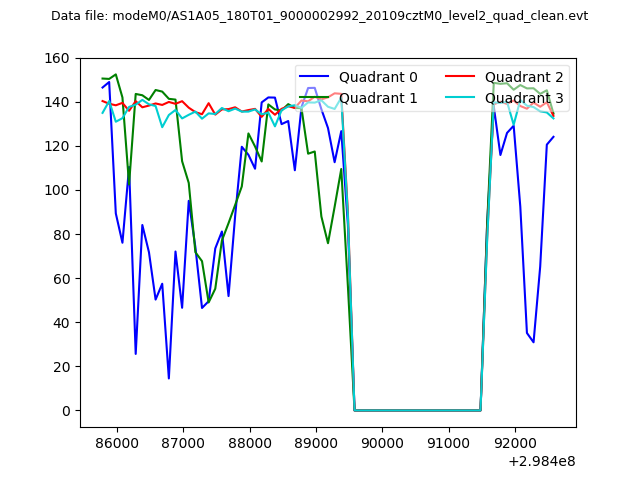 |
|
| Module-wise count rates for Quadrant A Data is divided into 100 sec bins |
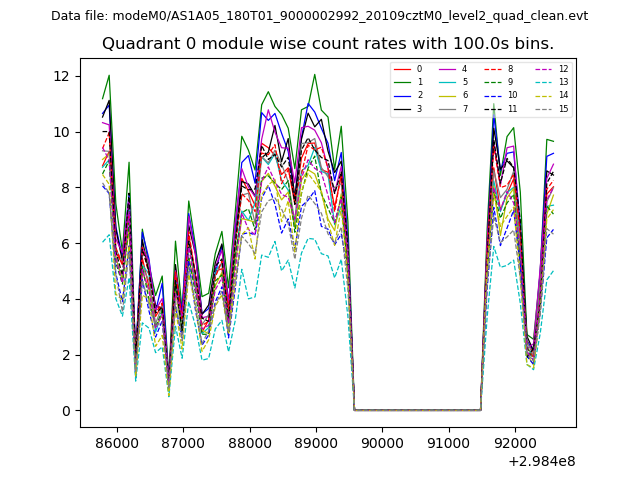 |
 |
| Module-wise count rates for Quadrant B Data is divided into 100 sec bins |
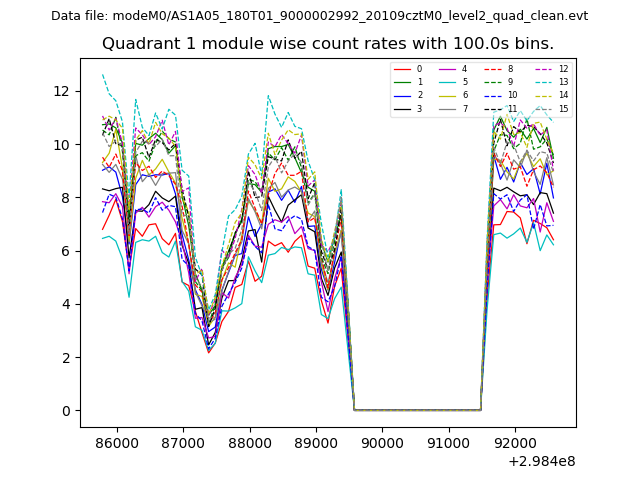 |
 |
| Module-wise count rates for Quadrant C Data is divided into 100 sec bins |
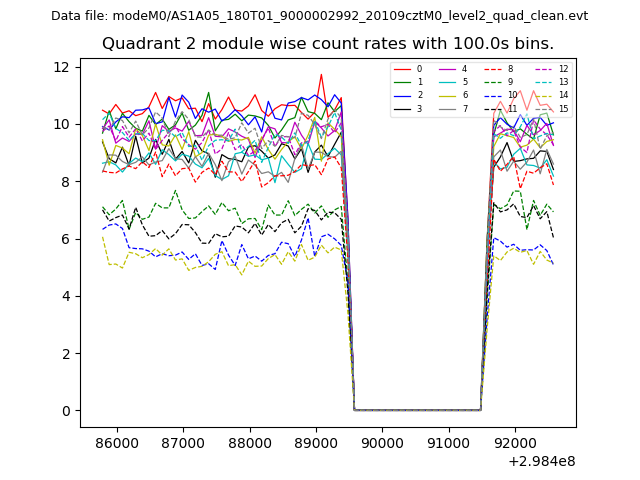 |
 |
| Module-wise count rates for Quadrant D Data is divided into 100 sec bins |
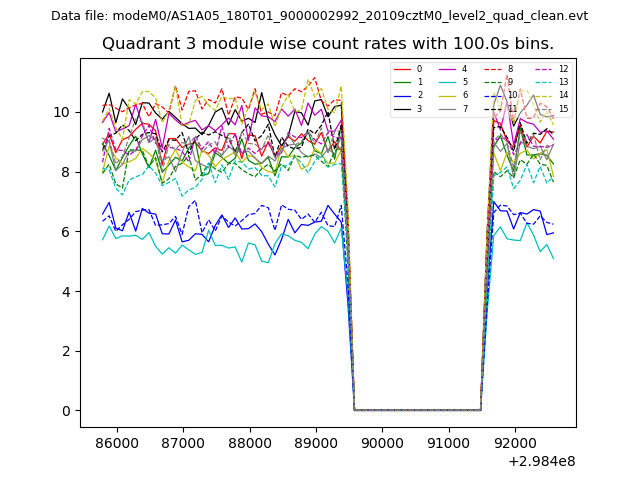 |
 |
| Parameter | Plot |
|---|---|
| CZT HV Monitor |  |
| D_VDD |  |
| Temperature 1 | 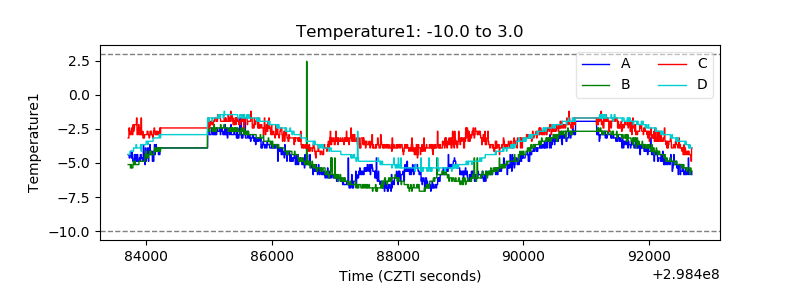 |
| Veto HV Monitor | 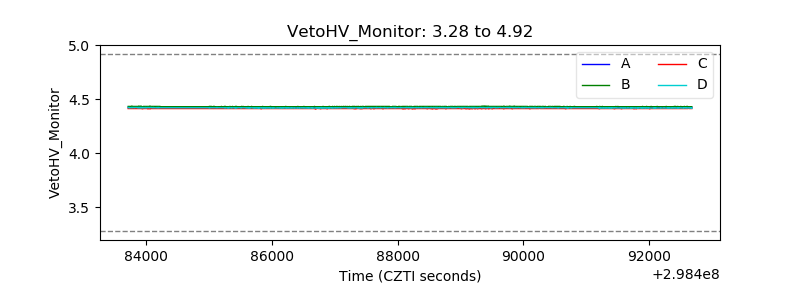 |
| Veto LLD | 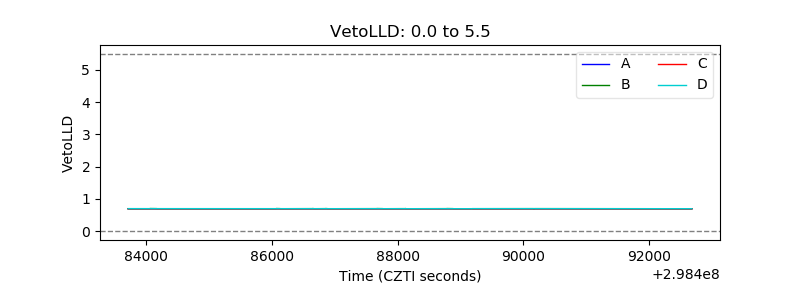 |
| Alpha Counter | 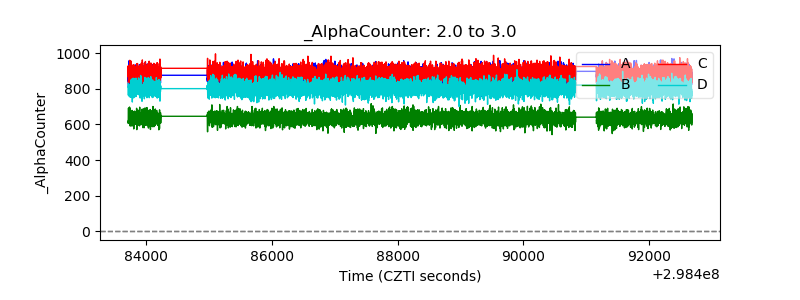 |
| _CPM_Rate | 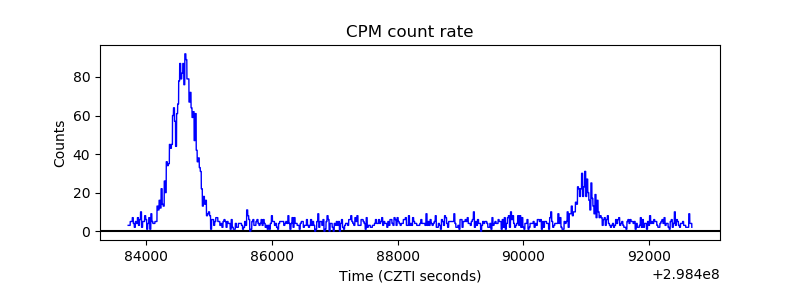 |
| CZT Counter | 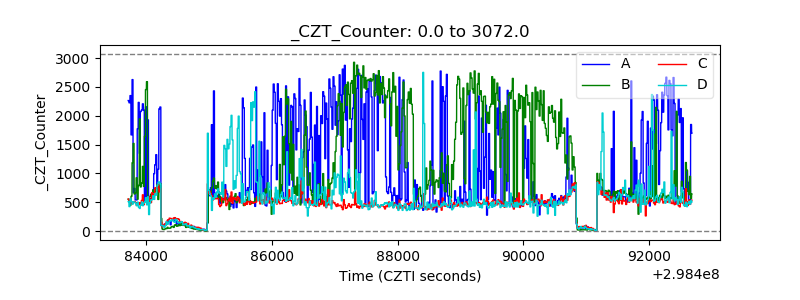 |
| +2.5 Volts monitor |  |
| +5 Volts monitor |  |
| _ROLL_ROT | 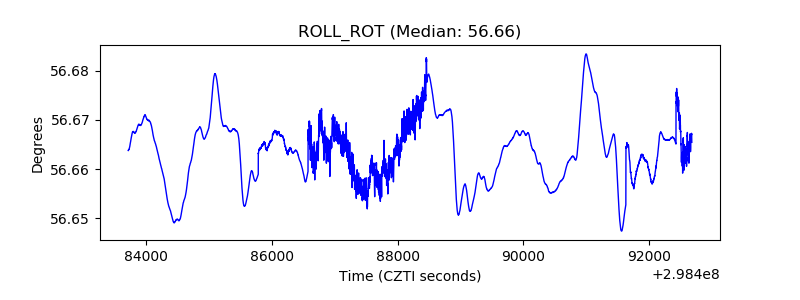 |
| _Roll_DEC | 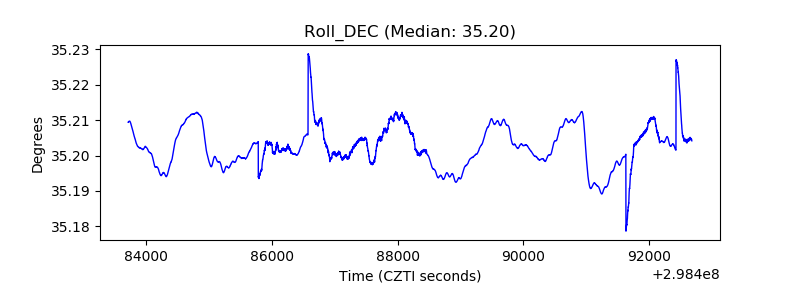 |
| _Roll_RA | 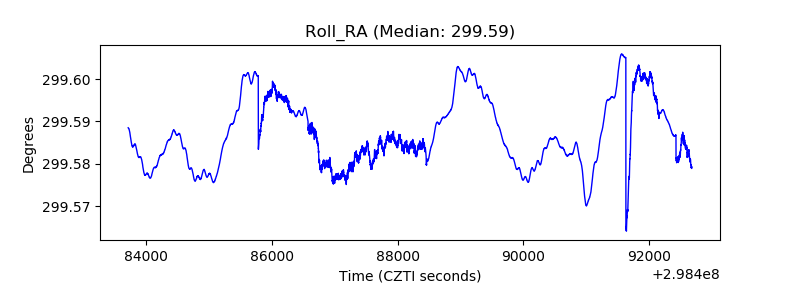 |
| Veto Counter | 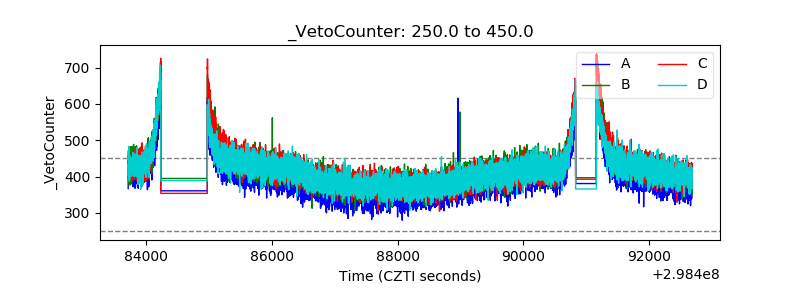 |