| Param | Original file | Final file |
|---|---|---|
| Filename | modeM0/AS1A05_180T01_9000002992_20110cztM0_level2.evt | modeM0/AS1A05_180T01_9000002992_20110cztM0_level2_quad_clean.evt |
| Size (bytes) | 774,927,360 | 109,428,480 |
| Size | 739.0 MB | 104.4 MB |
| Events in quadrant A | 7,867,038 | 630,976 |
| Events in quadrant B | 6,611,863 | 714,792 |
| Events in quadrant C | 3,664,112 | 734,521 |
| Events in quadrant D | 4,823,379 | 715,936 |
| Mode M9 | |||
|---|---|---|---|
| Quadrant | BADHDUFLAG | Total packets | Discarded packets |
| A | 0 | 2 | 0 |
| B | 0 | 2 | 0 |
| C | 0 | 2 | 0 |
| D | 0 | 2 | 0 |
| Mode M0 | |||
|---|---|---|---|
| Quadrant | BADHDUFLAG | Total packets | Discarded packets |
| A | 0 | 28304 | 1 |
| B | 0 | 24603 | 1 |
| C | 0 | 15423 | 1 |
| D | 0 | 19380 | 1 |
| Mode SS | |||
|---|---|---|---|
| Quadrant | BADHDUFLAG | Total packets | Discarded packets |
| A | 0 | 150 | 0 |
| B | 0 | 150 | 0 |
| C | 0 | 150 | 0 |
| D | 0 | 150 | 0 |
| Quadrant | Total seconds | Saturated seconds | Saturation percentage |
|---|---|---|---|
| A | 7429 | 1846 | 24.848566% |
| B | 7430 | 1000 | 13.458950% |
| C | 7430 | 167 | 2.247645% |
| D | 7430 | 400 | 5.383580% |
Noise dominated data is calculated using 1-second bins in cleaned event files. If a bin has >2000 counts, and if more than 50% of those come from <1% of pixels, then it is considered to be noise-dominated and hence unusable.
| Quadrant | # 1 sec bins | Bins with >0 counts | Bins with >2000 counts | High rate bins dominated by noise | Noise dominated (total time) | Noise dominated (detector-on time) | Marked lightcurve |
|---|---|---|---|---|---|---|---|
| A | 7604 | 7431 | 1178 | 1178 | 15.49% | 15.85% | 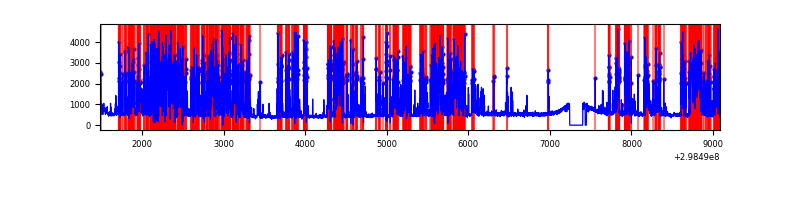 |
| B | 7605 | 7432 | 654 | 654 | 8.60% | 8.80% | 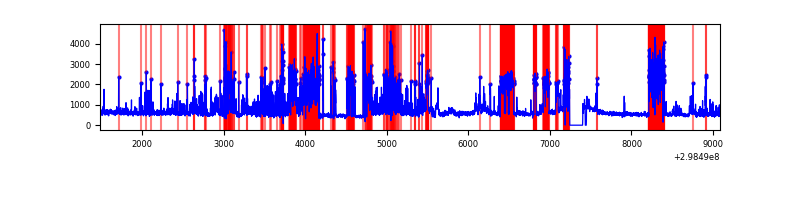 |
| C | 7605 | 7432 | 0 | 0 | 0.00% | 0.00% | 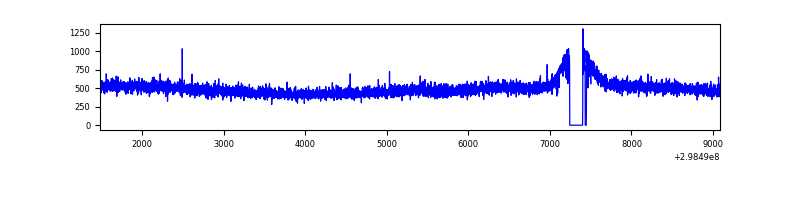 |
| D | 7605 | 7432 | 219 | 219 | 2.88% | 2.95% | 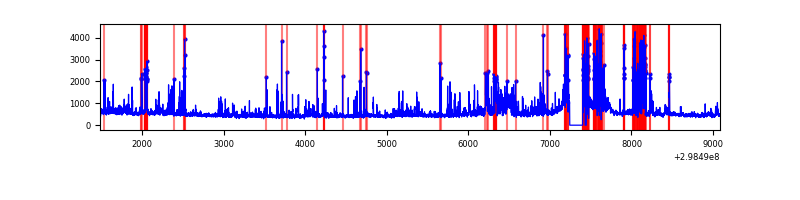 |
Top three noisy pixels from each quadrant. If the there are fewer than three noisy pixels in the level2.evt file, extra rows are filled as -1
| Pixel properties | Quadrant properties | ||||||
|---|---|---|---|---|---|---|---|
| Quadrant | DetID | PixID | Counts | Sigma | Mean | Median | Sigma |
| A | 14 | 238 | 4087262 | 24351.21 | 820 | 803 | 167.8 |
| A | 14 | 254 | 582836 | 3468.33 | 820 | 803 | 167.8 |
| A | 14 | 237 | 35829 | 208.72 | 820 | 803 | 167.8 |
| B | 10 | 245 | 3064010 | 18357.52 | 875 | 855 | 166.9 |
| B | 4 | 80 | 48258 | 284.09 | 875 | 855 | 166.9 |
| B | 0 | 183 | 22818 | 131.62 | 875 | 855 | 166.9 |
| C | 14 | 238 | 140317 | 661.28 | 899 | 907 | 210.8 |
| C | 0 | 207 | 10358 | 44.83 | 899 | 907 | 210.8 |
| C | 13 | 61 | 6225 | 25.23 | 899 | 907 | 210.8 |
| D | 1 | 52 | 1247248 | 5759.02 | 888 | 864 | 216.4 |
| D | 7 | 238 | 92283 | 422.41 | 888 | 864 | 216.4 |
| D | 12 | 218 | 49757 | 225.91 | 888 | 864 | 216.4 |
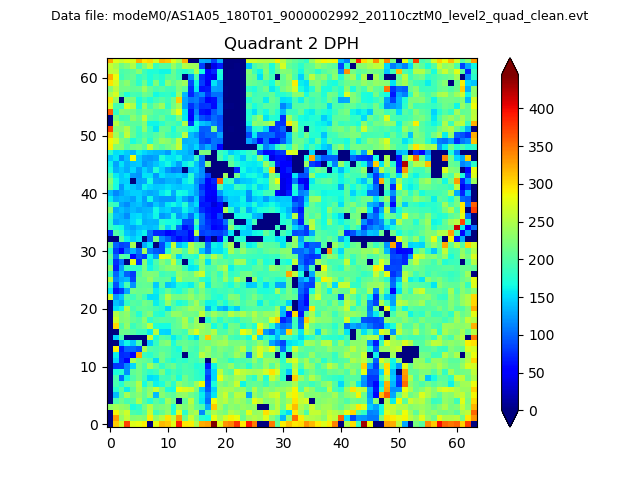
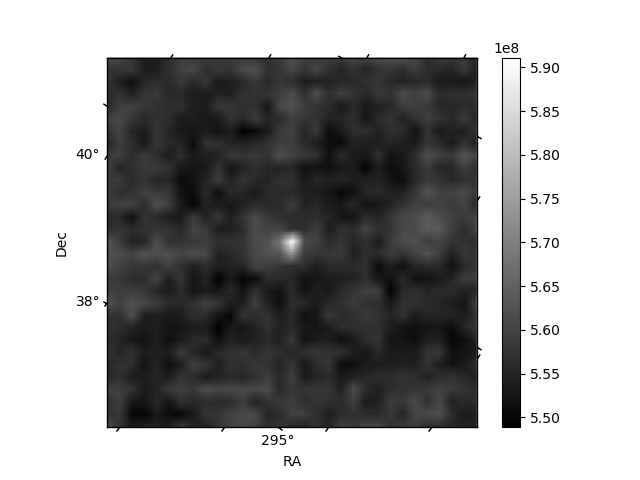
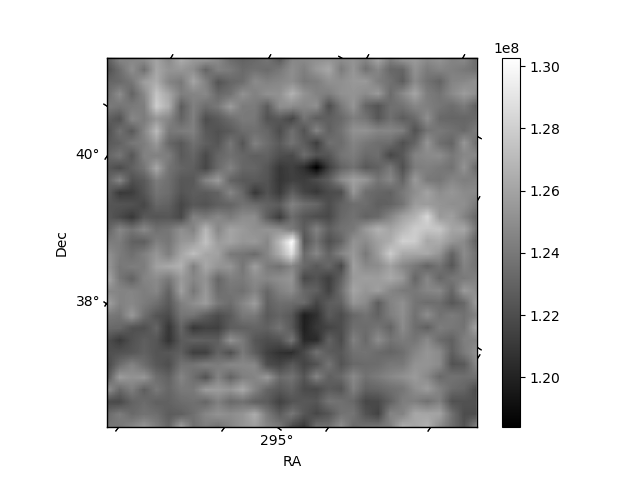
Histogram calculated using DETX and DETY for each event in the final _common_clean file
| Quadrant A | 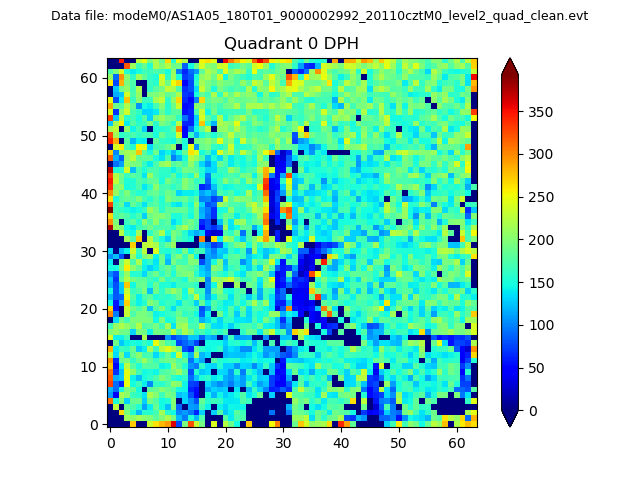 |
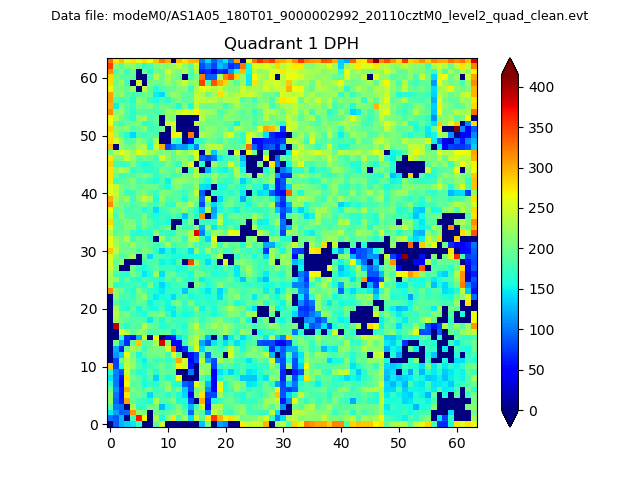 |
Quadrant B |
|---|---|---|---|
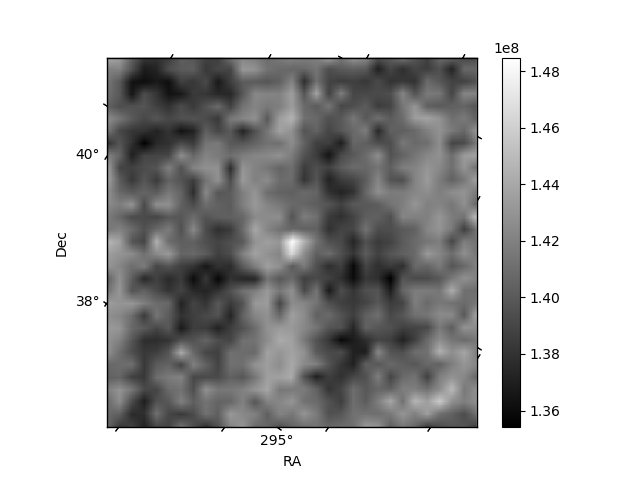
| Quadrant D | 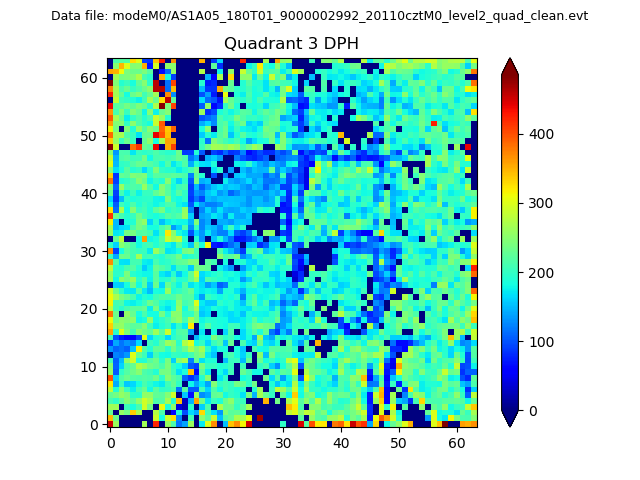 |
 |
Quadrant C |
| Plot type | Count rate plots | Images |
|---|---|---|
| Comparison with Poisson distribution Blue bars denote a histogram of data divided into 1 sec bins. Red curve is a Poisson curve with rate = median count rate of data. |
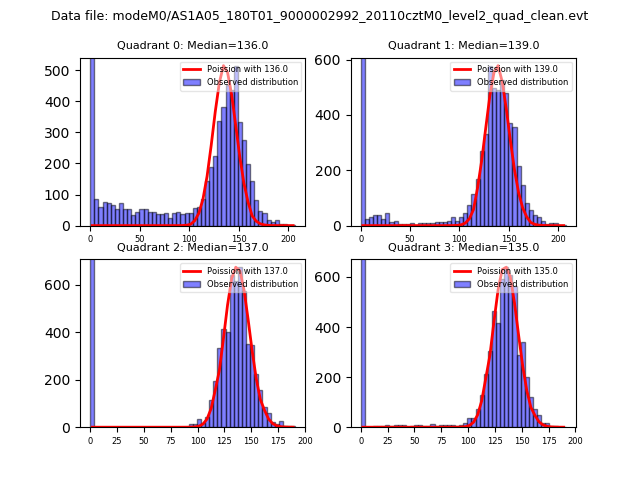 |
 |
| Quadrant-wise count rates Data is divided into 100 sec bins |
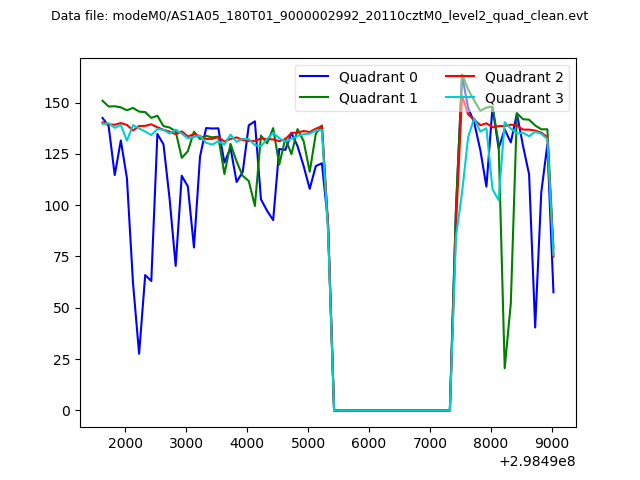 |
|
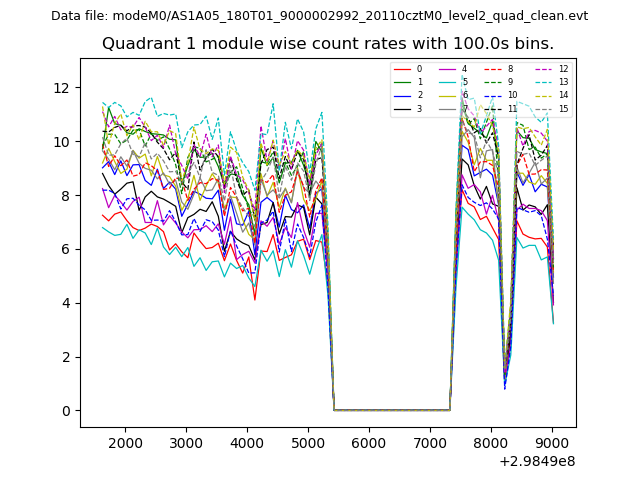
| Module-wise count rates for Quadrant A Data is divided into 100 sec bins |
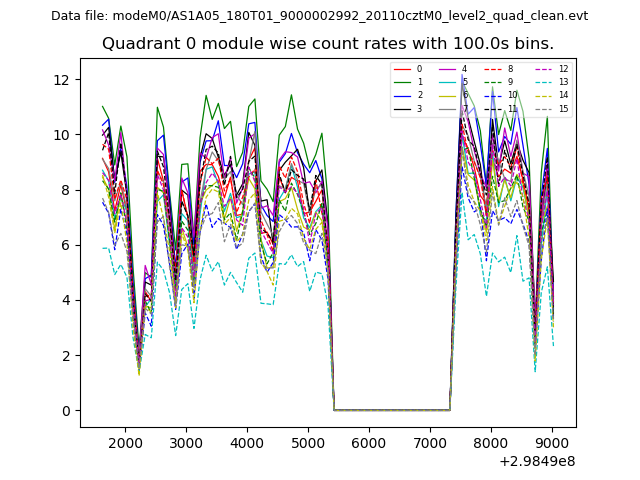 |
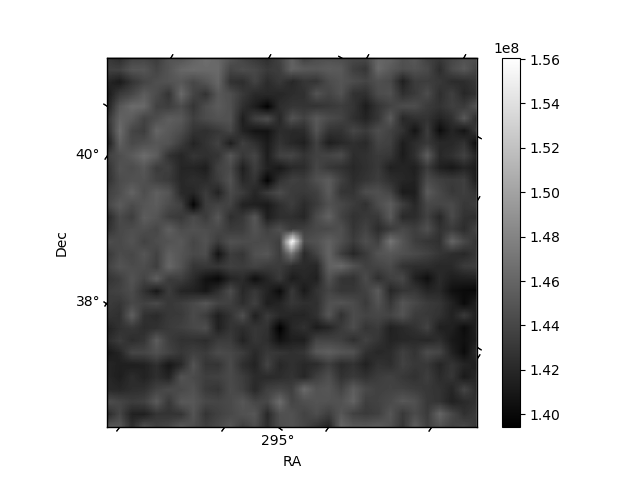 |
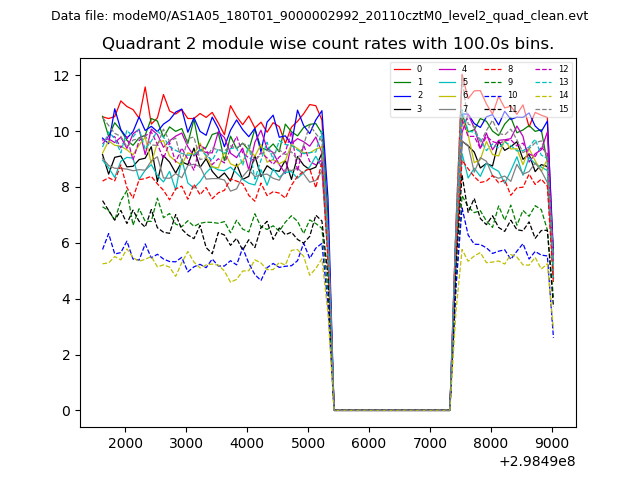
| Module-wise count rates for Quadrant B Data is divided into 100 sec bins |
 |
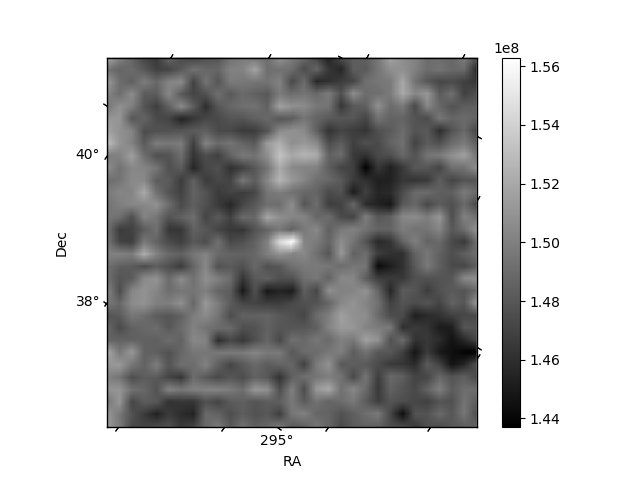 |
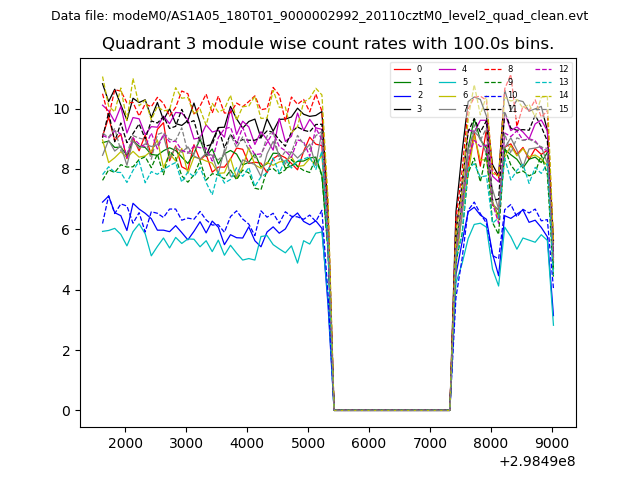
| Module-wise count rates for Quadrant C Data is divided into 100 sec bins |
 |
 |
| Module-wise count rates for Quadrant D Data is divided into 100 sec bins |
 |
 |
| Parameter | Plot |
|---|---|
| CZT HV Monitor | 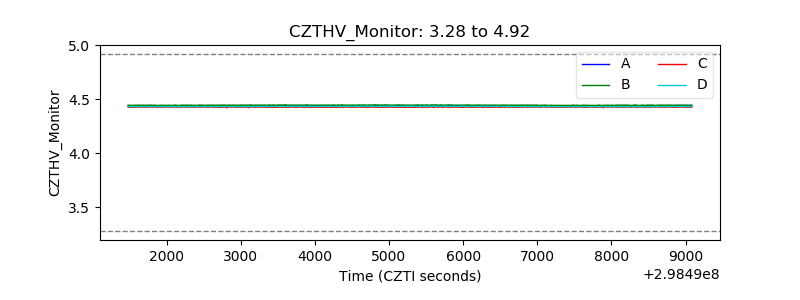 |
| D_VDD | 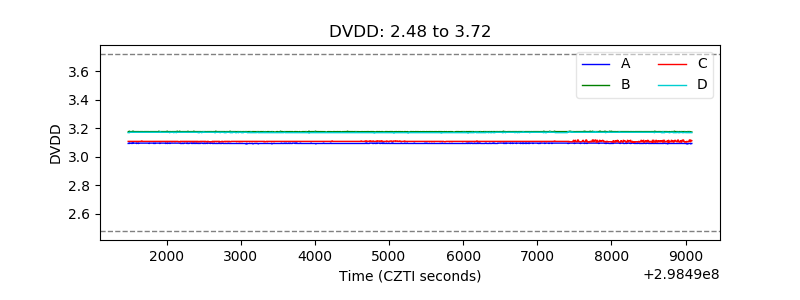 |
| Temperature 1 | 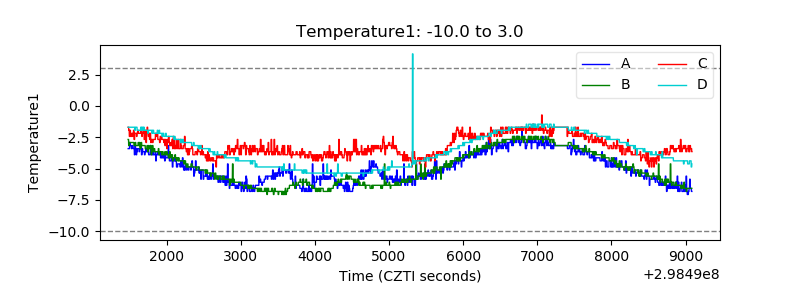 |
| Veto HV Monitor | 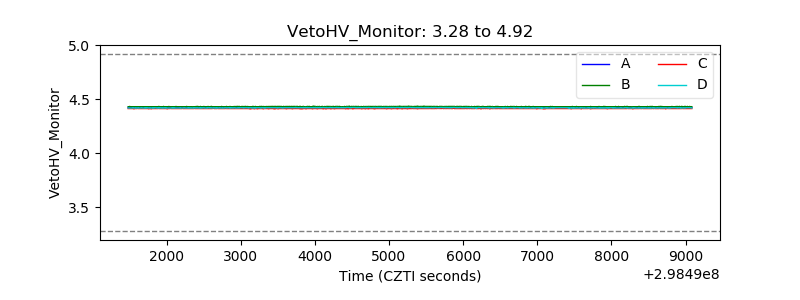 |
| Veto LLD | 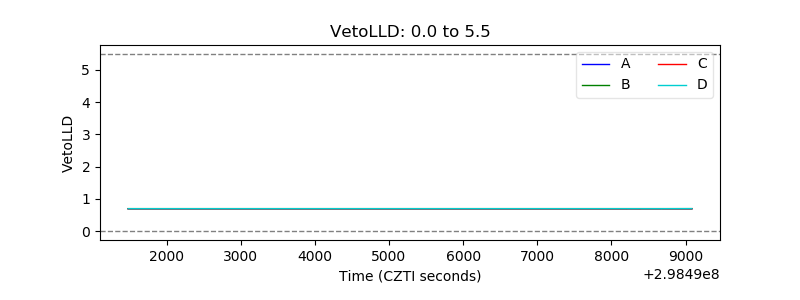 |
| Alpha Counter |  |
| _CPM_Rate | 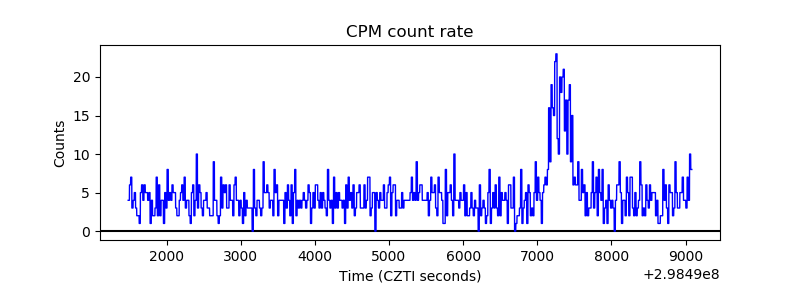 |
| CZT Counter | 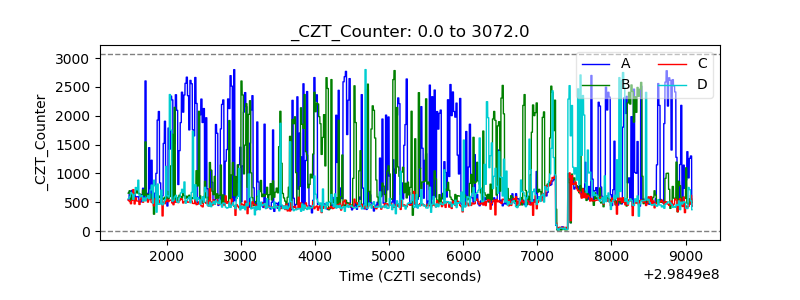 |
| +2.5 Volts monitor |  |
| +5 Volts monitor |  |
| _ROLL_ROT | 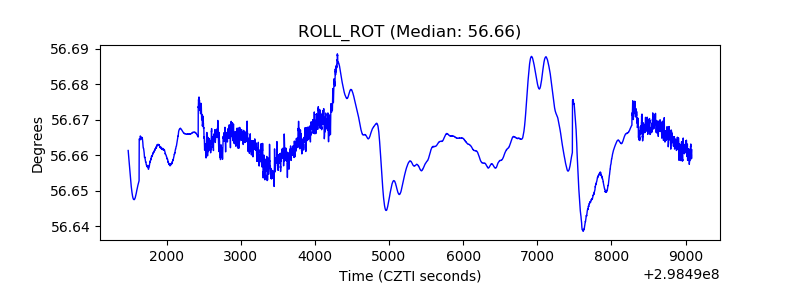 |
| _Roll_DEC | 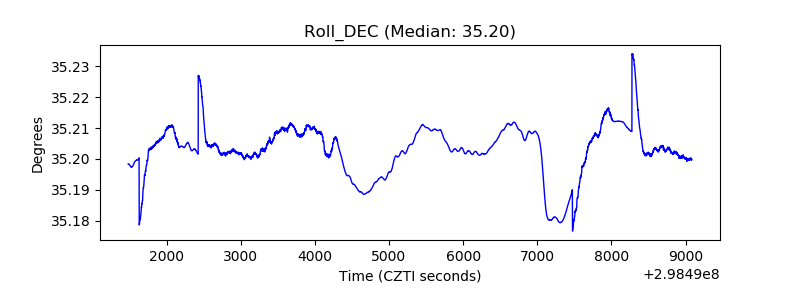 |
| _Roll_RA | 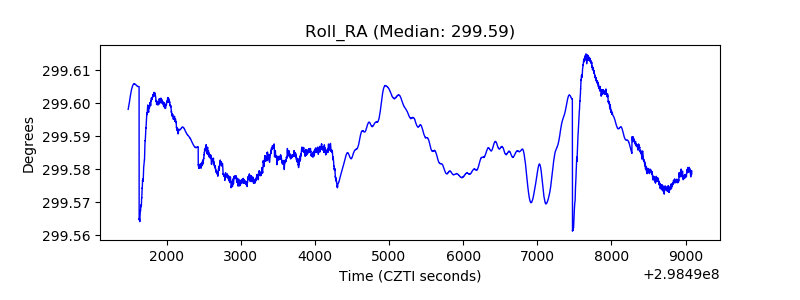 |
| Veto Counter | 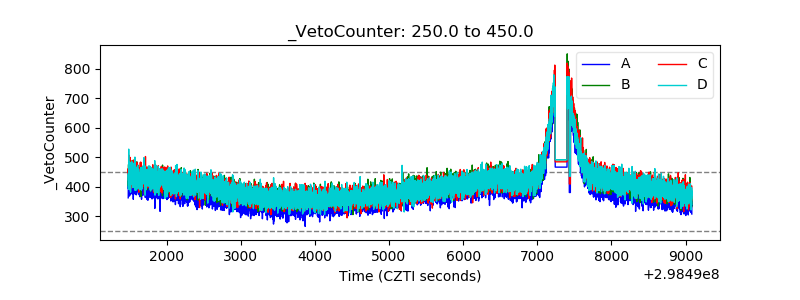 |