| Param | Original file | Final file |
|---|---|---|
| Filename | modeM0/AS1A05_180T01_9000002992_20113cztM0_level2.evt | modeM0/AS1A05_180T01_9000002992_20113cztM0_level2_quad_clean.evt |
| Size (bytes) | 1,160,579,520 | 184,662,720 |
| Size | 1.1 GB | 176.1 MB |
| Events in quadrant A | 8,031,133 | 1,189,179 |
| Events in quadrant B | 8,285,257 | 1,198,999 |
| Events in quadrant C | 6,330,943 | 1,187,813 |
| Events in quadrant D | 11,620,098 | 1,114,552 |
| Mode M9 | |||
|---|---|---|---|
| Quadrant | BADHDUFLAG | Total packets | Discarded packets |
| A | 0 | 17 | 0 |
| B | 0 | 17 | 0 |
| C | 0 | 17 | 0 |
| D | 0 | 17 | 0 |
| Mode M0 | |||
|---|---|---|---|
| Quadrant | BADHDUFLAG | Total packets | Discarded packets |
| A | 0 | 32407 | 3 |
| B | 0 | 33375 | 3 |
| C | 0 | 27157 | 3 |
| D | 0 | 43325 | 3 |
| Mode SS | |||
|---|---|---|---|
| Quadrant | BADHDUFLAG | Total packets | Discarded packets |
| A | 0 | 268 | 0 |
| B | 0 | 268 | 0 |
| C | 0 | 268 | 0 |
| D | 0 | 268 | 0 |
| Quadrant | Total seconds | Saturated seconds | Saturation percentage |
|---|---|---|---|
| A | 13044 | 747 | 5.726771% |
| B | 13045 | 517 | 3.963204% |
| C | 13045 | 181 | 1.387505% |
| D | 13045 | 1667 | 12.778842% |
Noise dominated data is calculated using 1-second bins in cleaned event files. If a bin has >2000 counts, and if more than 50% of those come from <1% of pixels, then it is considered to be noise-dominated and hence unusable.
| Quadrant | # 1 sec bins | Bins with >0 counts | Bins with >2000 counts | High rate bins dominated by noise | Noise dominated (total time) | Noise dominated (detector-on time) | Marked lightcurve |
|---|---|---|---|---|---|---|---|
| A | 14764 | 13046 | 425 | 425 | 2.88% | 3.26% | 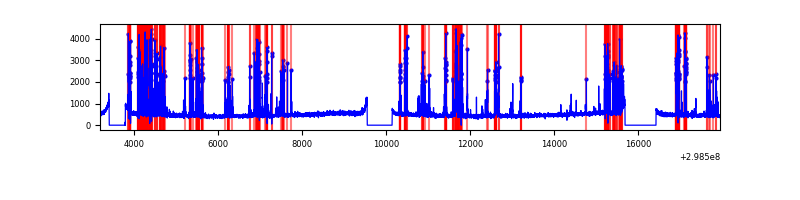 |
| B | 14765 | 13047 | 309 | 309 | 2.09% | 2.37% | 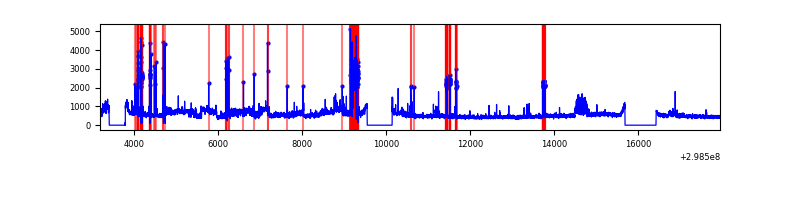 |
| C | 14765 | 13047 | 0 | 0 | 0.00% | 0.00% |  |
| D | 14765 | 13047 | 1363 | 1363 | 9.23% | 10.45% | 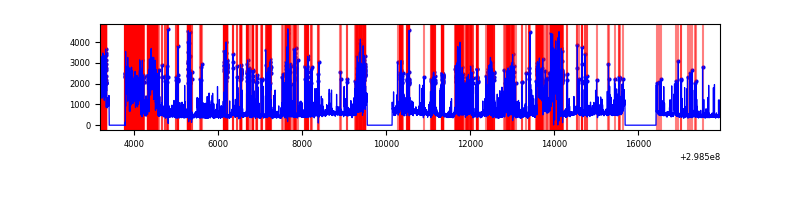 |
Top three noisy pixels from each quadrant. If the there are fewer than three noisy pixels in the level2.evt file, extra rows are filled as -1
| Pixel properties | Quadrant properties | ||||||
|---|---|---|---|---|---|---|---|
| Quadrant | DetID | PixID | Counts | Sigma | Mean | Median | Sigma |
| A | 14 | 238 | 1868779 | 5919.09 | 1565 | 1534 | 315.5 |
| A | 14 | 254 | 92696 | 288.98 | 1565 | 1534 | 315.5 |
| A | 14 | 237 | 18473 | 53.7 | 1565 | 1534 | 315.5 |
| B | 10 | 245 | 2021756 | 6795.06 | 1563 | 1527 | 297.3 |
| B | 0 | 183 | 59200 | 193.98 | 1563 | 1527 | 297.3 |
| B | 12 | 111 | 36491 | 117.6 | 1563 | 1527 | 297.3 |
| C | 14 | 238 | 239708 | 660.36 | 1536 | 1549 | 360.6 |
| C | 3 | 233 | 82320 | 223.96 | 1536 | 1549 | 360.6 |
| C | 8 | 128 | 15124 | 37.64 | 1536 | 1549 | 360.6 |
| D | 1 | 52 | 5934906 | 16648.18 | 1467 | 1429 | 356.4 |
| D | 7 | 238 | 53239 | 145.37 | 1467 | 1429 | 356.4 |
| D | 2 | 234 | 52054 | 142.04 | 1467 | 1429 | 356.4 |
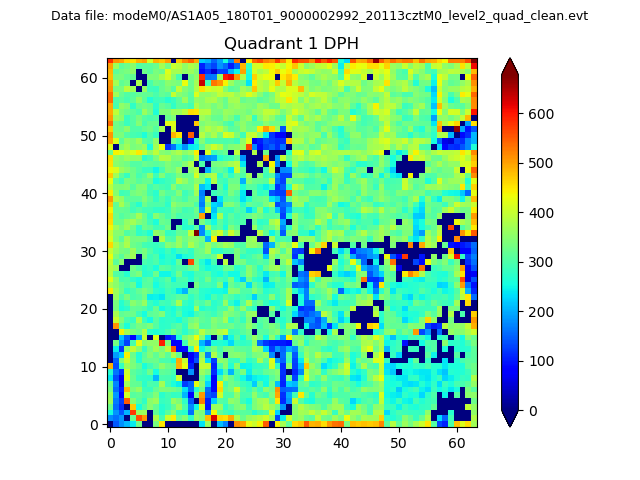
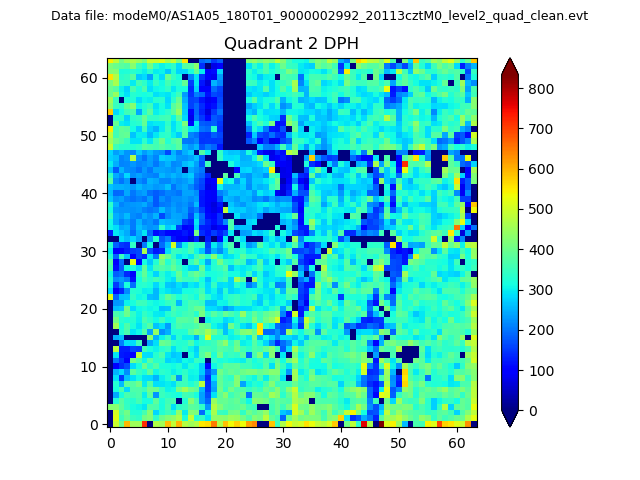
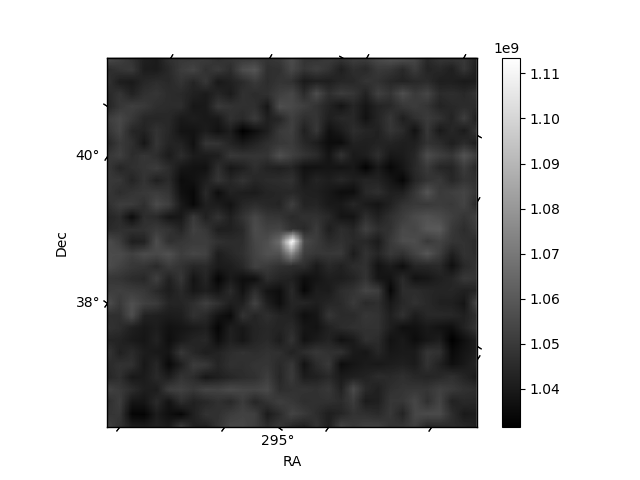
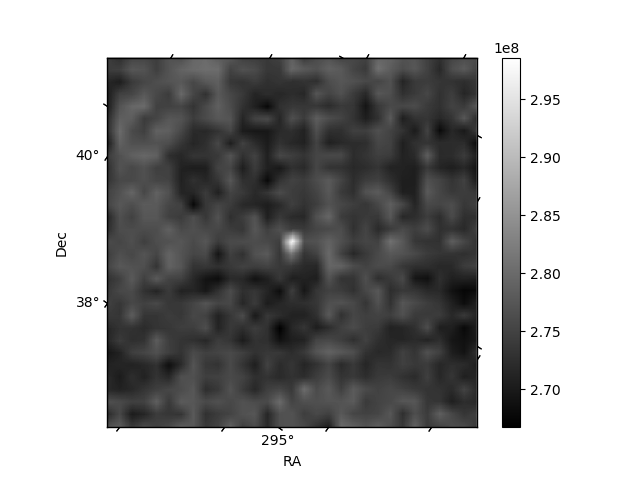
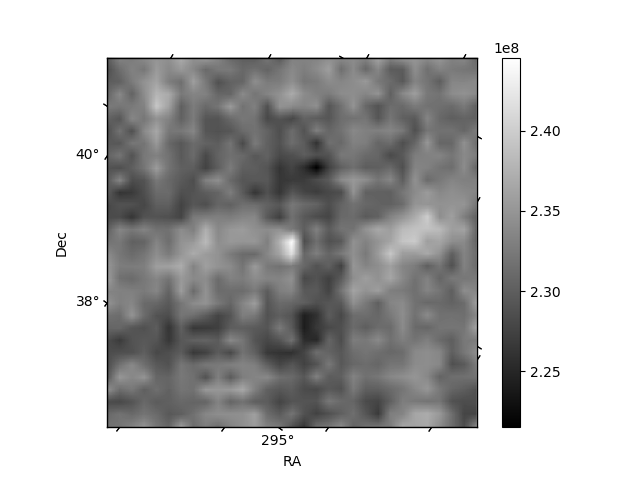
Histogram calculated using DETX and DETY for each event in the final _common_clean file
| Quadrant A | 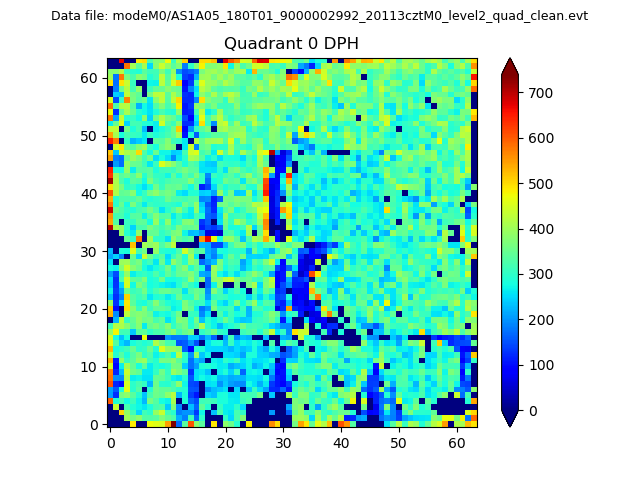 |
 |
Quadrant B |
|---|---|---|---|
| Quadrant D | 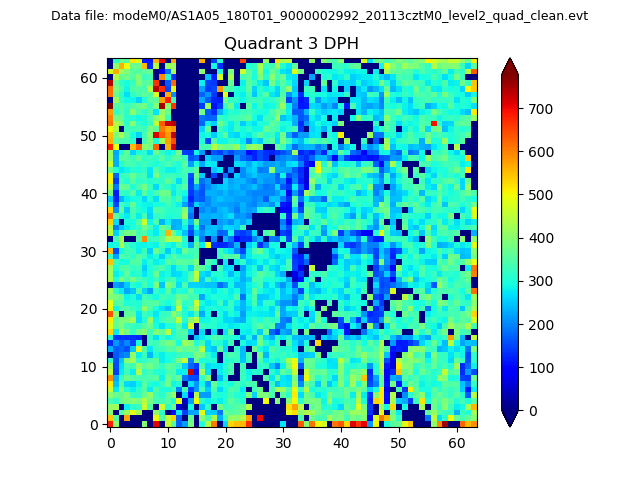 |
 |
Quadrant C |
| Plot type | Count rate plots | Images |
|---|---|---|
| Comparison with Poisson distribution Blue bars denote a histogram of data divided into 1 sec bins. Red curve is a Poisson curve with rate = median count rate of data. |
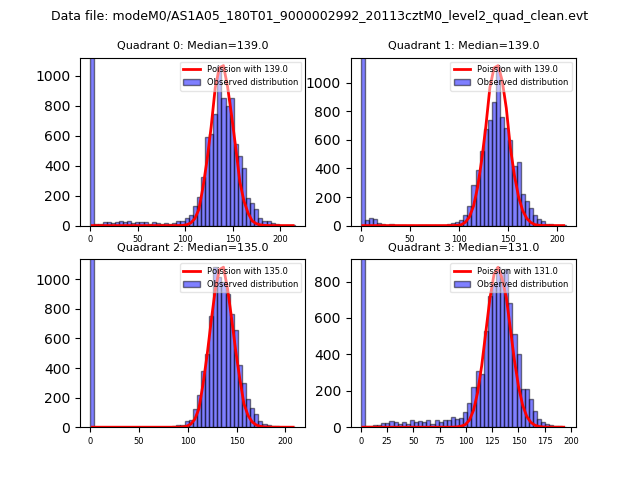 |
 |
| Quadrant-wise count rates Data is divided into 100 sec bins |
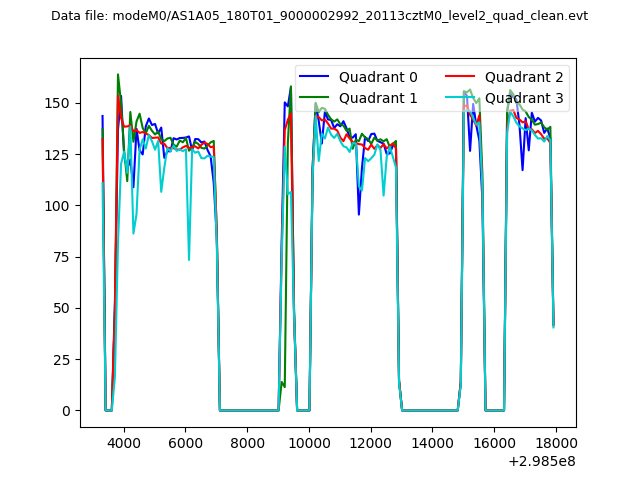 |
|
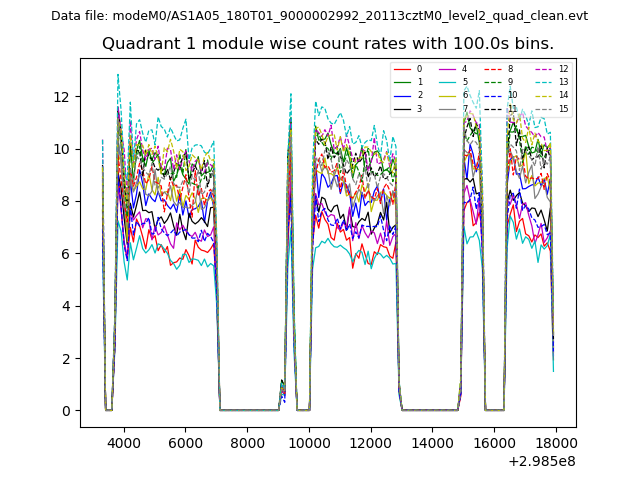
| Module-wise count rates for Quadrant A Data is divided into 100 sec bins |
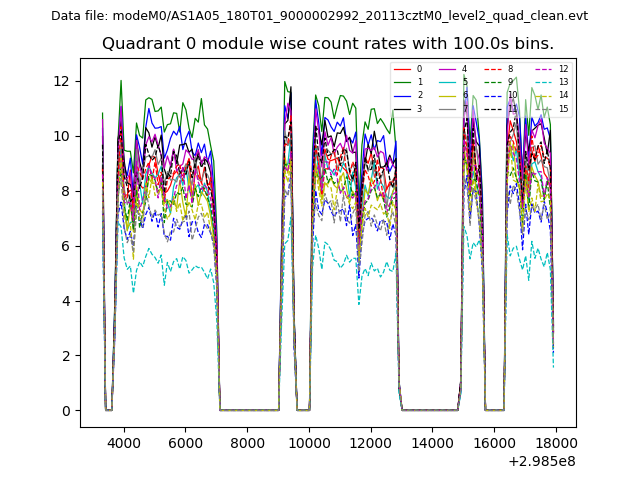 |
 |
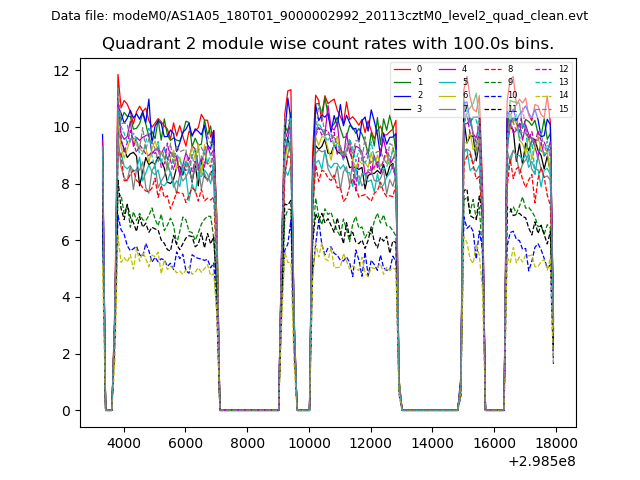
| Module-wise count rates for Quadrant B Data is divided into 100 sec bins |
 |
 |
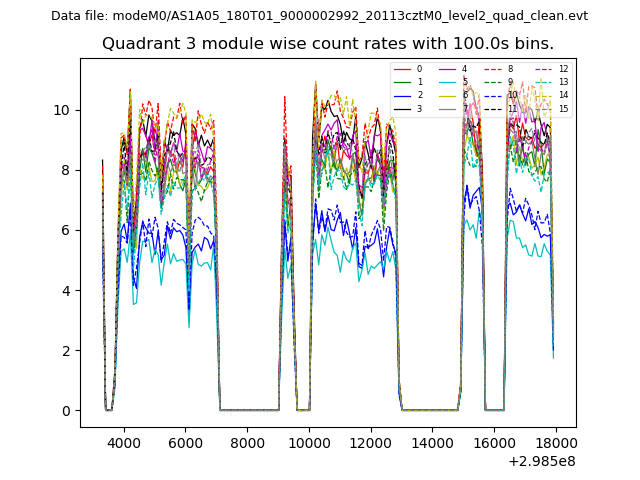
| Module-wise count rates for Quadrant C Data is divided into 100 sec bins |
 |
 |
| Module-wise count rates for Quadrant D Data is divided into 100 sec bins |
 |
 |
| Parameter | Plot |
|---|---|
| CZT HV Monitor | 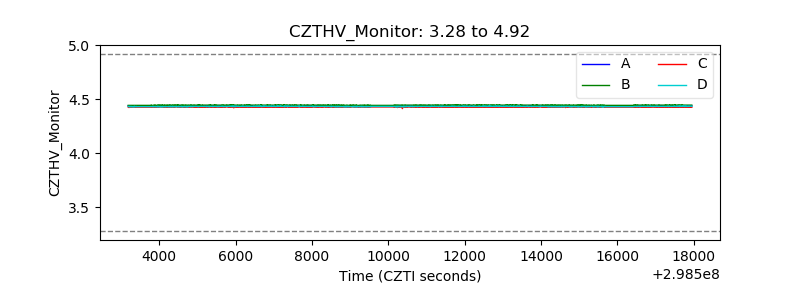 |
| D_VDD | 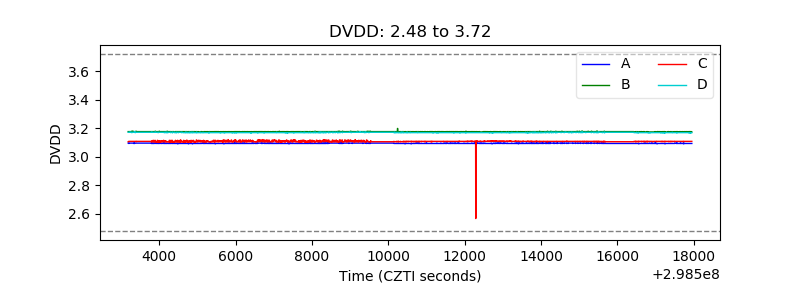 |
| Temperature 1 | 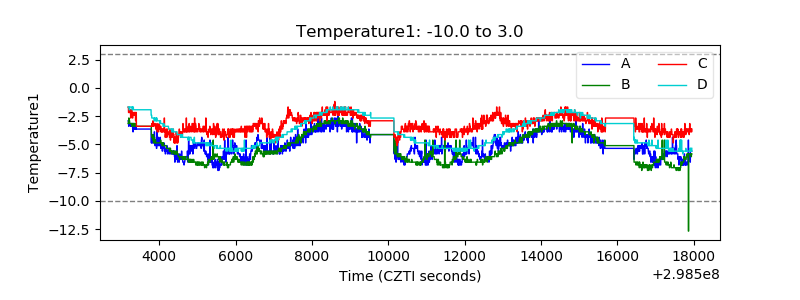 |
| Veto HV Monitor | 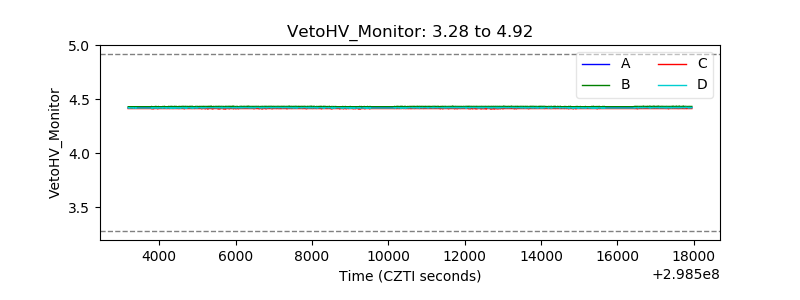 |
| Veto LLD | 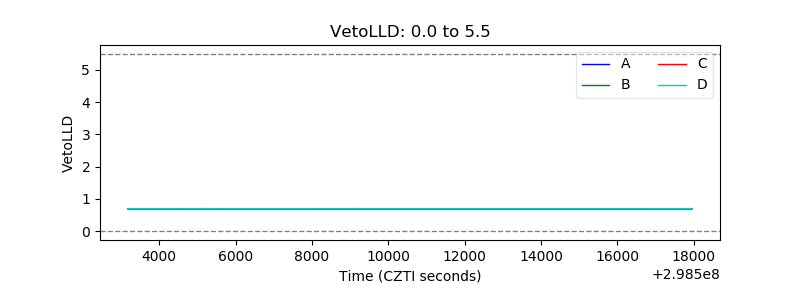 |
| Alpha Counter | 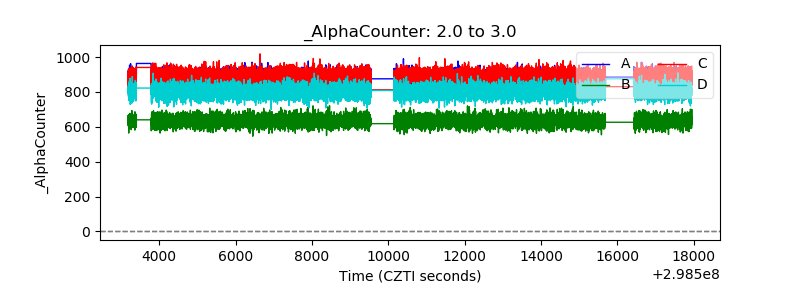 |
| _CPM_Rate | 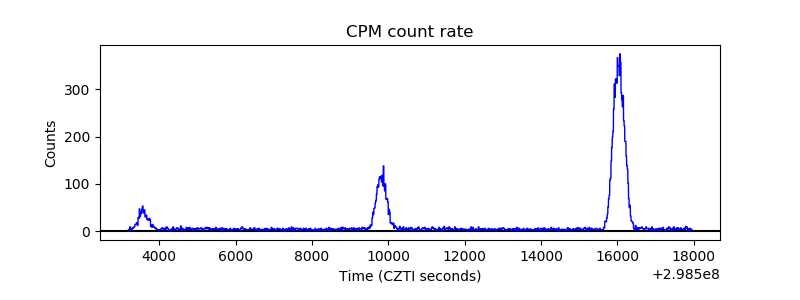 |
| CZT Counter | 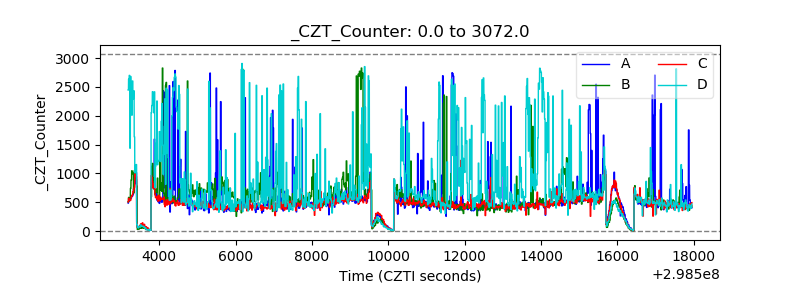 |
| +2.5 Volts monitor |  |
| +5 Volts monitor |  |
| _ROLL_ROT | 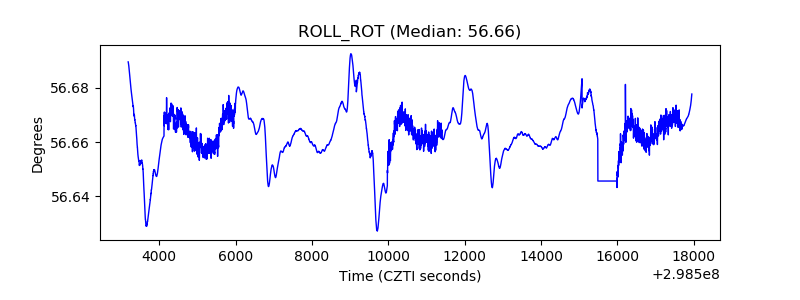 |
| _Roll_DEC | 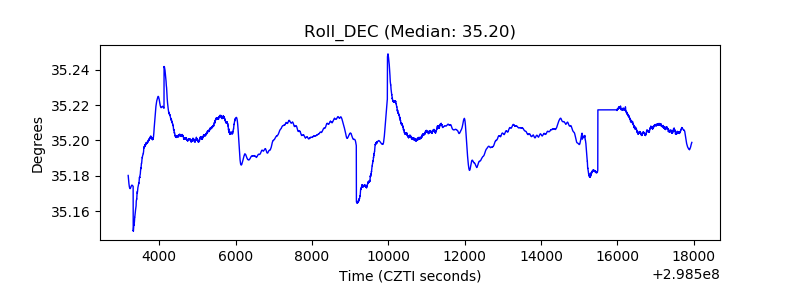 |
| _Roll_RA | 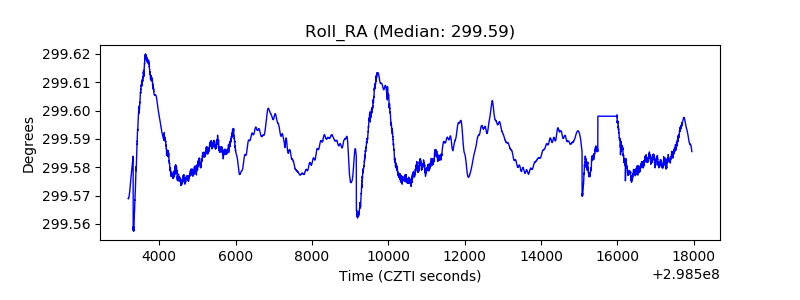 |
| Veto Counter | 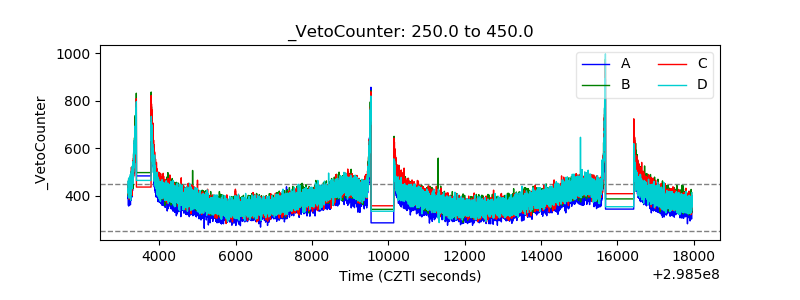 |