| Param | Original file | Final file |
|---|---|---|
| Filename | modeM0/AS1A05_180T01_9000002992_20114cztM0_level2.evt | modeM0/AS1A05_180T01_9000002992_20114cztM0_level2_quad_clean.evt |
| Size (bytes) | 601,551,360 | 107,251,200 |
| Size | 573.7 MB | 102.3 MB |
| Events in quadrant A | 4,118,596 | 700,053 |
| Events in quadrant B | 3,864,090 | 716,347 |
| Events in quadrant C | 3,357,162 | 689,120 |
| Events in quadrant D | 6,405,221 | 656,394 |
| Mode M9 | |||
|---|---|---|---|
| Quadrant | BADHDUFLAG | Total packets | Discarded packets |
| A | 0 | 17 | 0 |
| B | 0 | 17 | 0 |
| C | 0 | 17 | 0 |
| D | 0 | 17 | 0 |
| Mode M0 | |||
|---|---|---|---|
| Quadrant | BADHDUFLAG | Total packets | Discarded packets |
| A | 0 | 16752 | 2 |
| B | 0 | 16052 | 2 |
| C | 0 | 14459 | 2 |
| D | 0 | 23807 | 2 |
| Mode SS | |||
|---|---|---|---|
| Quadrant | BADHDUFLAG | Total packets | Discarded packets |
| A | 0 | 142 | 0 |
| B | 0 | 142 | 0 |
| C | 0 | 142 | 0 |
| D | 0 | 142 | 0 |
| Quadrant | Total seconds | Saturated seconds | Saturation percentage |
|---|---|---|---|
| A | 6981 | 339 | 4.856038% |
| B | 6981 | 101 | 1.446784% |
| C | 6981 | 86 | 1.231915% |
| D | 6982 | 1048 | 15.010026% |
Noise dominated data is calculated using 1-second bins in cleaned event files. If a bin has >2000 counts, and if more than 50% of those come from <1% of pixels, then it is considered to be noise-dominated and hence unusable.
| Quadrant | # 1 sec bins | Bins with >0 counts | Bins with >2000 counts | High rate bins dominated by noise | Noise dominated (total time) | Noise dominated (detector-on time) | Marked lightcurve |
|---|---|---|---|---|---|---|---|
| A | 8641 | 6983 | 173 | 173 | 2.00% | 2.48% | 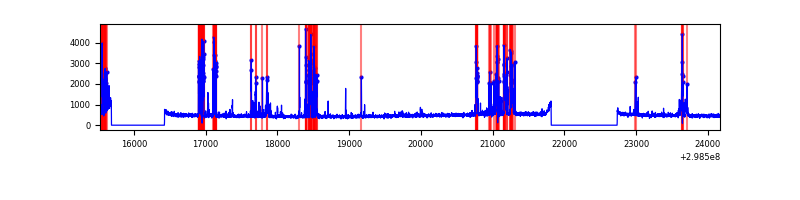 |
| B | 8641 | 6983 | 11 | 11 | 0.13% | 0.16% | 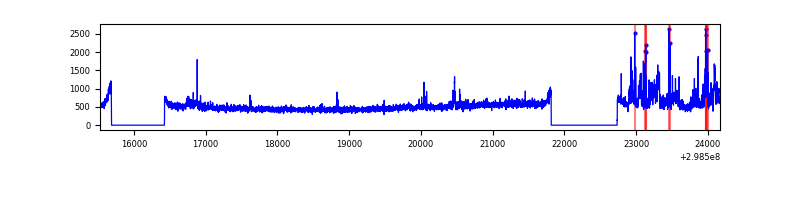 |
| C | 8641 | 6983 | 0 | 0 | 0.00% | 0.00% | 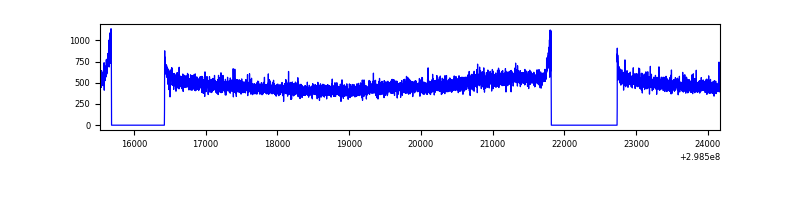 |
| D | 8642 | 6984 | 929 | 929 | 10.75% | 13.30% | 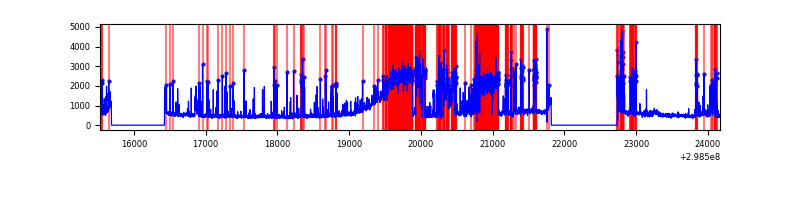 |
Top three noisy pixels from each quadrant. If the there are fewer than three noisy pixels in the level2.evt file, extra rows are filled as -1
| Pixel properties | Quadrant properties | ||||||
|---|---|---|---|---|---|---|---|
| Quadrant | DetID | PixID | Counts | Sigma | Mean | Median | Sigma |
| A | 14 | 238 | 821949 | 4801.4 | 847 | 830 | 171.0 |
| A | 9 | 143 | 15583 | 86.27 | 847 | 830 | 171.0 |
| A | 14 | 237 | 11778 | 64.02 | 847 | 830 | 171.0 |
| B | 10 | 245 | 451072 | 2741.82 | 855 | 836 | 164.2 |
| B | 0 | 198 | 32479 | 192.7 | 855 | 836 | 164.2 |
| B | 0 | 183 | 27310 | 161.22 | 855 | 836 | 164.2 |
| C | 14 | 238 | 127426 | 654.78 | 823 | 830 | 193.3 |
| C | 3 | 233 | 20414 | 101.29 | 823 | 830 | 193.3 |
| C | 13 | 61 | 5910 | 26.27 | 823 | 830 | 193.3 |
| D | 7 | 238 | 2374067 | 12437.91 | 789 | 769 | 190.8 |
| D | 1 | 52 | 804017 | 4209.64 | 789 | 769 | 190.8 |
| D | 11 | 176 | 141124 | 735.57 | 789 | 769 | 190.8 |
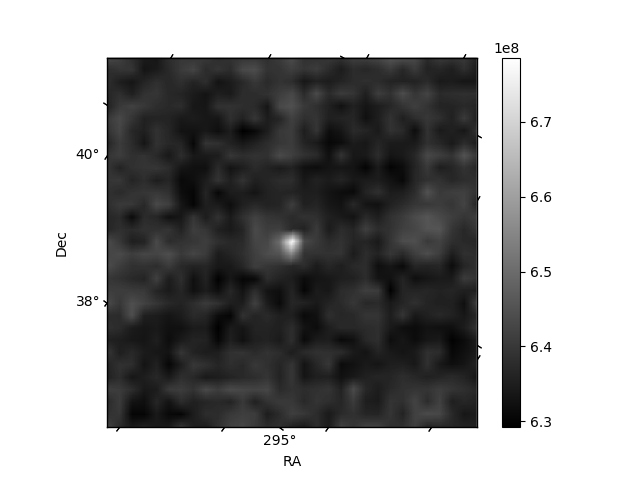
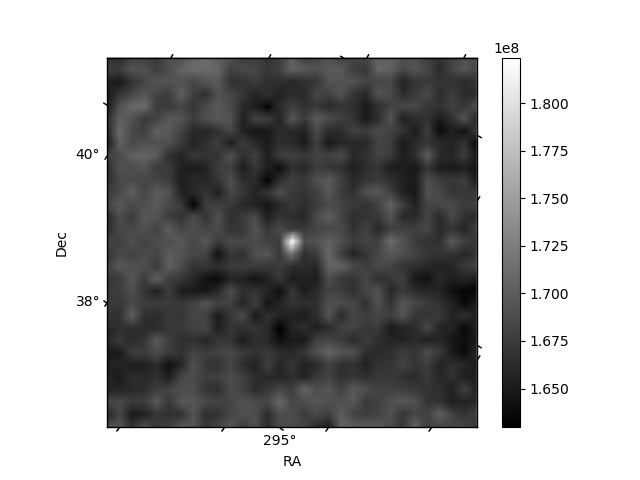
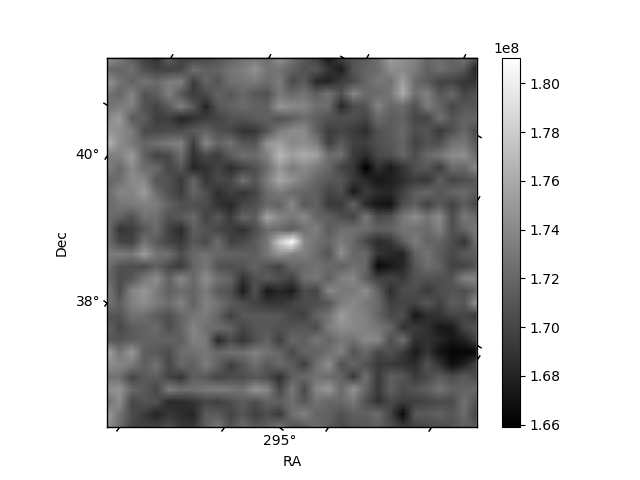
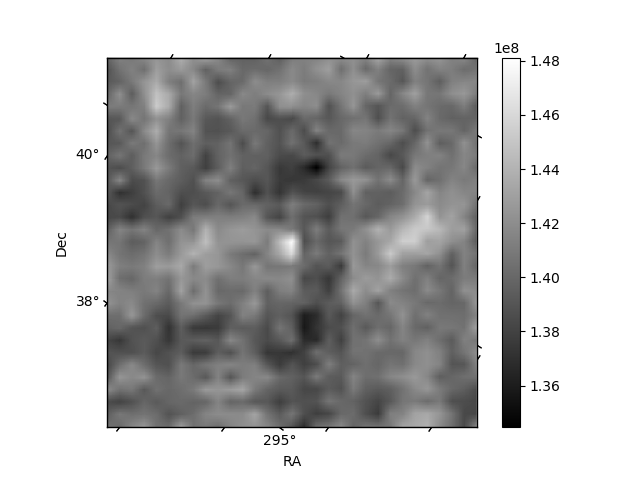
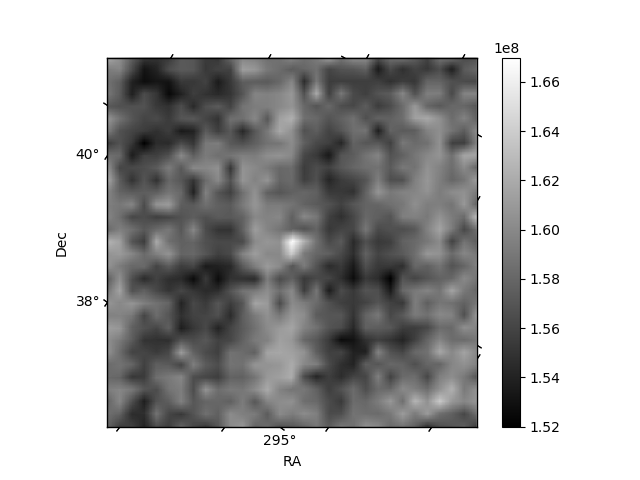
Histogram calculated using DETX and DETY for each event in the final _common_clean file
| Quadrant A | 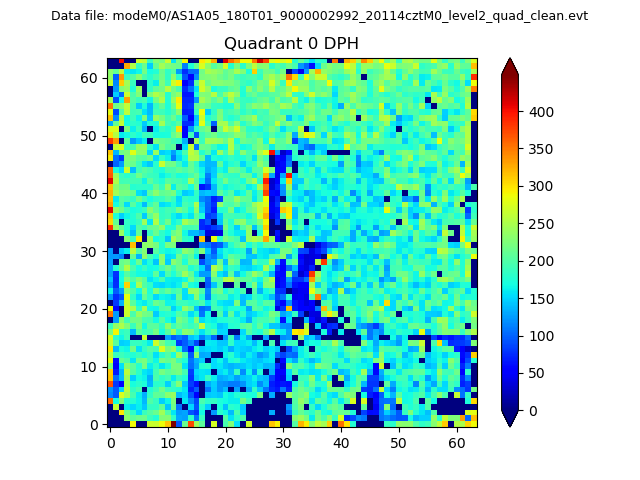 |
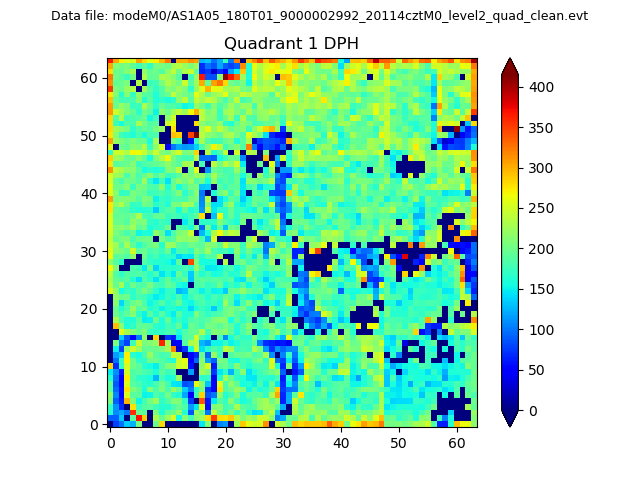 |
Quadrant B |
|---|---|---|---|
| Quadrant D | 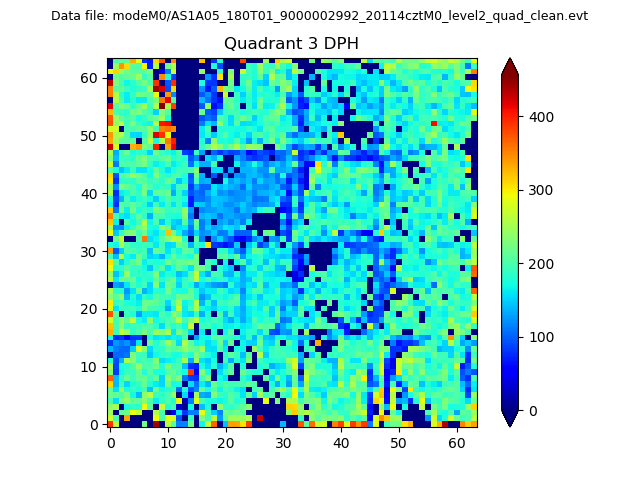 |
 |
Quadrant C |
| Plot type | Count rate plots | Images |
|---|---|---|
| Comparison with Poisson distribution Blue bars denote a histogram of data divided into 1 sec bins. Red curve is a Poisson curve with rate = median count rate of data. |
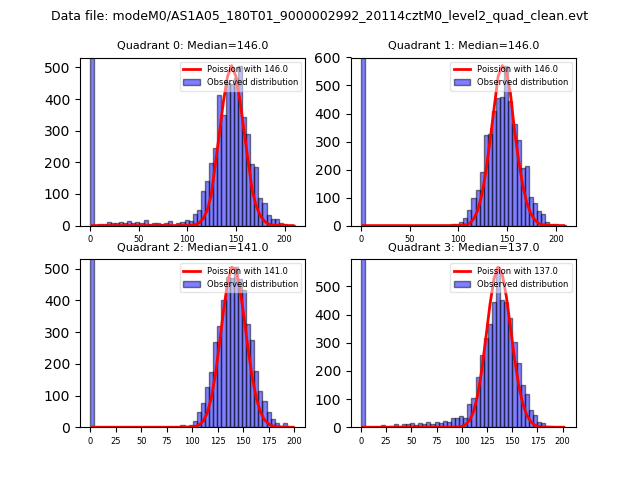 |
 |
| Quadrant-wise count rates Data is divided into 100 sec bins |
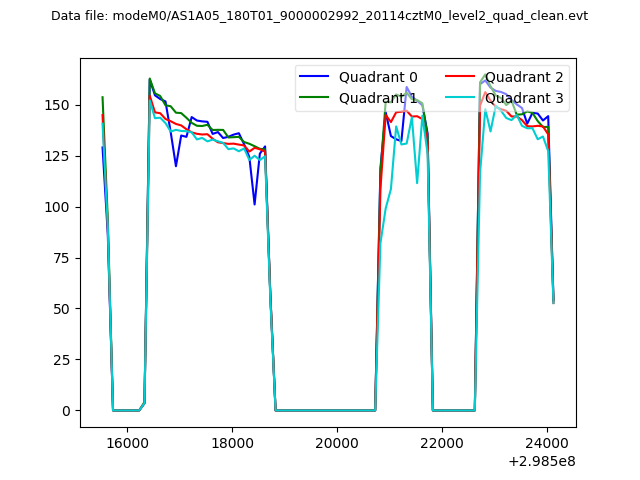 |
|
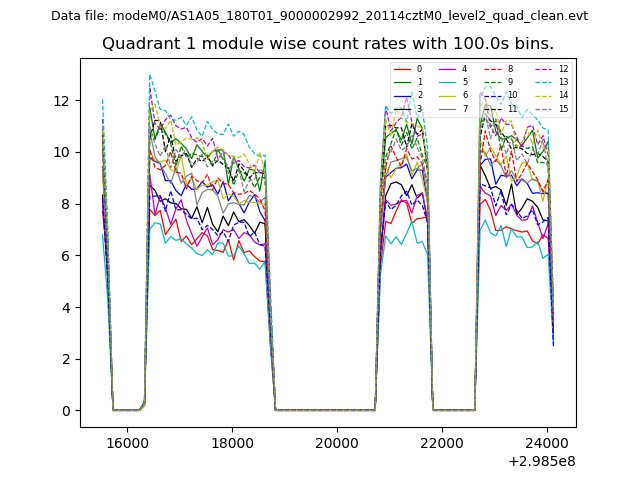
| Module-wise count rates for Quadrant A Data is divided into 100 sec bins |
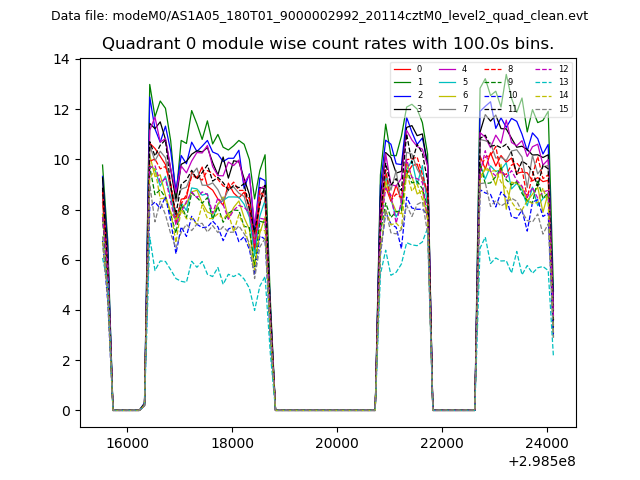 |
 |
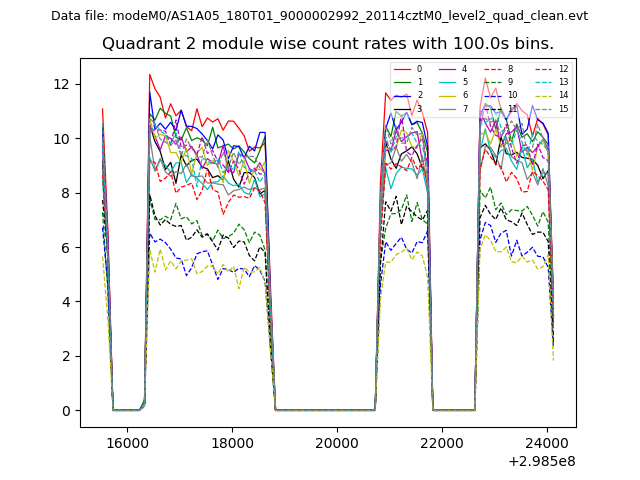
| Module-wise count rates for Quadrant B Data is divided into 100 sec bins |
 |
 |
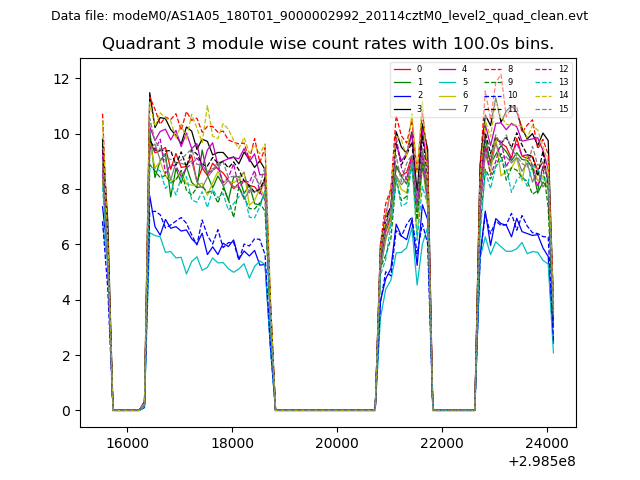
| Module-wise count rates for Quadrant C Data is divided into 100 sec bins |
 |
 |
| Module-wise count rates for Quadrant D Data is divided into 100 sec bins |
 |
 |
| Parameter | Plot |
|---|---|
| CZT HV Monitor | 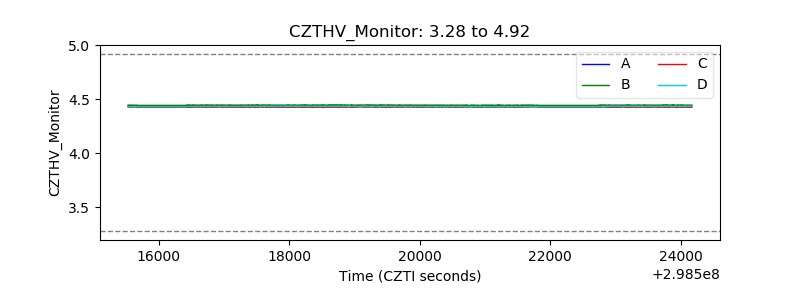 |
| D_VDD | 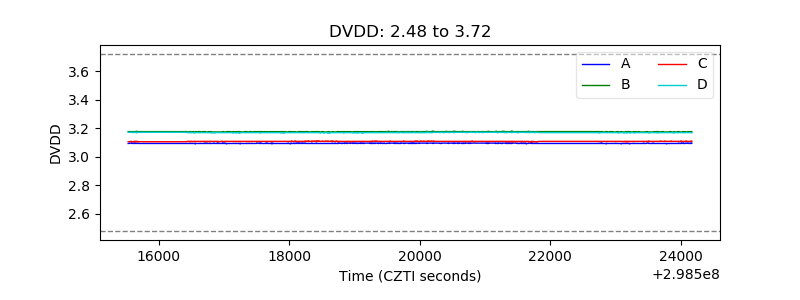 |
| Temperature 1 | 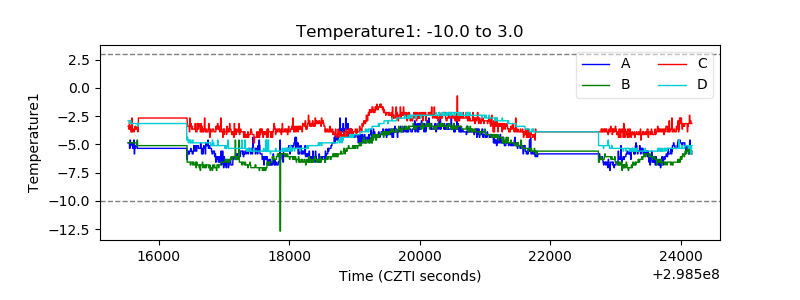 |
| Veto HV Monitor | 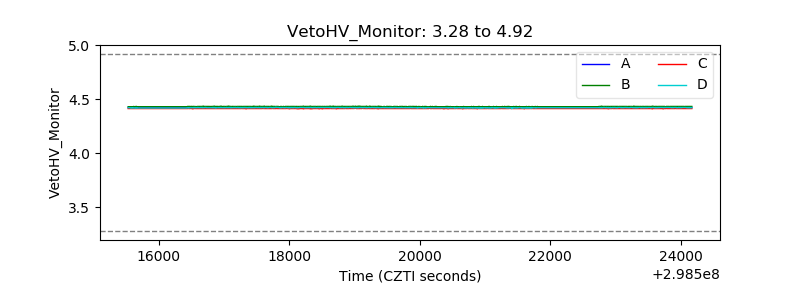 |
| Veto LLD | 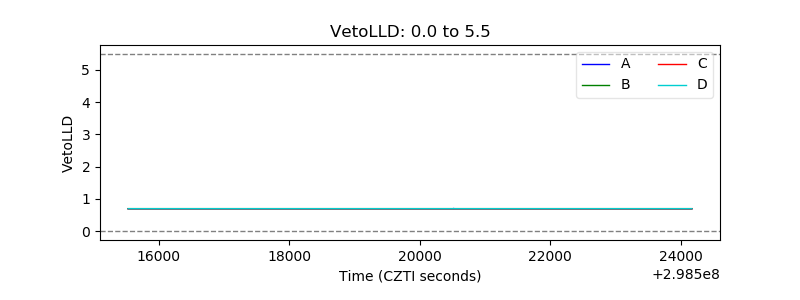 |
| Alpha Counter | 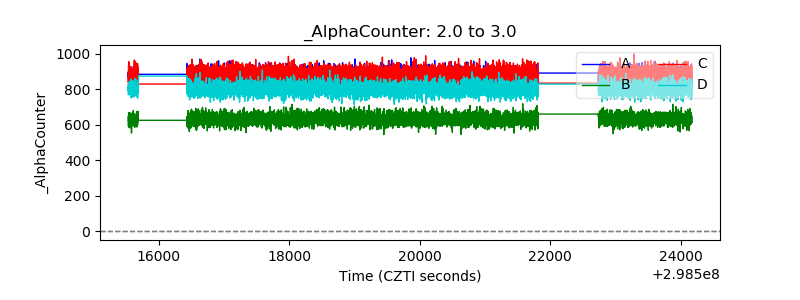 |
| _CPM_Rate | 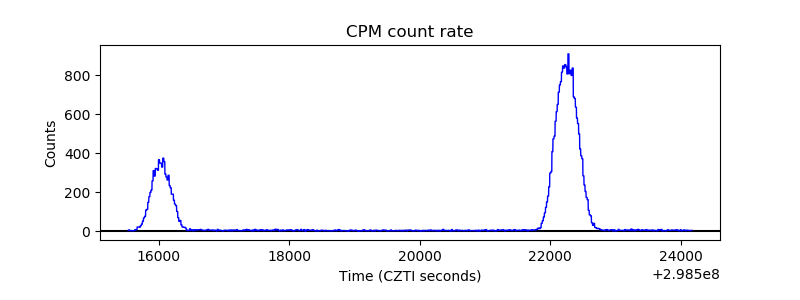 |
| CZT Counter | 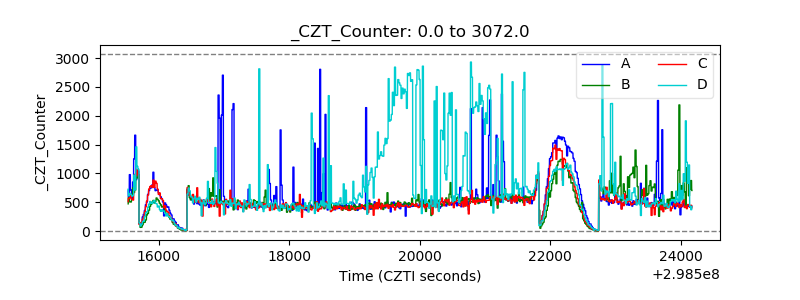 |
| +2.5 Volts monitor |  |
| +5 Volts monitor |  |
| _ROLL_ROT | 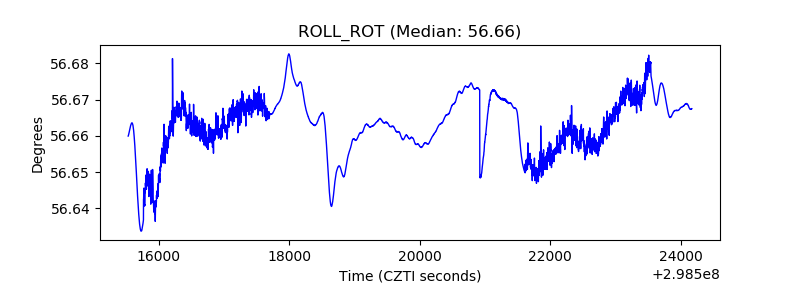 |
| _Roll_DEC | 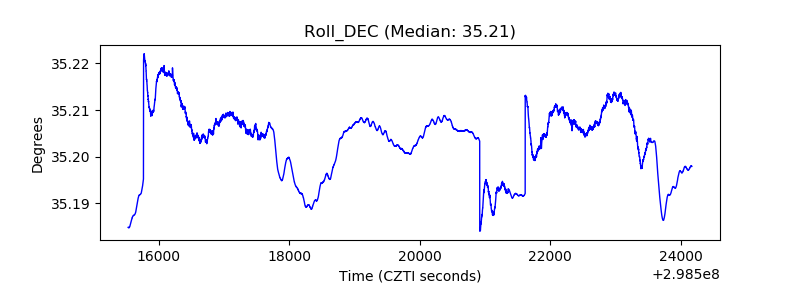 |
| _Roll_RA |  |
| Veto Counter | 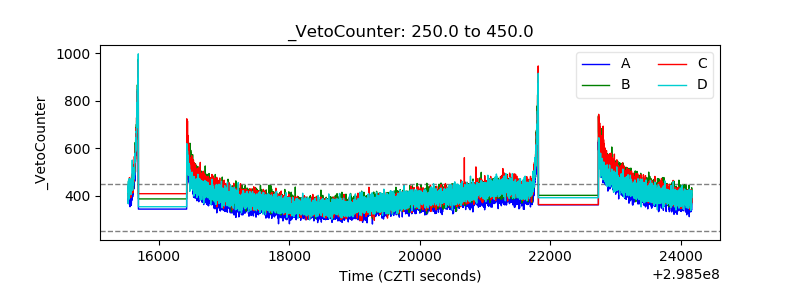 |