| Param | Original file | Final file |
|---|---|---|
| Filename | modeM0/AS1A05_180T01_9000002992_20118cztM0_level2.evt | modeM0/AS1A05_180T01_9000002992_20118cztM0_level2_quad_clean.evt |
| Size (bytes) | 583,894,080 | 92,928,960 |
| Size | 556.8 MB | 88.6 MB |
| Events in quadrant A | 3,775,951 | 618,579 |
| Events in quadrant B | 4,453,476 | 619,521 |
| Events in quadrant C | 3,377,117 | 584,403 |
| Events in quadrant D | 5,649,860 | 551,753 |
| Mode M9 | |||
|---|---|---|---|
| Quadrant | BADHDUFLAG | Total packets | Discarded packets |
| A | 0 | 15 | 0 |
| B | 0 | 16 | 0 |
| C | 0 | 16 | 0 |
| D | 0 | 16 | 0 |
| Mode M0 | |||
|---|---|---|---|
| Quadrant | BADHDUFLAG | Total packets | Discarded packets |
| A | 0 | 14966 | 2 |
| B | 0 | 17297 | 2 |
| C | 0 | 13796 | 2 |
| D | 0 | 20906 | 2 |
| Mode SS | |||
|---|---|---|---|
| Quadrant | BADHDUFLAG | Total packets | Discarded packets |
| A | 0 | 128 | 0 |
| B | 0 | 128 | 0 |
| C | 0 | 128 | 0 |
| D | 0 | 128 | 0 |
| Quadrant | Total seconds | Saturated seconds | Saturation percentage |
|---|---|---|---|
| A | 6302 | 167 | 2.649952% |
| B | 6302 | 151 | 2.396065% |
| C | 6302 | 82 | 1.301174% |
| D | 6302 | 844 | 13.392574% |
Noise dominated data is calculated using 1-second bins in cleaned event files. If a bin has >2000 counts, and if more than 50% of those come from <1% of pixels, then it is considered to be noise-dominated and hence unusable.
| Quadrant | # 1 sec bins | Bins with >0 counts | Bins with >2000 counts | High rate bins dominated by noise | Noise dominated (total time) | Noise dominated (detector-on time) | Marked lightcurve |
|---|---|---|---|---|---|---|---|
| A | 7597 | 6303 | 80 | 80 | 1.05% | 1.27% | 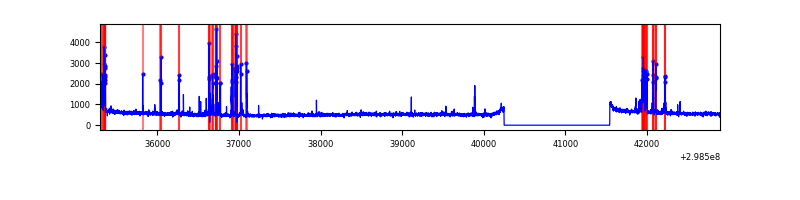 |
| B | 7597 | 6303 | 29 | 29 | 0.38% | 0.46% | 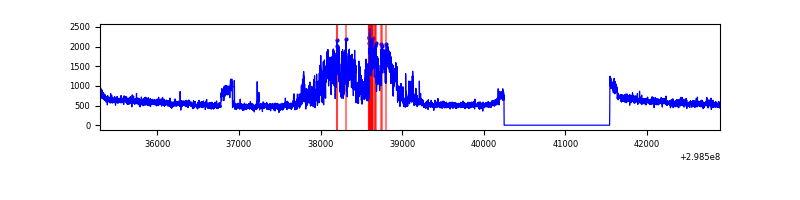 |
| C | 7597 | 6303 | 0 | 0 | 0.00% | 0.00% | 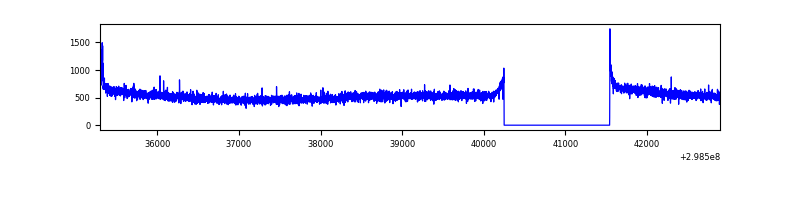 |
| D | 7597 | 6302 | 549 | 549 | 7.23% | 8.71% | 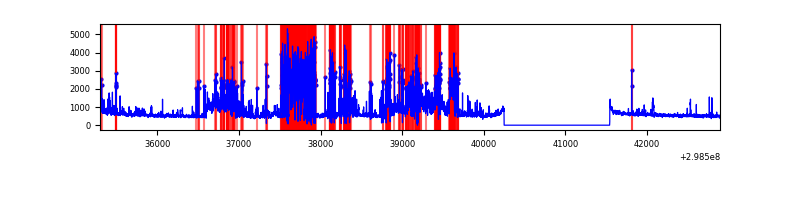 |
Top three noisy pixels from each quadrant. If the there are fewer than three noisy pixels in the level2.evt file, extra rows are filled as -1
| Pixel properties | Quadrant properties | ||||||
|---|---|---|---|---|---|---|---|
| Quadrant | DetID | PixID | Counts | Sigma | Mean | Median | Sigma |
| A | 14 | 238 | 386044 | 2231.36 | 877 | 865 | 172.6 |
| A | 9 | 143 | 9569 | 50.42 | 877 | 865 | 172.6 |
| A | 0 | 226 | 7634 | 39.21 | 877 | 865 | 172.6 |
| B | 10 | 245 | 1028495 | 6305.78 | 866 | 848 | 163.0 |
| B | 0 | 198 | 19930 | 117.09 | 866 | 848 | 163.0 |
| B | 12 | 111 | 18687 | 109.46 | 866 | 848 | 163.0 |
| C | 14 | 238 | 134192 | 705.82 | 822 | 829 | 188.9 |
| C | 3 | 233 | 30269 | 155.81 | 822 | 829 | 188.9 |
| C | 0 | 207 | 8248 | 39.26 | 822 | 829 | 188.9 |
| D | 1 | 52 | 2429990 | 12893.08 | 783 | 764 | 188.4 |
| D | 11 | 176 | 185191 | 978.84 | 783 | 764 | 188.4 |
| D | 7 | 96 | 54488 | 285.14 | 783 | 764 | 188.4 |
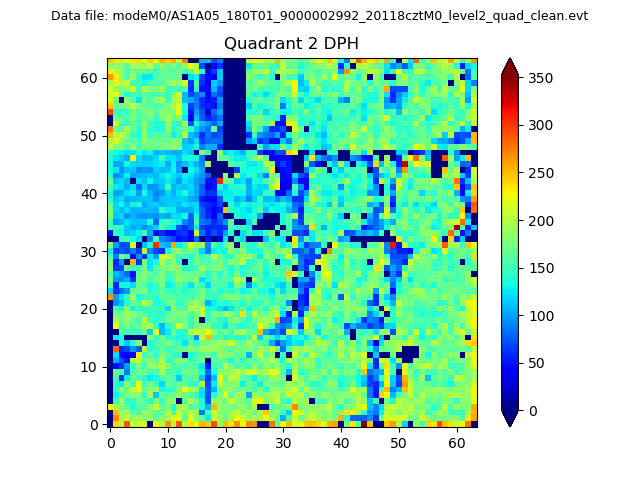
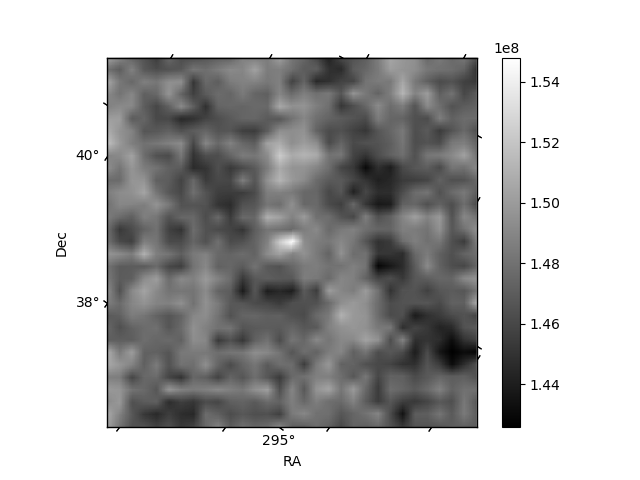
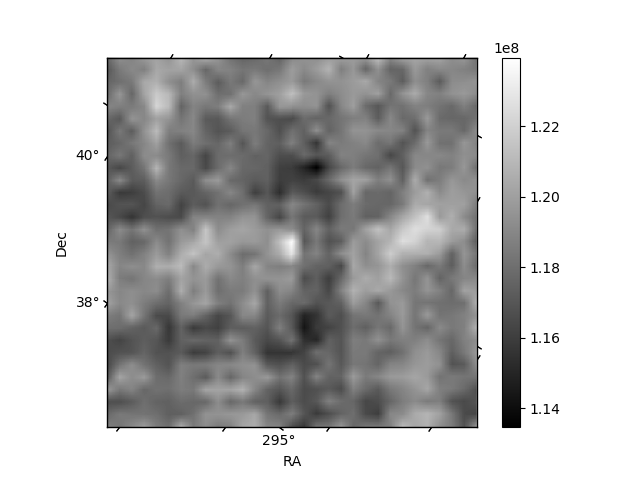
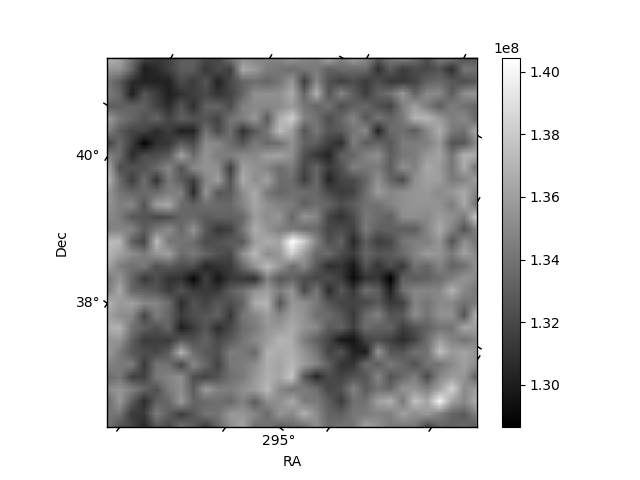
Histogram calculated using DETX and DETY for each event in the final _common_clean file
| Quadrant A | 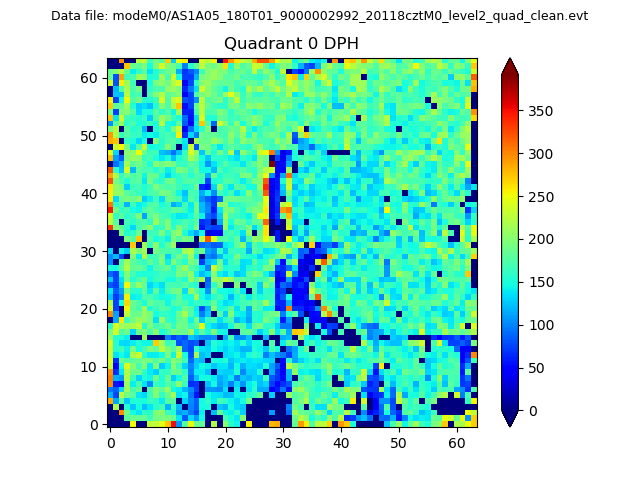 |
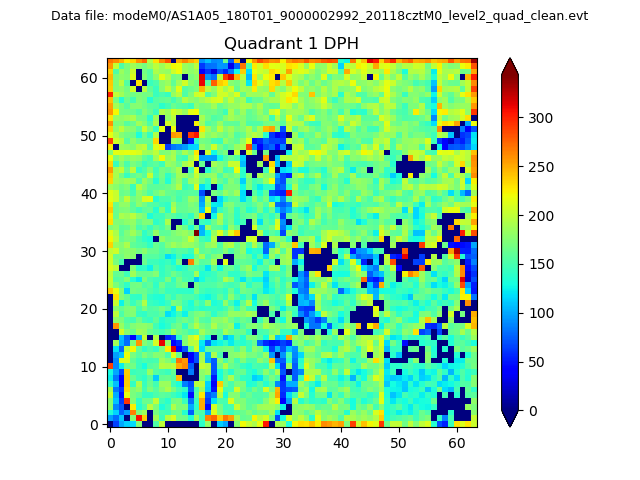 |
Quadrant B |
|---|---|---|---|
| Quadrant D | 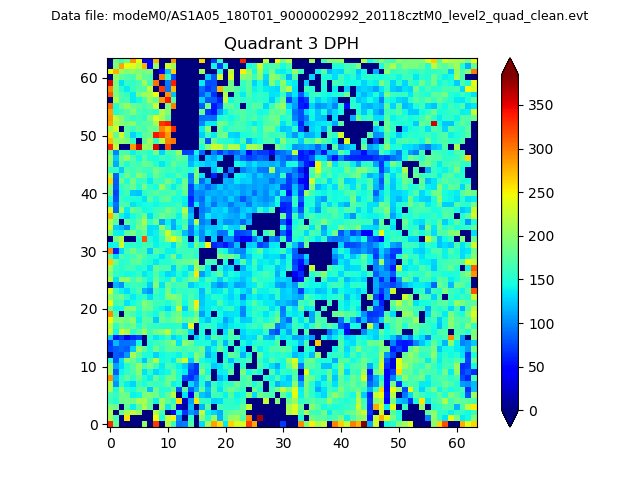 |
 |
Quadrant C |
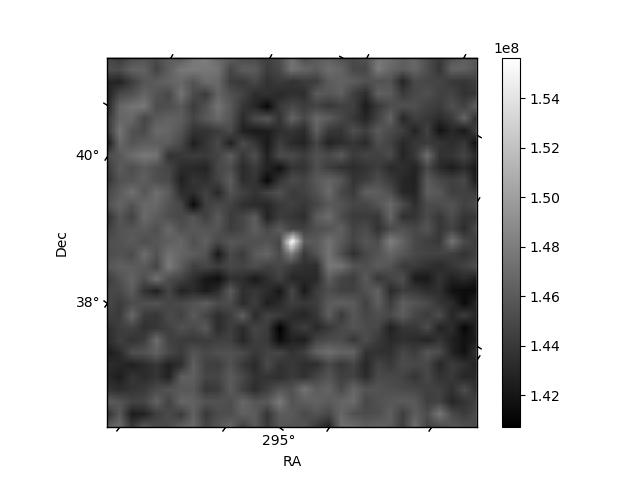
| Plot type | Count rate plots | Images |
|---|---|---|
| Comparison with Poisson distribution Blue bars denote a histogram of data divided into 1 sec bins. Red curve is a Poisson curve with rate = median count rate of data. |
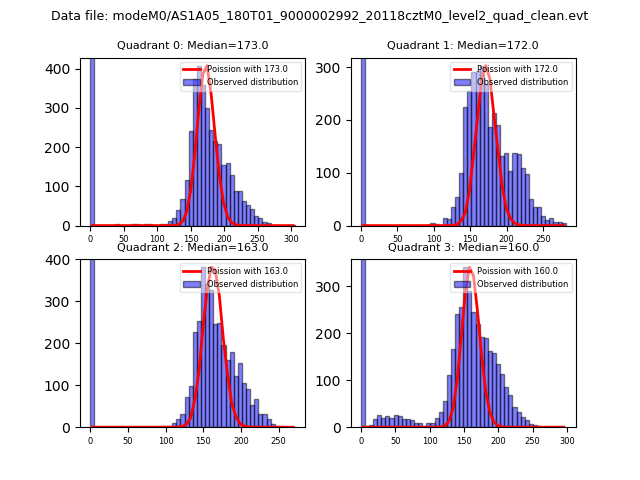 |
 |
| Quadrant-wise count rates Data is divided into 100 sec bins |
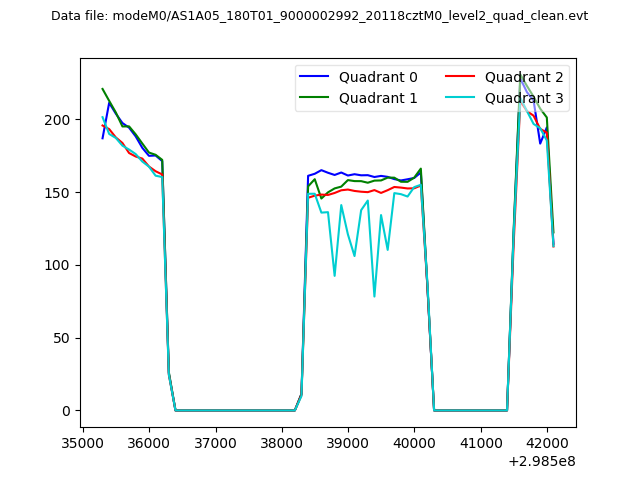 |
|
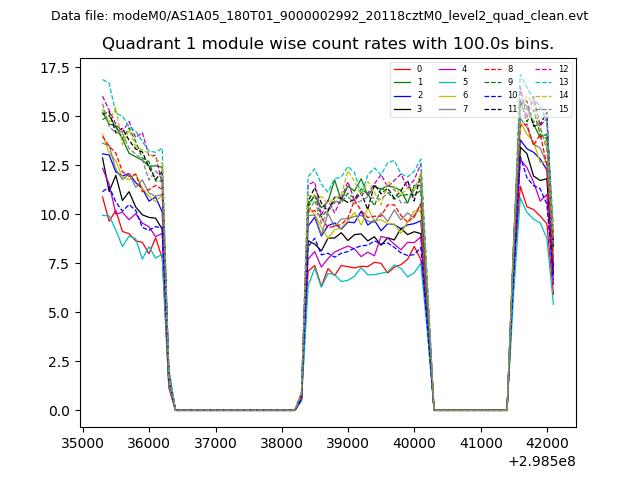
| Module-wise count rates for Quadrant A Data is divided into 100 sec bins |
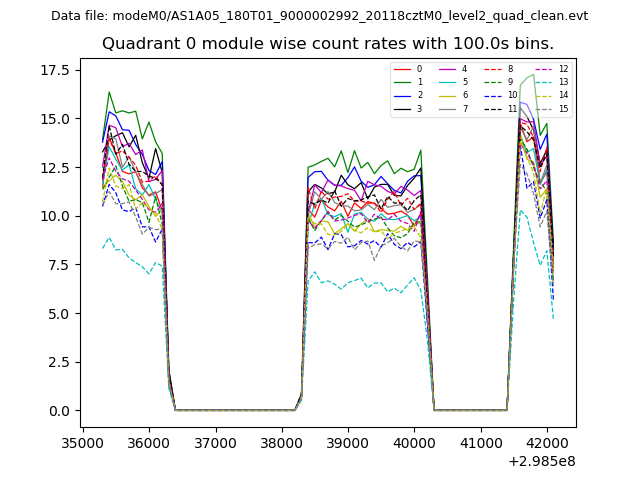 |
 |
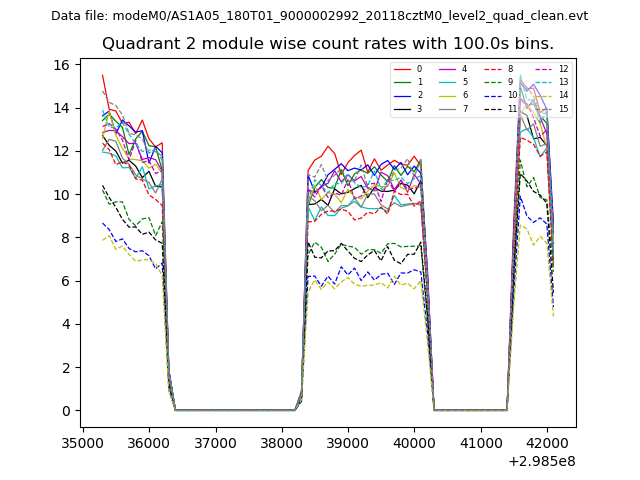
| Module-wise count rates for Quadrant B Data is divided into 100 sec bins |
 |
 |
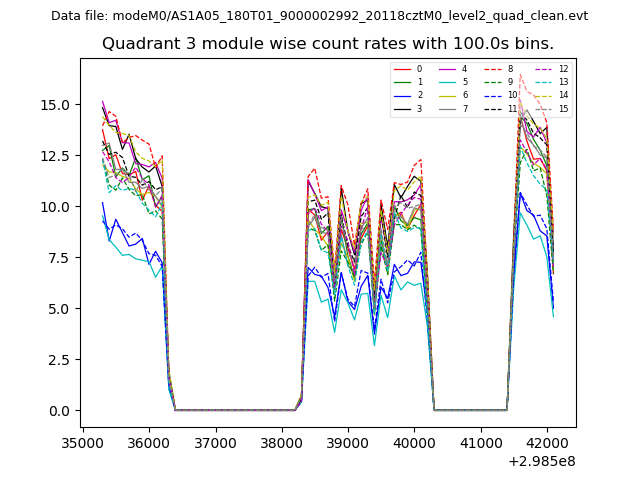
| Module-wise count rates for Quadrant C Data is divided into 100 sec bins |
 |
 |
| Module-wise count rates for Quadrant D Data is divided into 100 sec bins |
 |
 |
| Parameter | Plot |
|---|---|
| CZT HV Monitor | 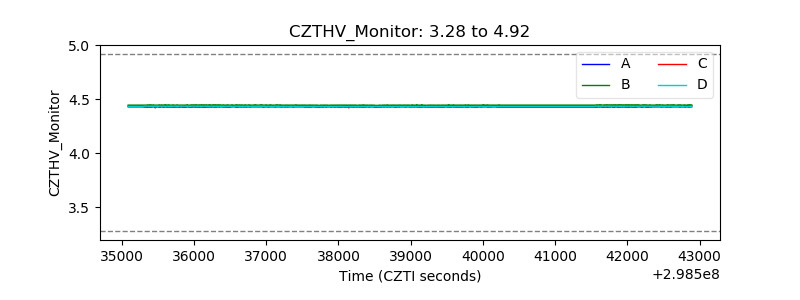 |
| D_VDD | 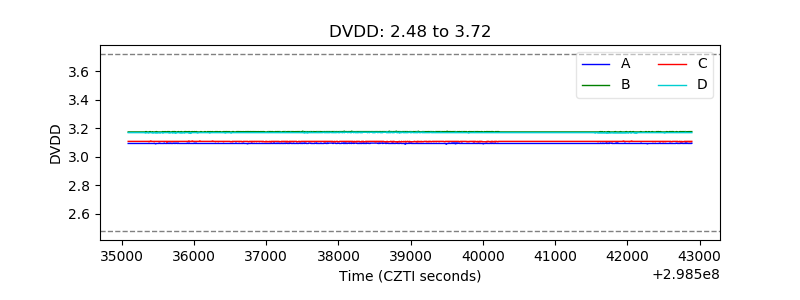 |
| Temperature 1 | 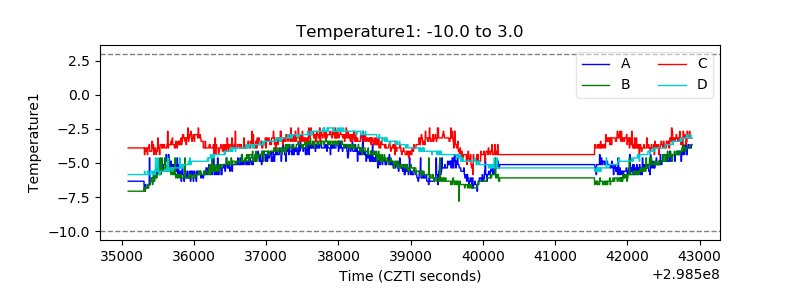 |
| Veto HV Monitor | 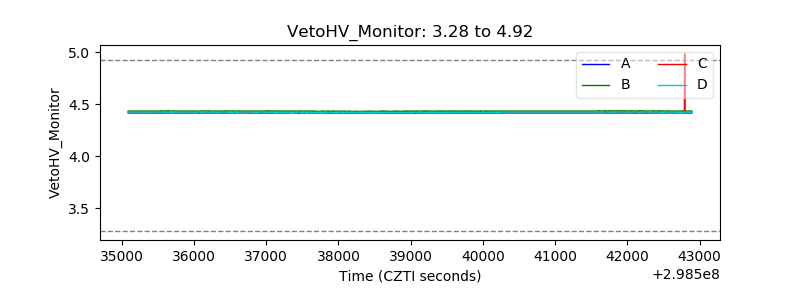 |
| Veto LLD | 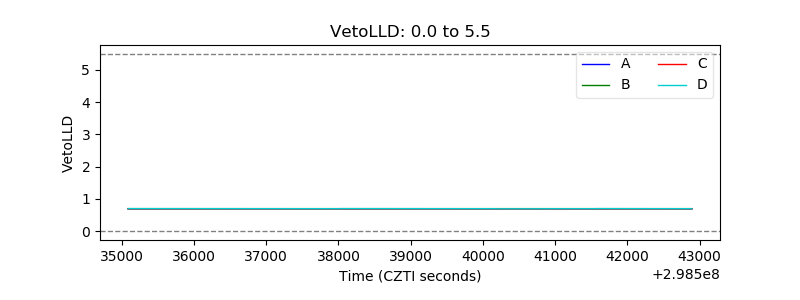 |
| Alpha Counter | 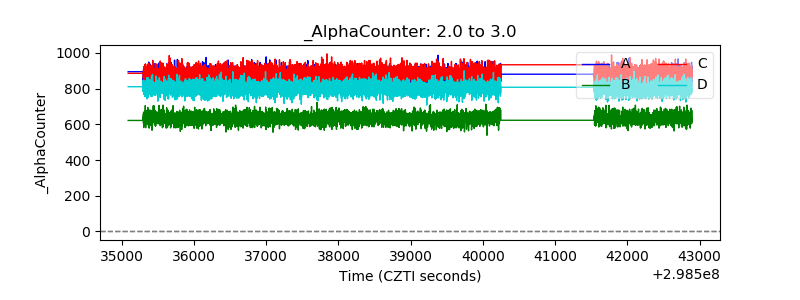 |
| _CPM_Rate | 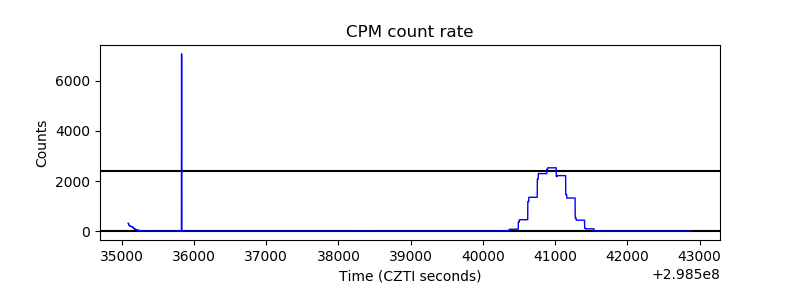 |
| CZT Counter |  |
| +2.5 Volts monitor |  |
| +5 Volts monitor |  |
| _ROLL_ROT | 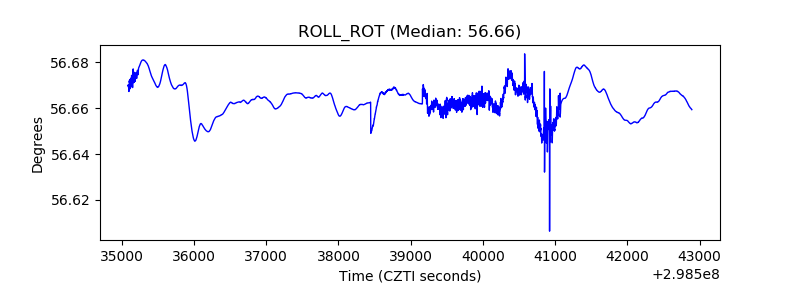 |
| _Roll_DEC | 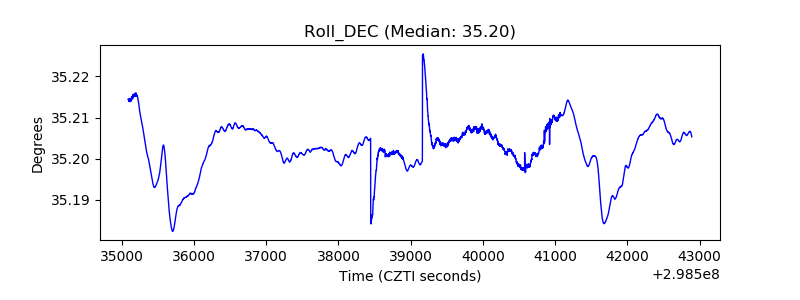 |
| _Roll_RA | 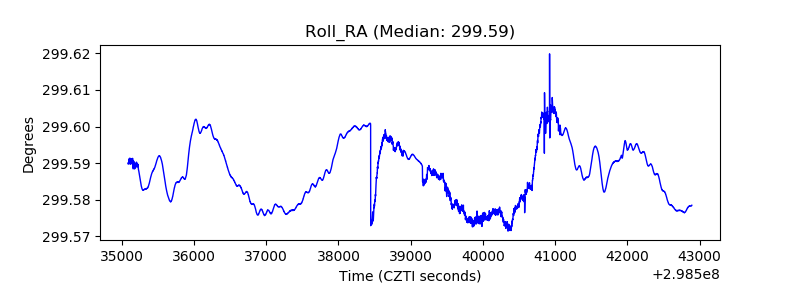 |
| Veto Counter | 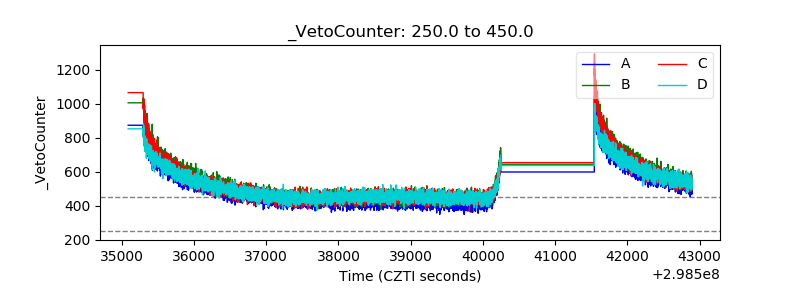 |