| Param | Original file | Final file |
|---|---|---|
| Filename | modeM0/AS1A05_180T01_9000002992_20123cztM0_level2.evt | modeM0/AS1A05_180T01_9000002992_20123cztM0_level2_quad_clean.evt |
| Size (bytes) | 3,116,687,040 | 459,420,480 |
| Size | 2.9 GB | 438.1 MB |
| Events in quadrant A | 24,552,552 | 2,855,565 |
| Events in quadrant B | 21,698,634 | 3,099,074 |
| Events in quadrant C | 18,110,229 | 2,960,131 |
| Events in quadrant D | 27,889,614 | 2,813,298 |
| Mode M9 | |||
|---|---|---|---|
| Quadrant | BADHDUFLAG | Total packets | Discarded packets |
| A | 0 | 67 | 0 |
| B | 0 | 67 | 0 |
| C | 0 | 67 | 0 |
| D | 0 | 67 | 0 |
| Mode M0 | |||
|---|---|---|---|
| Quadrant | BADHDUFLAG | Total packets | Discarded packets |
| A | 0 | 92022 | 6 |
| B | 0 | 84326 | 6 |
| C | 0 | 72117 | 6 |
| D | 0 | 104126 | 6 |
| Mode SS | |||
|---|---|---|---|
| Quadrant | BADHDUFLAG | Total packets | Discarded packets |
| A | 0 | 646 | 0 |
| B | 0 | 646 | 0 |
| C | 0 | 646 | 0 |
| D | 0 | 646 | 0 |
| Quadrant | Total seconds | Saturated seconds | Saturation percentage |
|---|---|---|---|
| A | 31808 | 3905 | 12.276786% |
| B | 31809 | 1572 | 4.941998% |
| C | 31808 | 1026 | 3.225604% |
| D | 31808 | 3310 | 10.406187% |
Noise dominated data is calculated using 1-second bins in cleaned event files. If a bin has >2000 counts, and if more than 50% of those come from <1% of pixels, then it is considered to be noise-dominated and hence unusable.
| Quadrant | # 1 sec bins | Bins with >0 counts | Bins with >2000 counts | High rate bins dominated by noise | Noise dominated (total time) | Noise dominated (detector-on time) | Marked lightcurve |
|---|---|---|---|---|---|---|---|
| A | 38358 | 31815 | 2251 | 2251 | 5.87% | 7.08% | 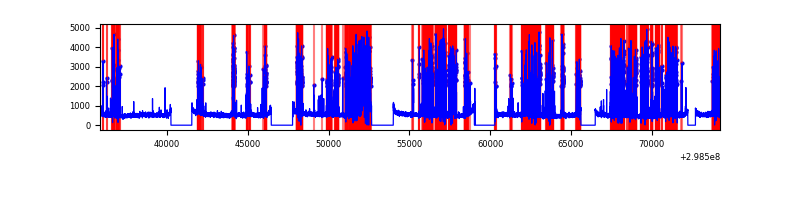 |
| B | 38359 | 31816 | 604 | 604 | 1.57% | 1.90% | 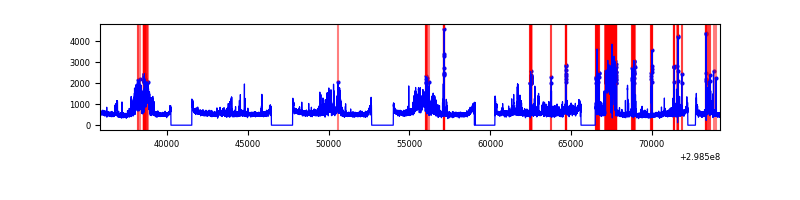 |
| C | 38358 | 31815 | 183 | 183 | 0.48% | 0.58% | 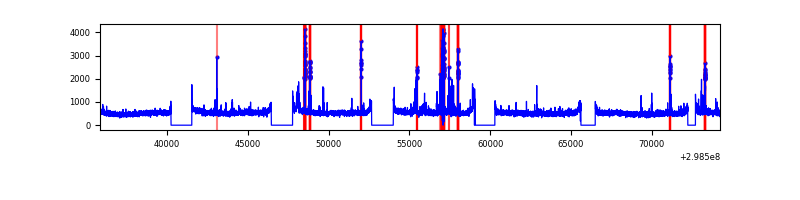 |
| D | 38358 | 31813 | 2142 | 2142 | 5.58% | 6.73% |  |
Top three noisy pixels from each quadrant. If the there are fewer than three noisy pixels in the level2.evt file, extra rows are filled as -1
| Pixel properties | Quadrant properties | ||||||
|---|---|---|---|---|---|---|---|
| Quadrant | DetID | PixID | Counts | Sigma | Mean | Median | Sigma |
| A | 14 | 238 | 8260195 | 10222.55 | 4091 | 4031 | 807.6 |
| A | 14 | 237 | 221538 | 269.31 | 4091 | 4031 | 807.6 |
| A | 15 | 192 | 213868 | 259.81 | 4091 | 4031 | 807.6 |
| B | 10 | 245 | 4619177 | 5851.99 | 4231 | 4140 | 788.6 |
| B | 4 | 80 | 142117 | 174.96 | 4231 | 4140 | 788.6 |
| B | 4 | 251 | 134063 | 164.75 | 4231 | 4140 | 788.6 |
| C | 3 | 233 | 1533637 | 1643.07 | 4076 | 4121 | 930.9 |
| C | 14 | 238 | 649795 | 693.61 | 4076 | 4121 | 930.9 |
| C | 0 | 207 | 41380 | 40.02 | 4076 | 4121 | 930.9 |
| D | 1 | 52 | 9234645 | 9522.68 | 4037 | 3937 | 969.3 |
| D | 7 | 238 | 2442127 | 2515.31 | 4037 | 3937 | 969.3 |
| D | 11 | 176 | 365140 | 372.63 | 4037 | 3937 | 969.3 |
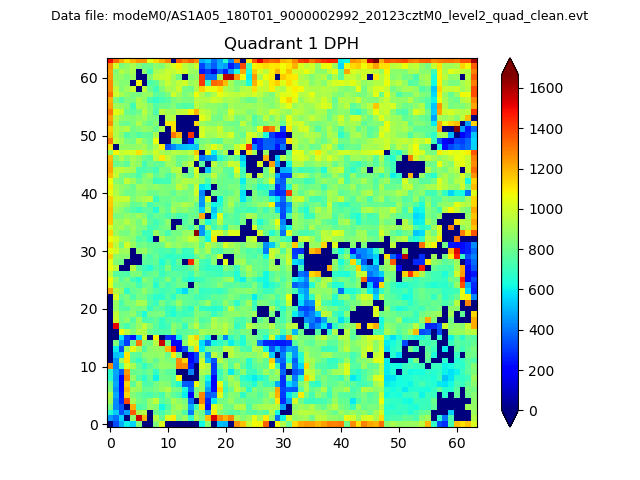
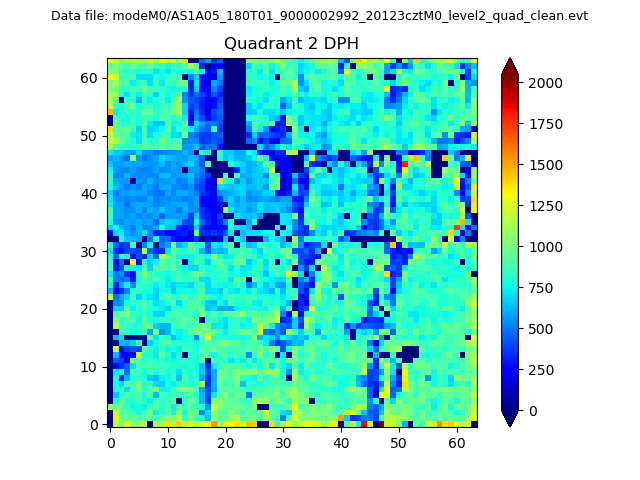
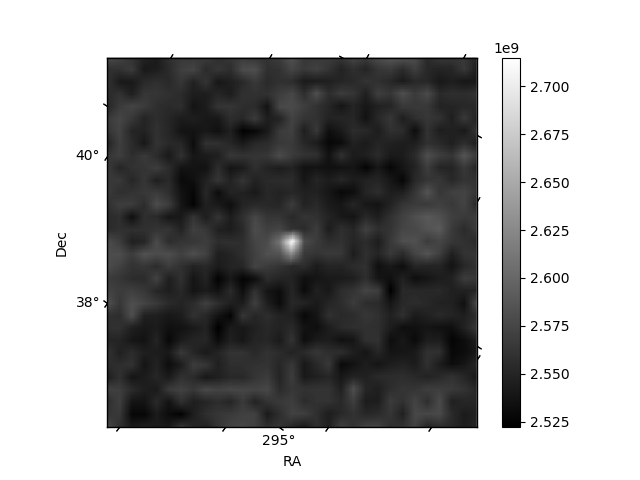
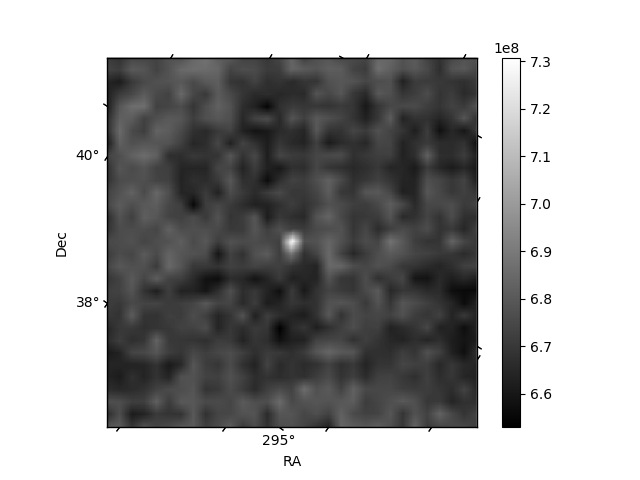
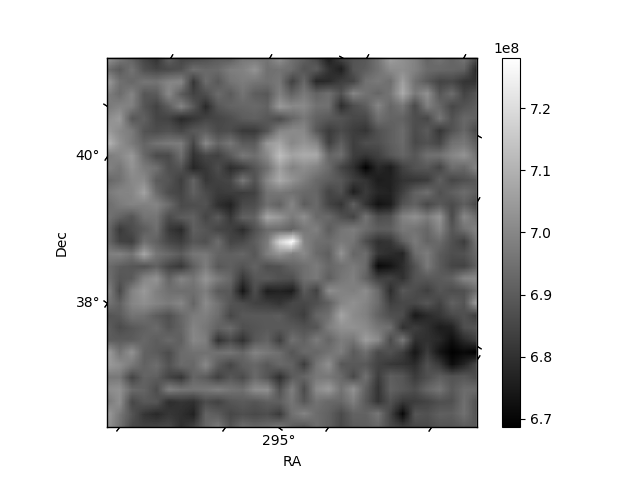
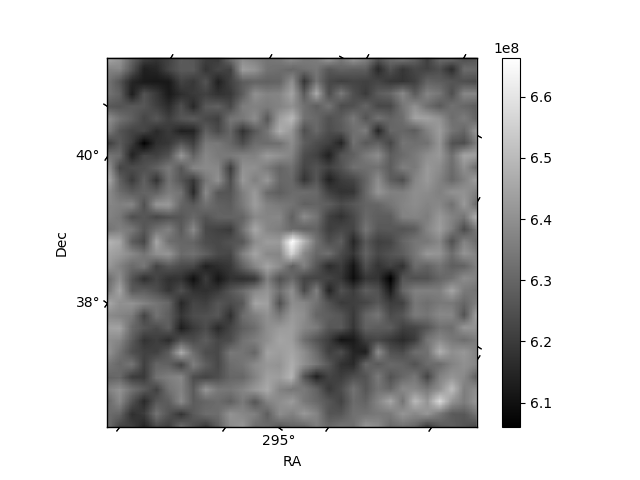
Histogram calculated using DETX and DETY for each event in the final _common_clean file
| Quadrant A | 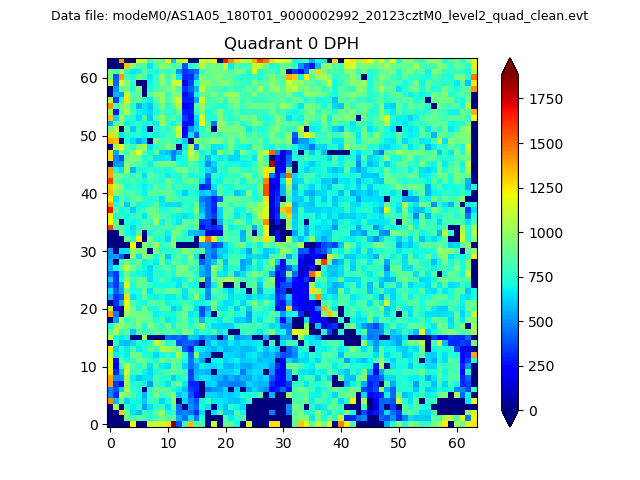 |
 |
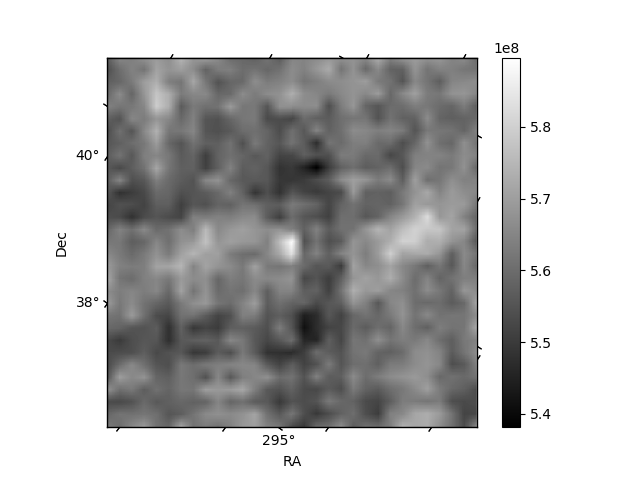
Quadrant B |
|---|---|---|---|
| Quadrant D | 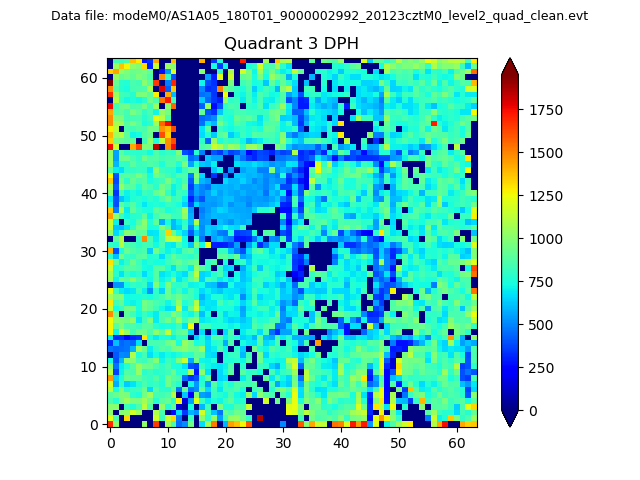 |
 |
Quadrant C |
| Plot type | Count rate plots | Images |
|---|---|---|
| Comparison with Poisson distribution Blue bars denote a histogram of data divided into 1 sec bins. Red curve is a Poisson curve with rate = median count rate of data. |
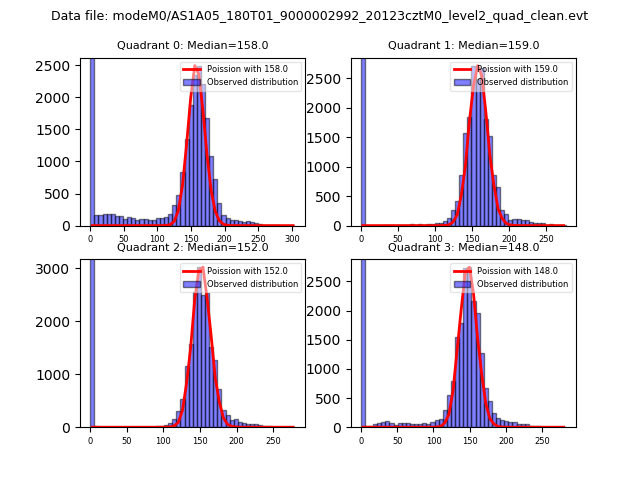 |
 |
| Quadrant-wise count rates Data is divided into 100 sec bins |
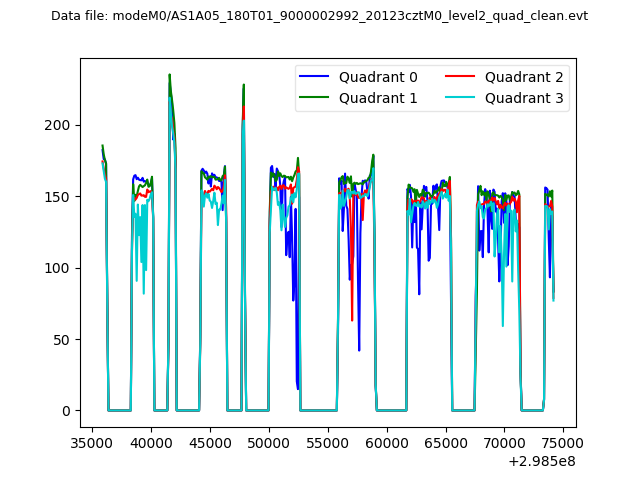 |
|
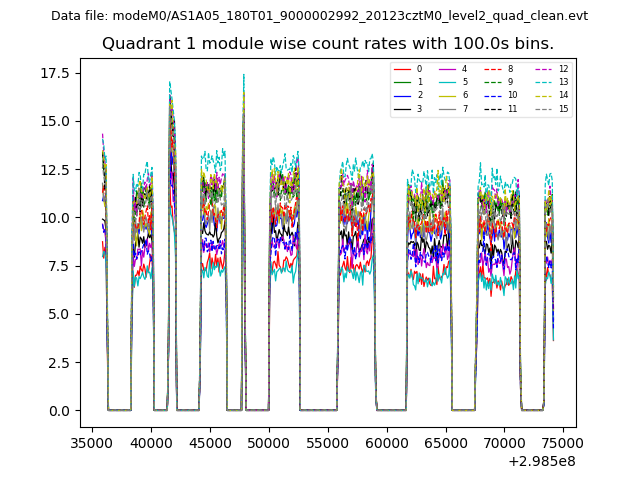
| Module-wise count rates for Quadrant A Data is divided into 100 sec bins |
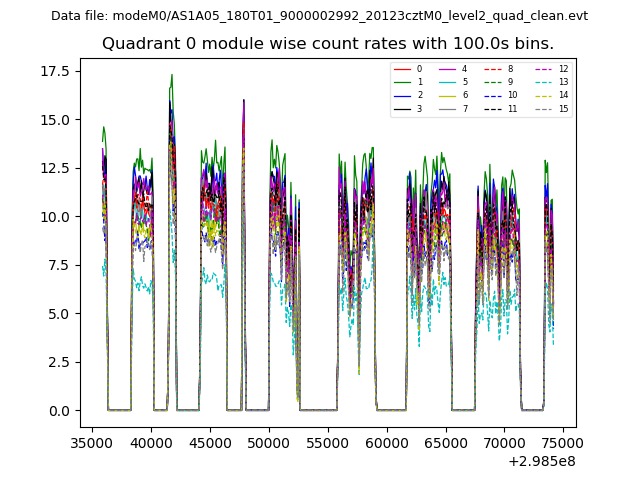 |
 |
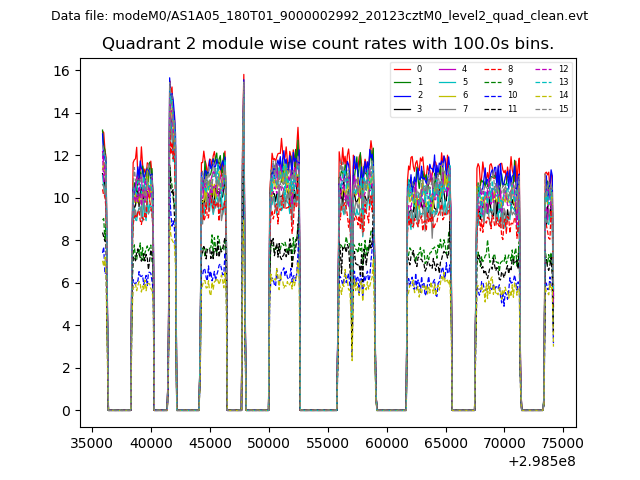
| Module-wise count rates for Quadrant B Data is divided into 100 sec bins |
 |
 |
| Module-wise count rates for Quadrant C Data is divided into 100 sec bins |
 |
 |
| Module-wise count rates for Quadrant D Data is divided into 100 sec bins |
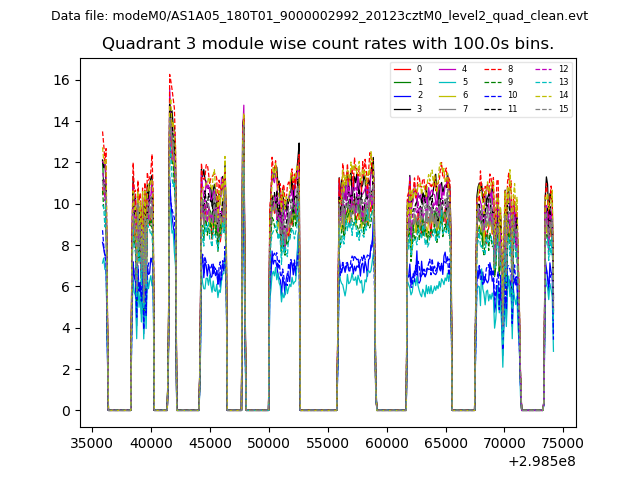 |
 |
| Parameter | Plot |
|---|---|
| CZT HV Monitor | 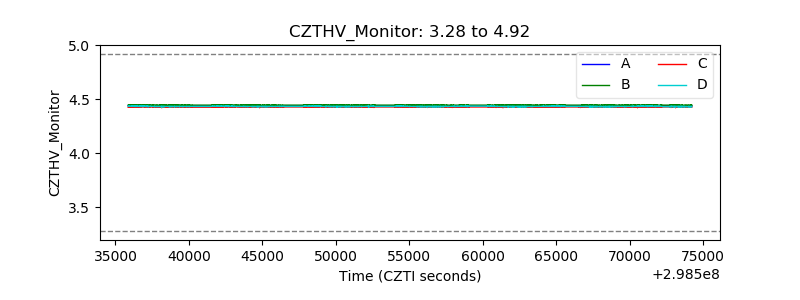 |
| D_VDD | 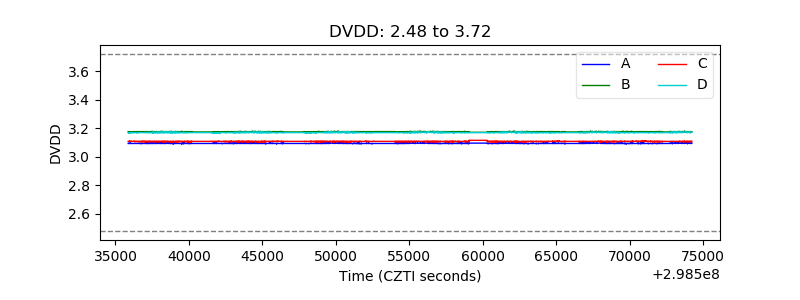 |
| Temperature 1 | 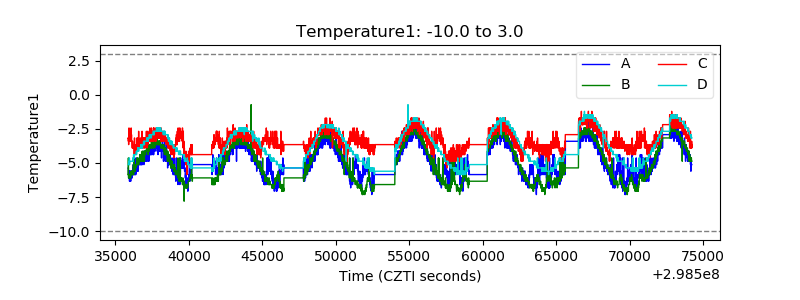 |
| Veto HV Monitor | 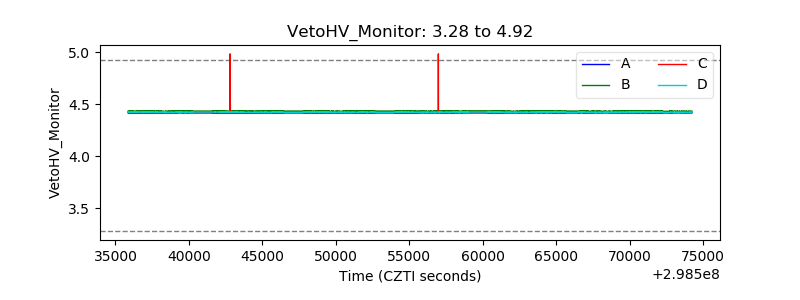 |
| Veto LLD | 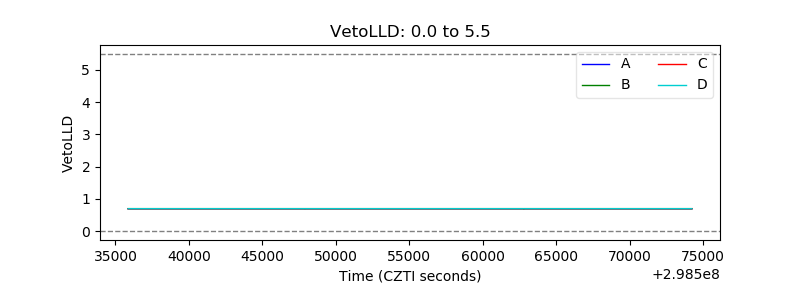 |
| Alpha Counter | 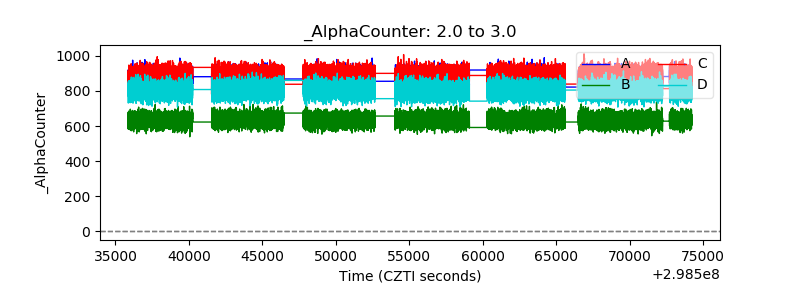 |
| _CPM_Rate | 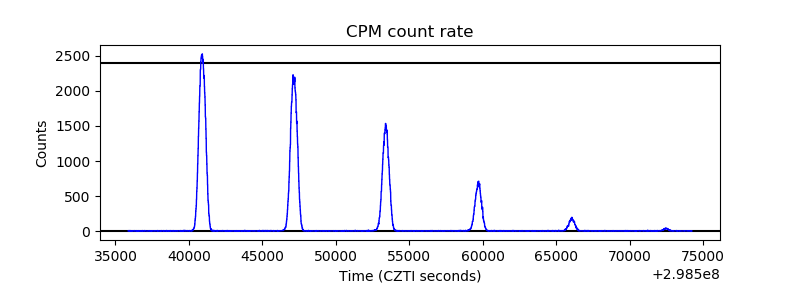 |
| CZT Counter | 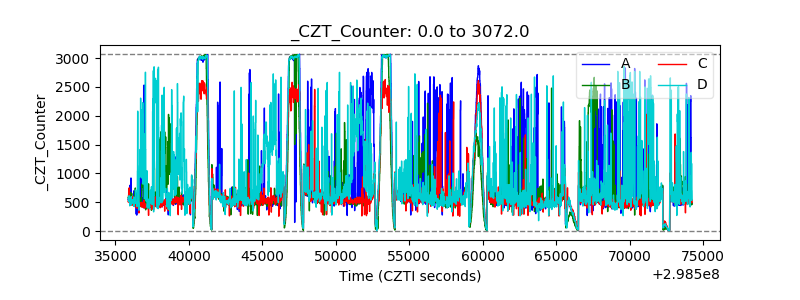 |
| +2.5 Volts monitor |  |
| +5 Volts monitor |  |
| _ROLL_ROT | 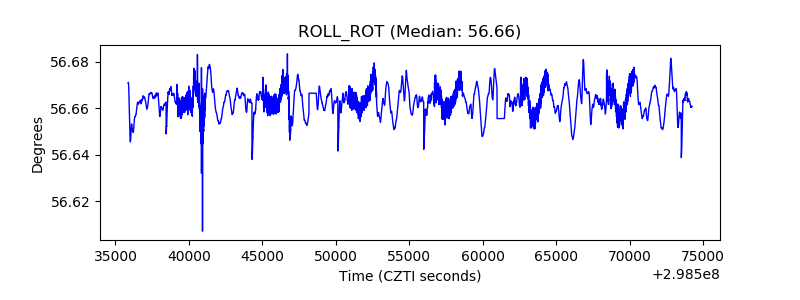 |
| _Roll_DEC | 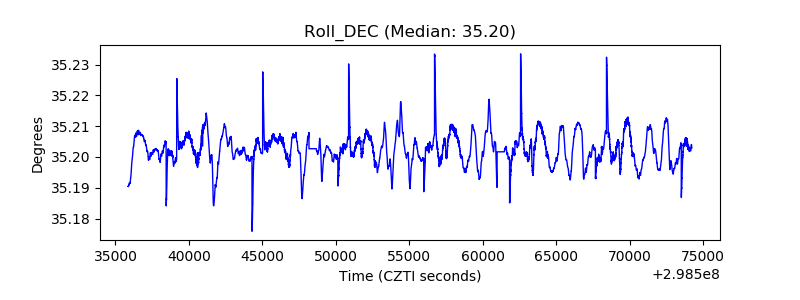 |
| _Roll_RA | 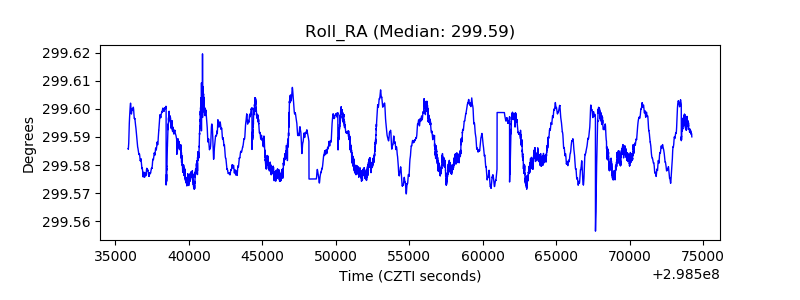 |
| Veto Counter | 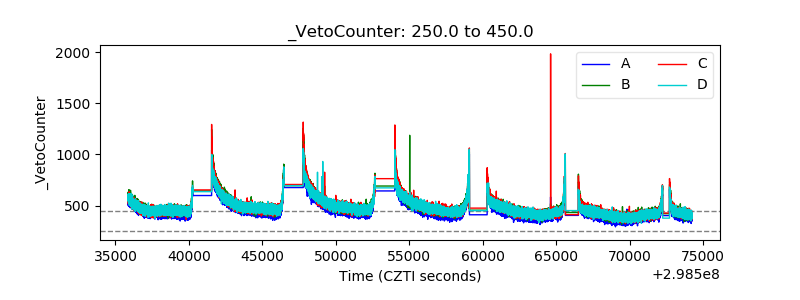 |