| Param | Original file | Final file |
|---|---|---|
| Filename | modeM0/AS1A05_180T01_9000002992_20125cztM0_level2.evt | modeM0/AS1A05_180T01_9000002992_20125cztM0_level2_quad_clean.evt |
| Size (bytes) | 711,956,160 | 112,164,480 |
| Size | 679.0 MB | 107.0 MB |
| Events in quadrant A | 5,908,380 | 681,547 |
| Events in quadrant B | 4,176,405 | 759,391 |
| Events in quadrant C | 4,380,076 | 725,937 |
| Events in quadrant D | 6,579,727 | 697,975 |
| Mode M9 | |||
|---|---|---|---|
| Quadrant | BADHDUFLAG | Total packets | Discarded packets |
| A | 0 | 7 | 0 |
| B | 0 | 7 | 0 |
| C | 0 | 7 | 0 |
| D | 0 | 7 | 0 |
| Mode M0 | |||
|---|---|---|---|
| Quadrant | BADHDUFLAG | Total packets | Discarded packets |
| A | 0 | 22406 | 2 |
| B | 0 | 17153 | 2 |
| C | 0 | 17875 | 3 |
| D | 0 | 24756 | 2 |
| Mode SS | |||
|---|---|---|---|
| Quadrant | BADHDUFLAG | Total packets | Discarded packets |
| A | 0 | 156 | 0 |
| B | 0 | 156 | 0 |
| C | 0 | 156 | 0 |
| D | 0 | 156 | 0 |
| Quadrant | Total seconds | Saturated seconds | Saturation percentage |
|---|---|---|---|
| A | 7645 | 976 | 12.766514% |
| B | 7646 | 123 | 1.608684% |
| C | 7645 | 284 | 3.714846% |
| D | 7645 | 628 | 8.214519% |
Noise dominated data is calculated using 1-second bins in cleaned event files. If a bin has >2000 counts, and if more than 50% of those come from <1% of pixels, then it is considered to be noise-dominated and hence unusable.
| Quadrant | # 1 sec bins | Bins with >0 counts | Bins with >2000 counts | High rate bins dominated by noise | Noise dominated (total time) | Noise dominated (detector-on time) | Marked lightcurve |
|---|---|---|---|---|---|---|---|
| A | 8290 | 7647 | 564 | 564 | 6.80% | 7.38% | 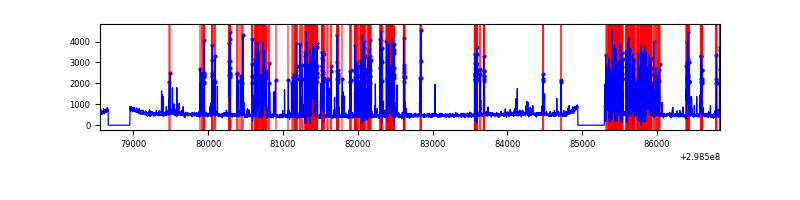 |
| B | 8291 | 7648 | 31 | 31 | 0.37% | 0.41% | 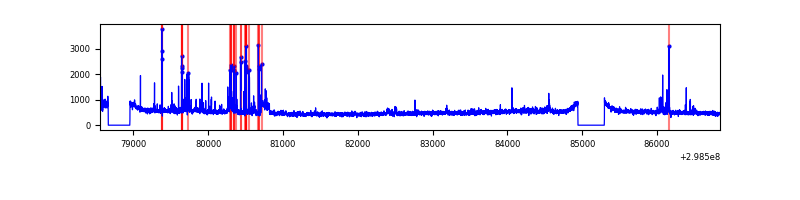 |
| C | 8290 | 7647 | 47 | 47 | 0.57% | 0.61% |  |
| D | 8290 | 7647 | 498 | 498 | 6.01% | 6.51% | 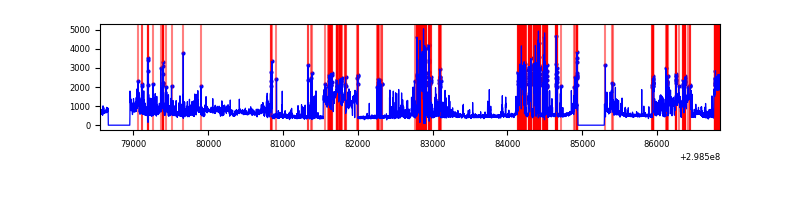 |
Top three noisy pixels from each quadrant. If the there are fewer than three noisy pixels in the level2.evt file, extra rows are filled as -1
| Pixel properties | Quadrant properties | ||||||
|---|---|---|---|---|---|---|---|
| Quadrant | DetID | PixID | Counts | Sigma | Mean | Median | Sigma |
| A | 14 | 238 | 2239701 | 12227.04 | 899 | 882 | 183.1 |
| A | 14 | 237 | 126325 | 685.09 | 899 | 882 | 183.1 |
| A | 14 | 254 | 82184 | 444.02 | 899 | 882 | 183.1 |
| B | 10 | 245 | 219442 | 1186.16 | 960 | 937 | 184.2 |
| B | 0 | 197 | 56871 | 303.64 | 960 | 937 | 184.2 |
| B | 4 | 80 | 40259 | 213.46 | 960 | 937 | 184.2 |
| C | 3 | 233 | 638187 | 2947.77 | 920 | 927 | 216.2 |
| C | 14 | 238 | 143919 | 661.44 | 920 | 927 | 216.2 |
| C | 0 | 207 | 10425 | 43.93 | 920 | 927 | 216.2 |
| D | 1 | 52 | 2194307 | 9852.14 | 910 | 885 | 222.6 |
| D | 14 | 34 | 683571 | 3066.4 | 910 | 885 | 222.6 |
| D | 11 | 176 | 148538 | 663.21 | 910 | 885 | 222.6 |
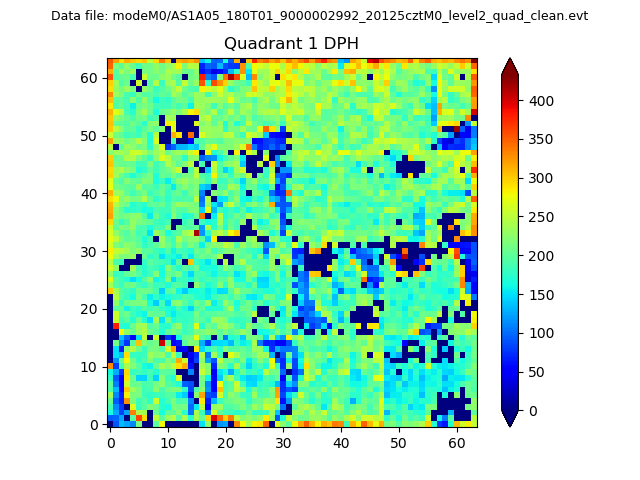
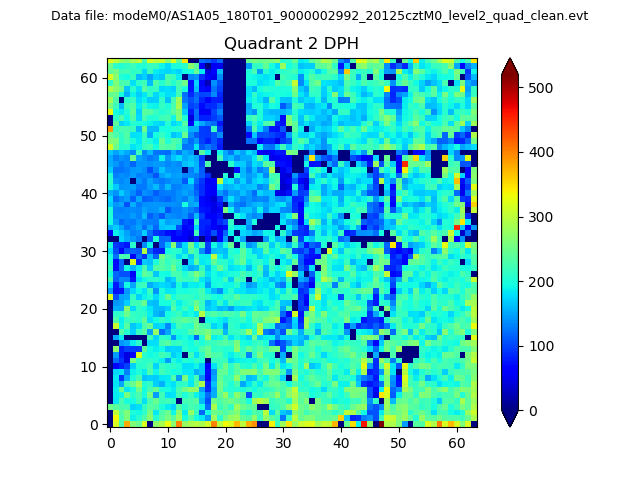
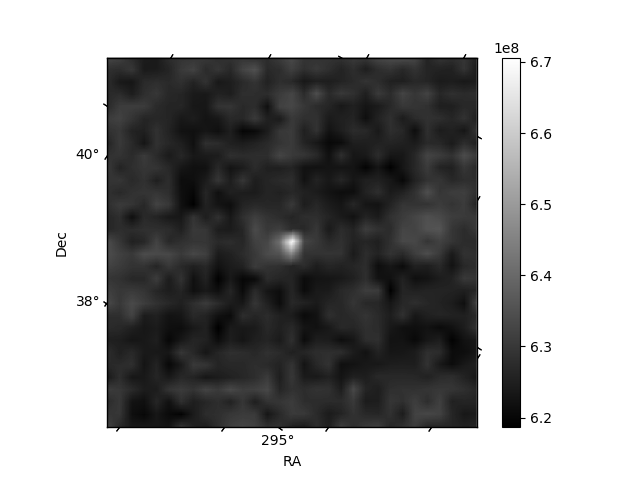
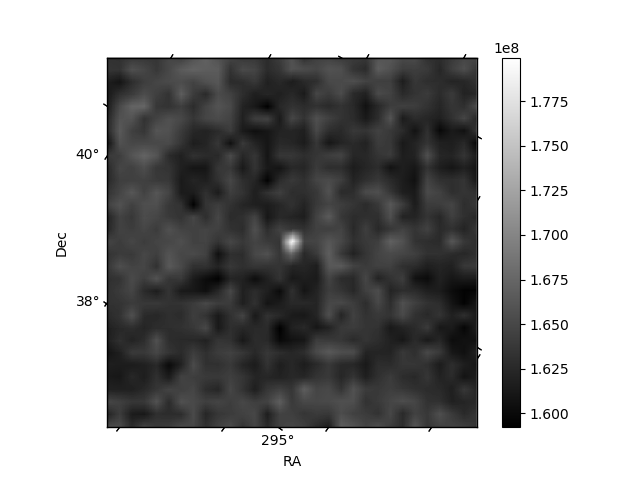
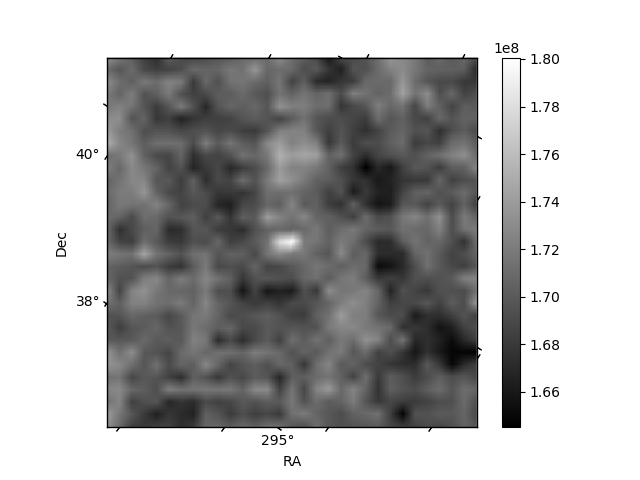
Histogram calculated using DETX and DETY for each event in the final _common_clean file
| Quadrant A | 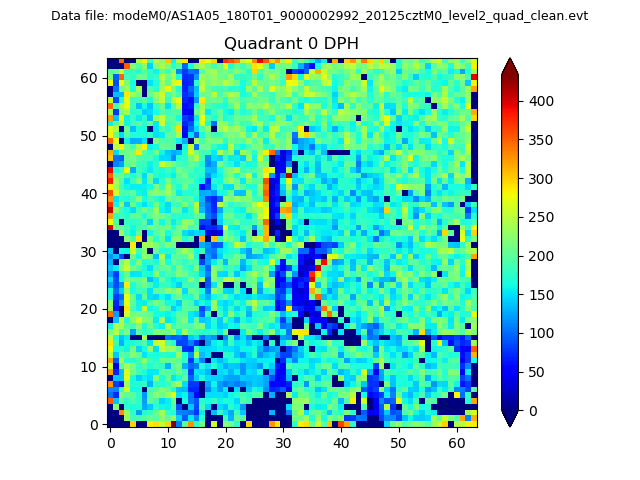 |
 |
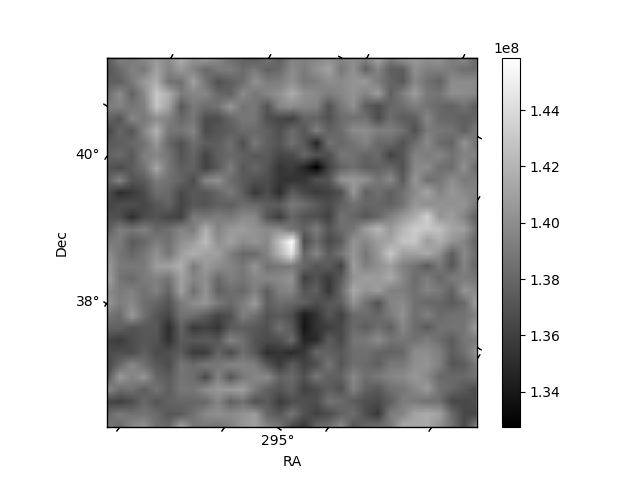
Quadrant B |
|---|---|---|---|
| Quadrant D | 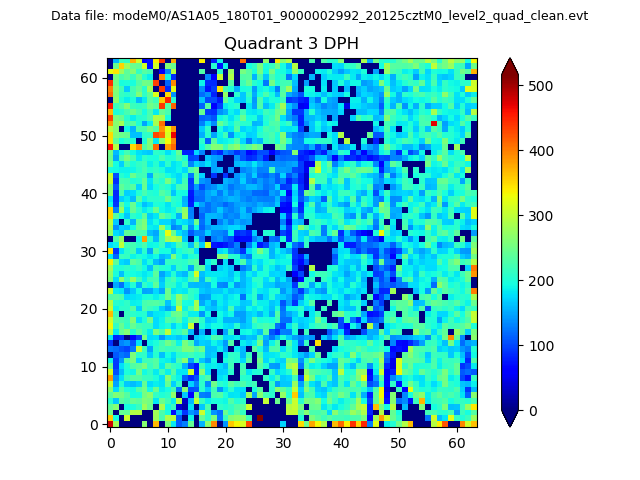 |
 |
Quadrant C |
| Plot type | Count rate plots | Images |
|---|---|---|
| Comparison with Poisson distribution Blue bars denote a histogram of data divided into 1 sec bins. Red curve is a Poisson curve with rate = median count rate of data. |
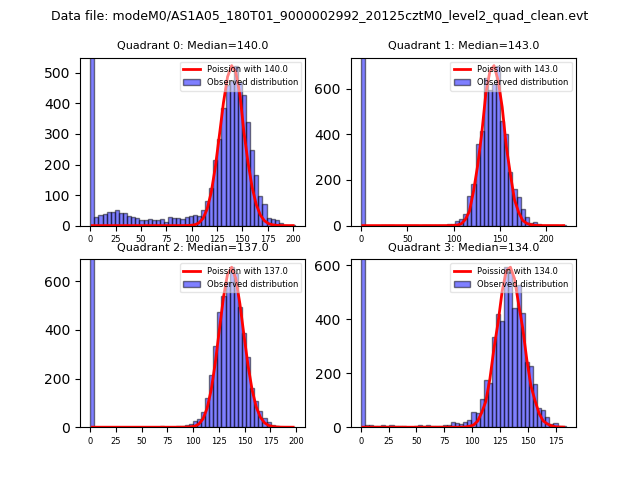 |
 |
| Quadrant-wise count rates Data is divided into 100 sec bins |
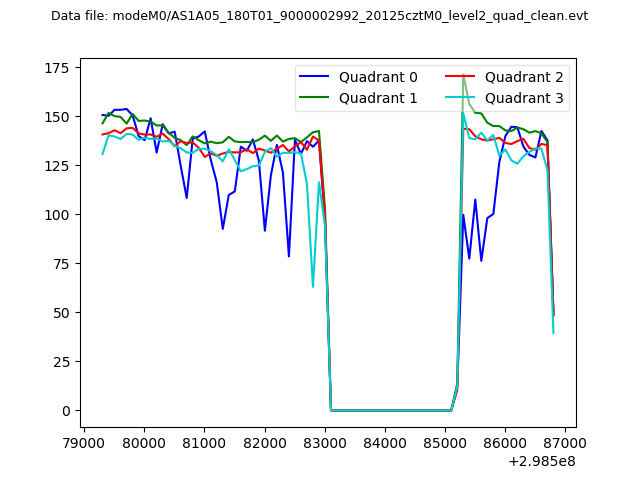 |
|
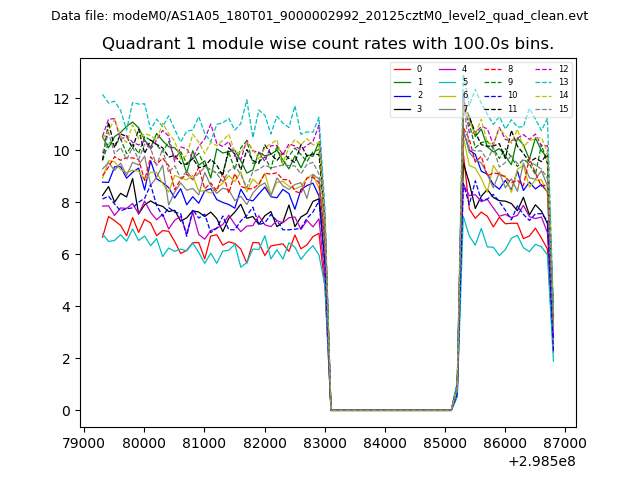
| Module-wise count rates for Quadrant A Data is divided into 100 sec bins |
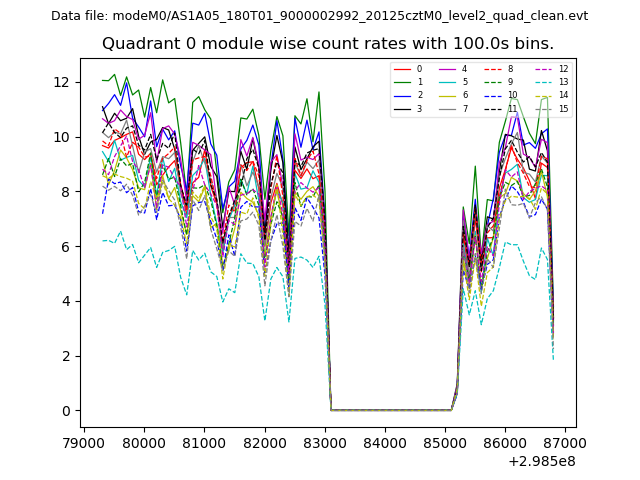 |
 |
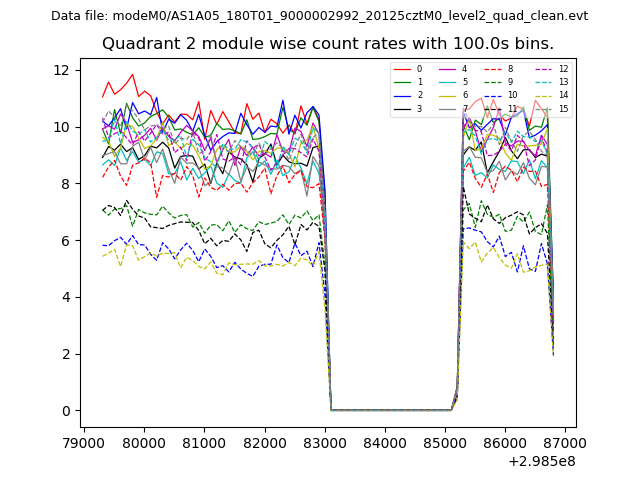
| Module-wise count rates for Quadrant B Data is divided into 100 sec bins |
 |
 |
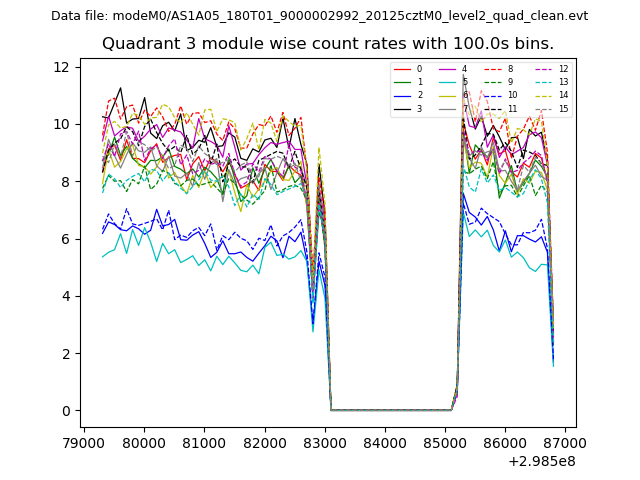
| Module-wise count rates for Quadrant C Data is divided into 100 sec bins |
 |
 |
| Module-wise count rates for Quadrant D Data is divided into 100 sec bins |
 |
 |
| Parameter | Plot |
|---|---|
| CZT HV Monitor | 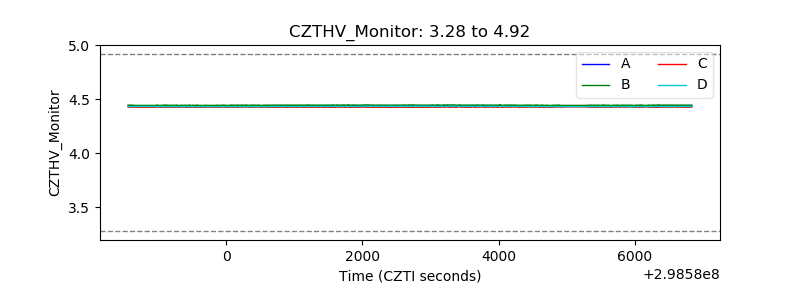 |
| D_VDD | 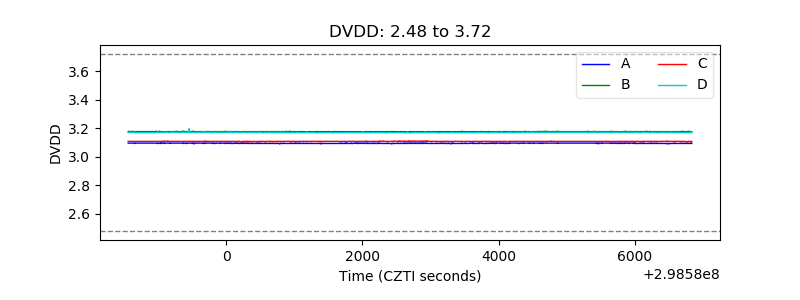 |
| Temperature 1 | 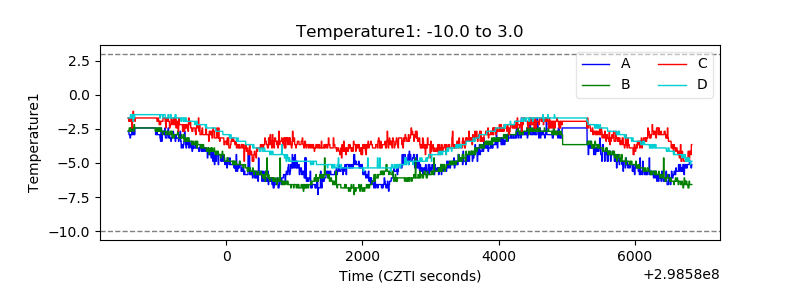 |
| Veto HV Monitor | 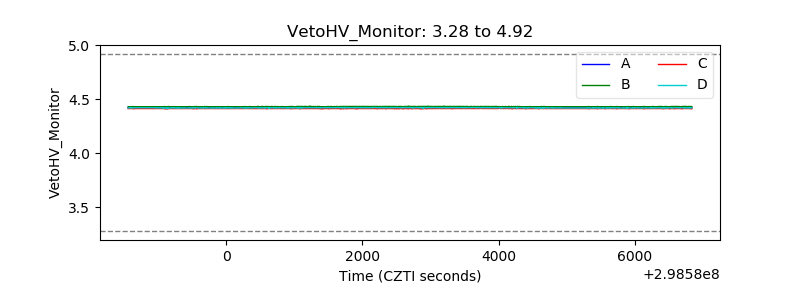 |
| Veto LLD | 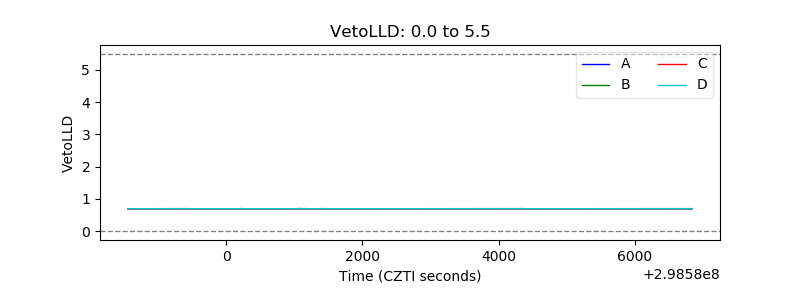 |
| Alpha Counter | 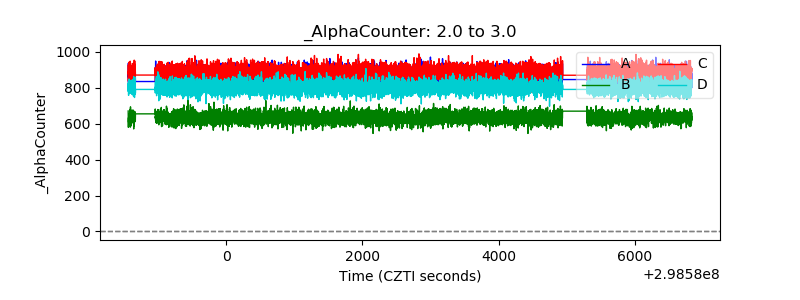 |
| _CPM_Rate | 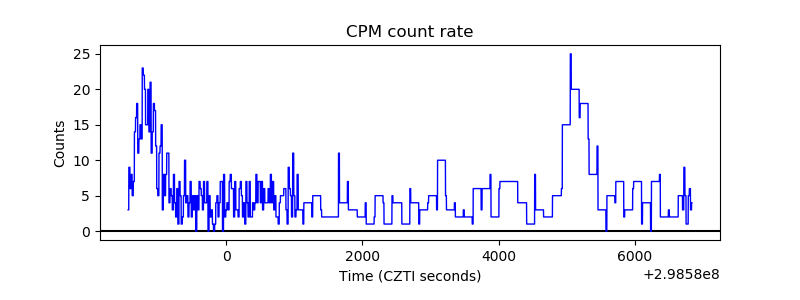 |
| CZT Counter | 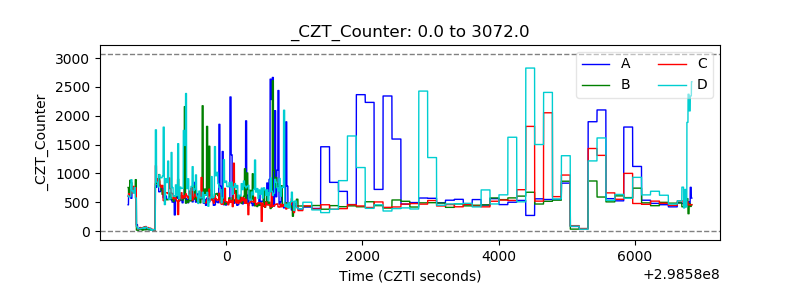 |
| +2.5 Volts monitor |  |
| +5 Volts monitor |  |
| _ROLL_ROT | 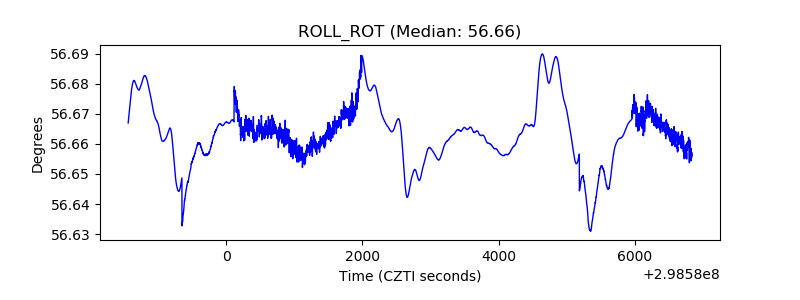 |
| _Roll_DEC | 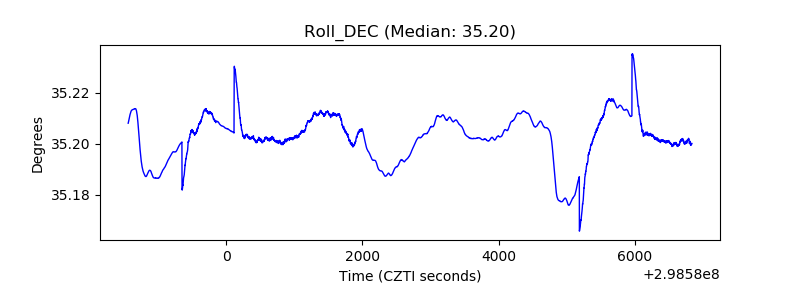 |
| _Roll_RA | 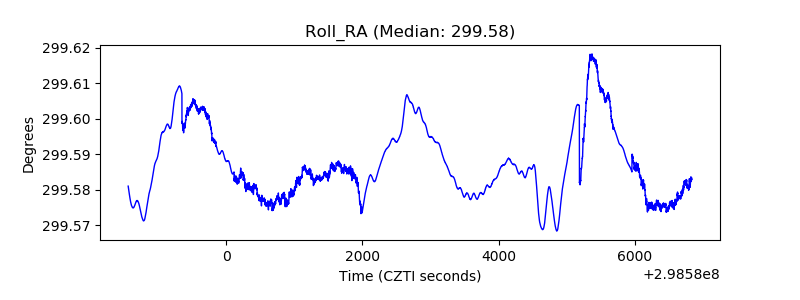 |
| Veto Counter | 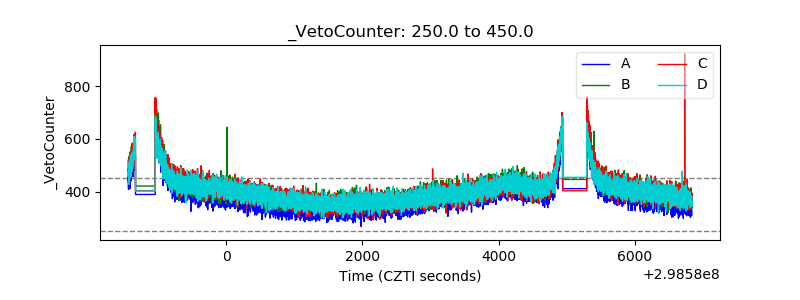 |