| Param | Original file | Final file |
|---|---|---|
| Filename | modeM0/AS1A05_180T01_9000002992_20127cztM0_level2.evt | modeM0/AS1A05_180T01_9000002992_20127cztM0_level2_quad_clean.evt |
| Size (bytes) | 1,296,434,880 | 183,058,560 |
| Size | 1.2 GB | 174.6 MB |
| Events in quadrant A | 13,118,527 | 1,021,368 |
| Events in quadrant B | 6,410,356 | 1,259,735 |
| Events in quadrant C | 6,948,582 | 1,205,841 |
| Events in quadrant D | 11,903,927 | 1,153,539 |
| Mode M9 | |||
|---|---|---|---|
| Quadrant | BADHDUFLAG | Total packets | Discarded packets |
| A | 0 | 12 | 0 |
| B | 0 | 13 | 0 |
| C | 0 | 13 | 0 |
| D | 0 | 13 | 0 |
| Mode M0 | |||
|---|---|---|---|
| Quadrant | BADHDUFLAG | Total packets | Discarded packets |
| A | 0 | 47639 | 3 |
| B | 0 | 27549 | 3 |
| C | 0 | 28834 | 3 |
| D | 0 | 44275 | 3 |
| Mode SS | |||
|---|---|---|---|
| Quadrant | BADHDUFLAG | Total packets | Discarded packets |
| A | 0 | 264 | 0 |
| B | 0 | 264 | 0 |
| C | 0 | 264 | 0 |
| D | 0 | 264 | 0 |
| Quadrant | Total seconds | Saturated seconds | Saturation percentage |
|---|---|---|---|
| A | 13067 | 3242 | 24.810592% |
| B | 13067 | 113 | 0.864774% |
| C | 13067 | 243 | 1.859646% |
| D | 13067 | 1465 | 11.211449% |
Noise dominated data is calculated using 1-second bins in cleaned event files. If a bin has >2000 counts, and if more than 50% of those come from <1% of pixels, then it is considered to be noise-dominated and hence unusable.
| Quadrant | # 1 sec bins | Bins with >0 counts | Bins with >2000 counts | High rate bins dominated by noise | Noise dominated (total time) | Noise dominated (detector-on time) | Marked lightcurve |
|---|---|---|---|---|---|---|---|
| A | 14227 | 13068 | 1911 | 1911 | 13.43% | 14.62% | 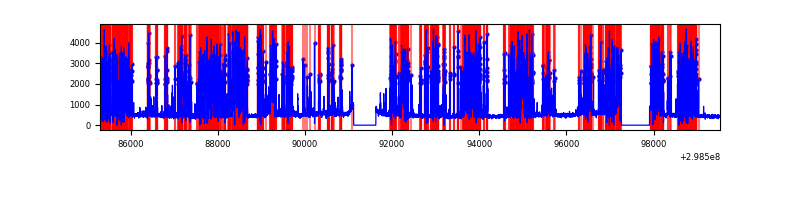 |
| B | 14227 | 13069 | 10 | 10 | 0.07% | 0.08% | 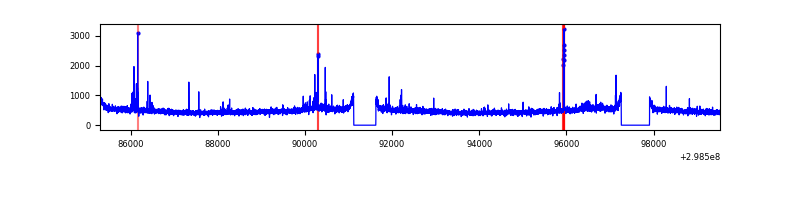 |
| C | 14227 | 13069 | 4 | 4 | 0.03% | 0.03% | 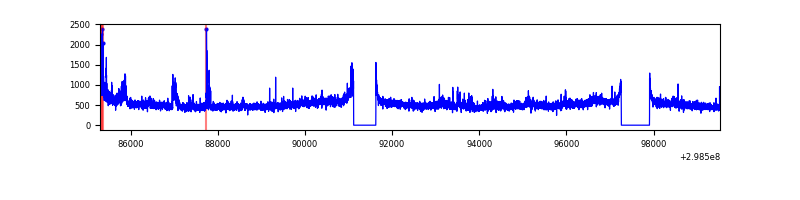 |
| D | 14227 | 13069 | 1546 | 1546 | 10.87% | 11.83% | 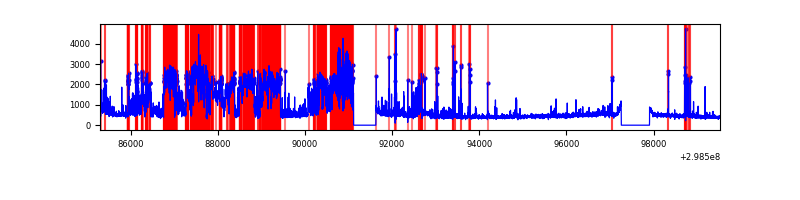 |
Top three noisy pixels from each quadrant. If the there are fewer than three noisy pixels in the level2.evt file, extra rows are filled as -1
| Pixel properties | Quadrant properties | ||||||
|---|---|---|---|---|---|---|---|
| Quadrant | DetID | PixID | Counts | Sigma | Mean | Median | Sigma |
| A | 14 | 238 | 7358645 | 26925.49 | 1356 | 1335 | 273.2 |
| A | 14 | 254 | 292189 | 1064.44 | 1356 | 1335 | 273.2 |
| A | 14 | 237 | 219234 | 797.44 | 1356 | 1335 | 273.2 |
| B | 0 | 183 | 69011 | 222.35 | 1591 | 1552 | 303.4 |
| B | 12 | 111 | 36942 | 116.65 | 1591 | 1552 | 303.4 |
| B | 10 | 245 | 35055 | 110.43 | 1591 | 1552 | 303.4 |
| C | 3 | 233 | 712370 | 1995.18 | 1531 | 1547 | 356.3 |
| C | 14 | 238 | 240976 | 672.04 | 1531 | 1547 | 356.3 |
| C | 8 | 208 | 20586 | 53.44 | 1531 | 1547 | 356.3 |
| D | 1 | 52 | 6027645 | 16421.6 | 1510 | 1468 | 367.0 |
| D | 14 | 34 | 61134 | 162.59 | 1510 | 1468 | 367.0 |
| D | 2 | 234 | 57342 | 152.26 | 1510 | 1468 | 367.0 |
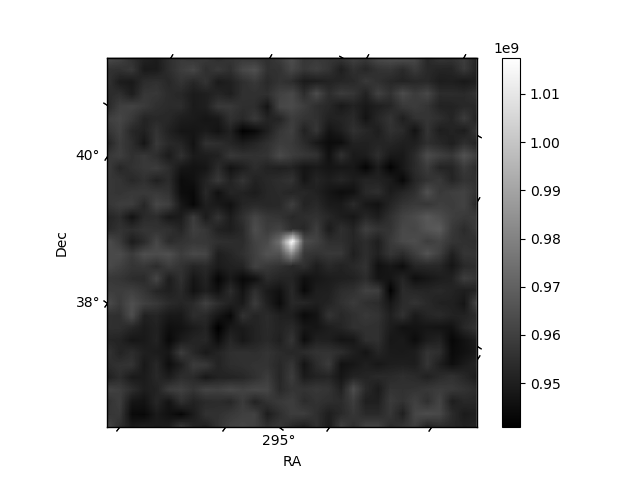
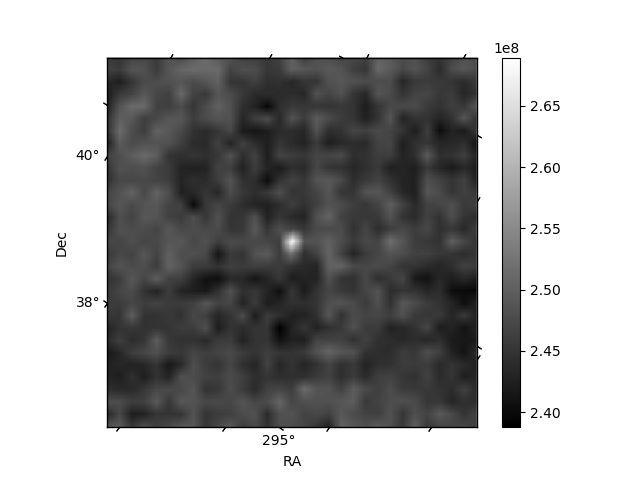
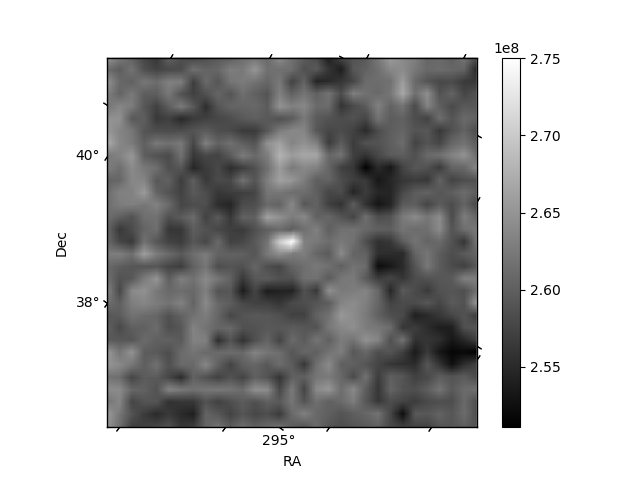
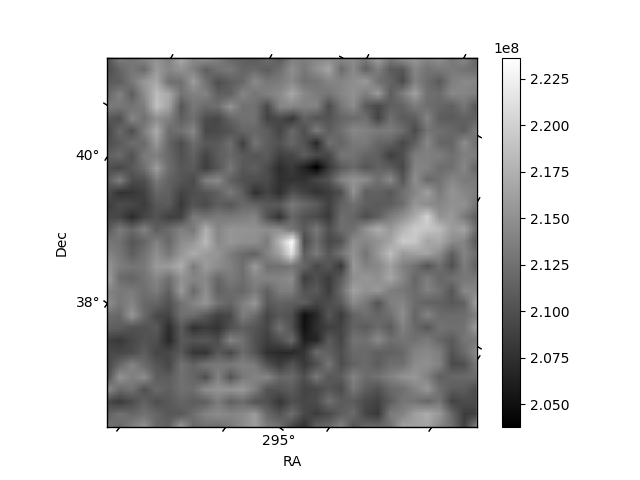
Histogram calculated using DETX and DETY for each event in the final _common_clean file
| Quadrant A | 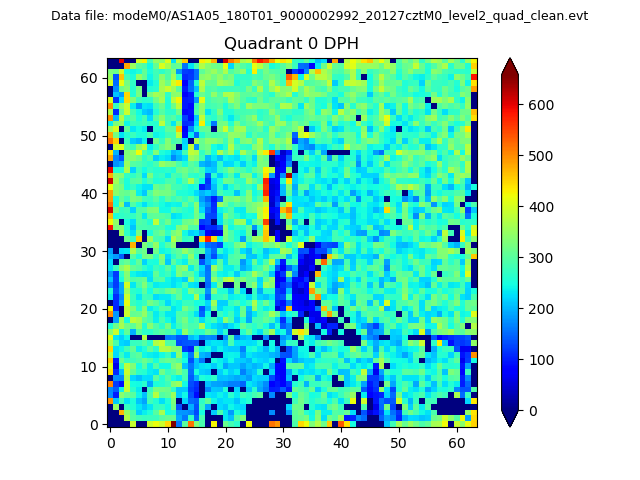 |
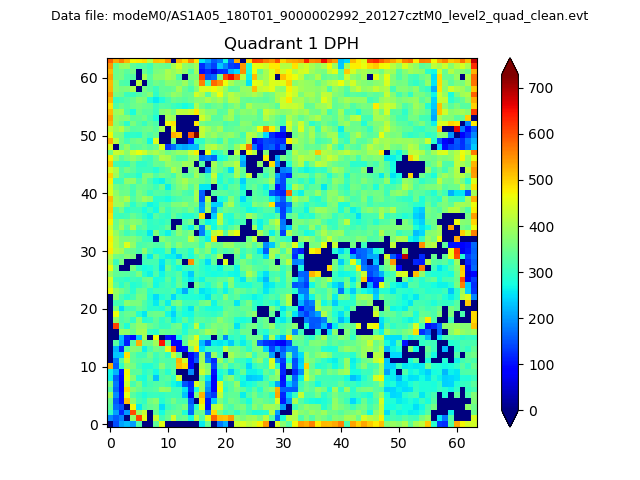 |
Quadrant B |
|---|---|---|---|
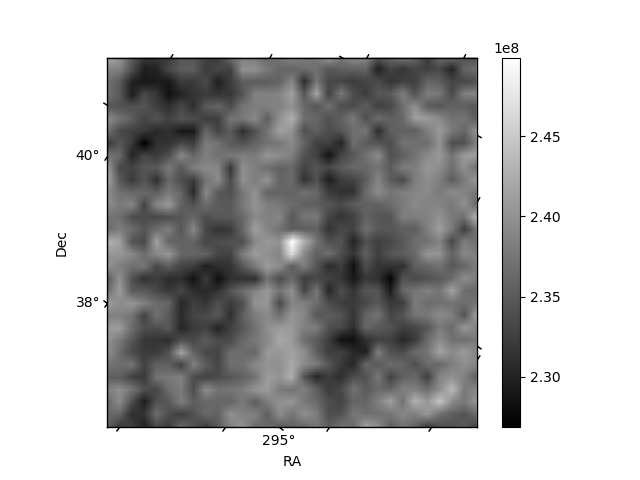
| Quadrant D | 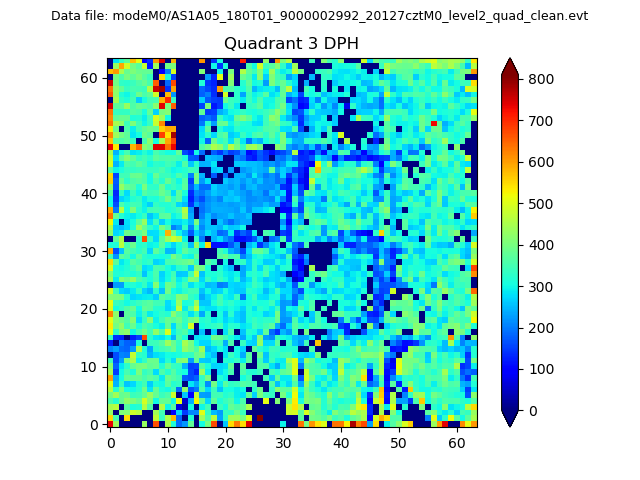 |
 |
Quadrant C |
| Plot type | Count rate plots | Images |
|---|---|---|
| Comparison with Poisson distribution Blue bars denote a histogram of data divided into 1 sec bins. Red curve is a Poisson curve with rate = median count rate of data. |
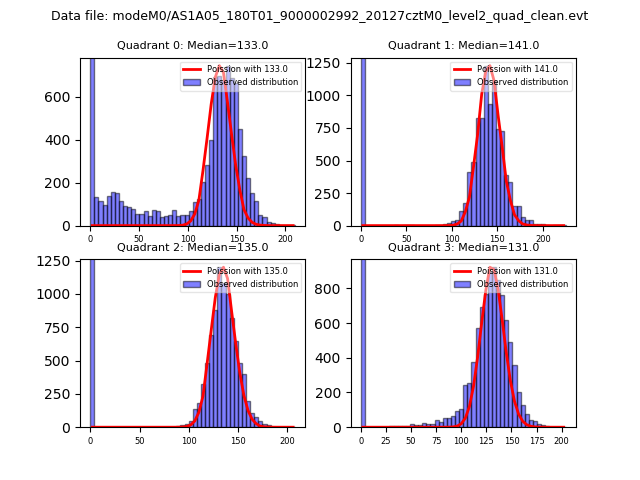 |
 |
| Quadrant-wise count rates Data is divided into 100 sec bins |
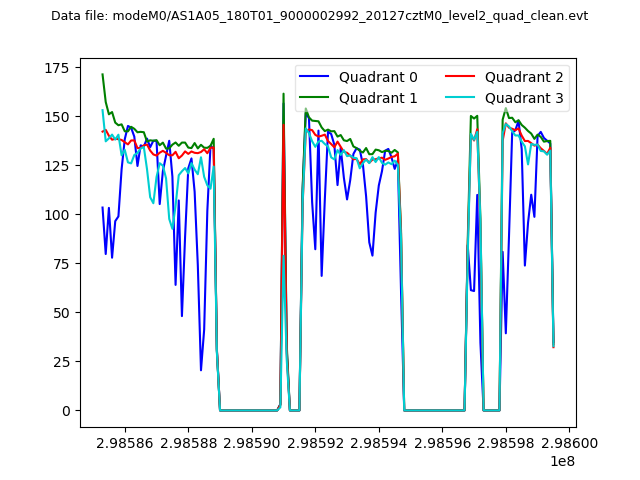 |
|
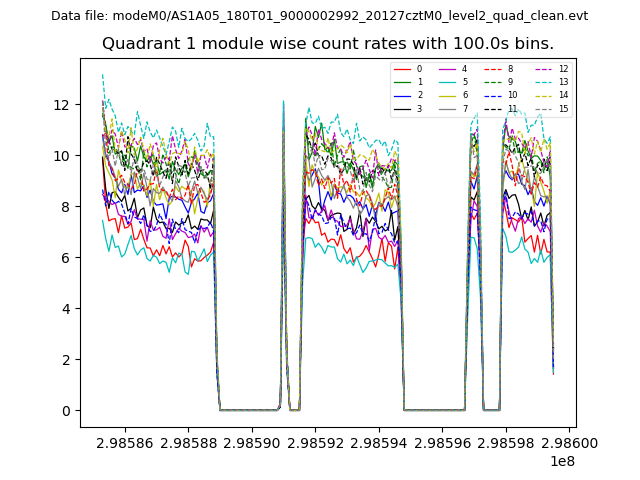
| Module-wise count rates for Quadrant A Data is divided into 100 sec bins |
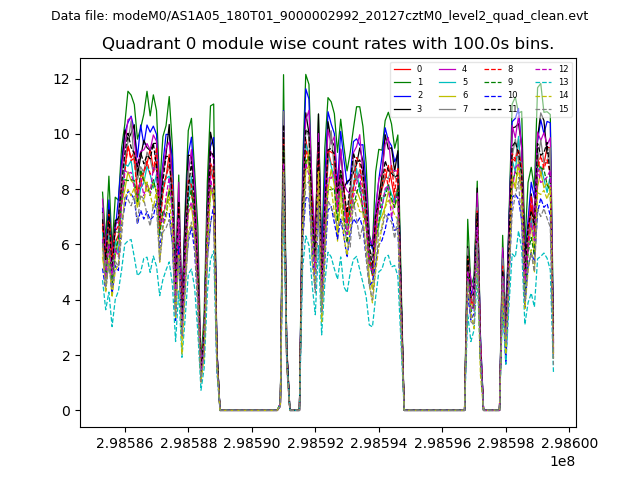 |
 |
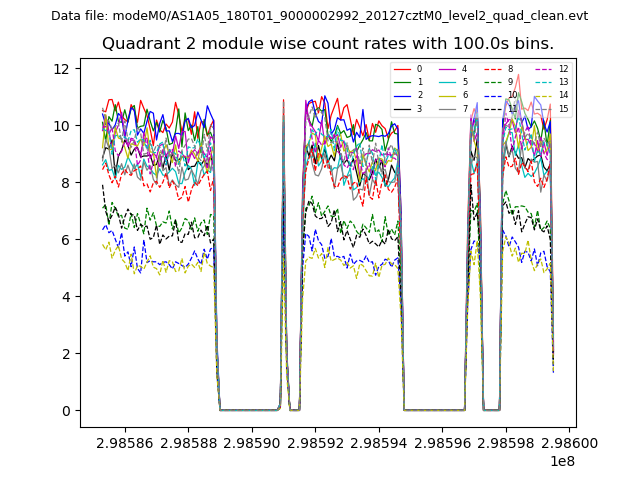
| Module-wise count rates for Quadrant B Data is divided into 100 sec bins |
 |
 |
| Module-wise count rates for Quadrant C Data is divided into 100 sec bins |
 |
 |
| Module-wise count rates for Quadrant D Data is divided into 100 sec bins |
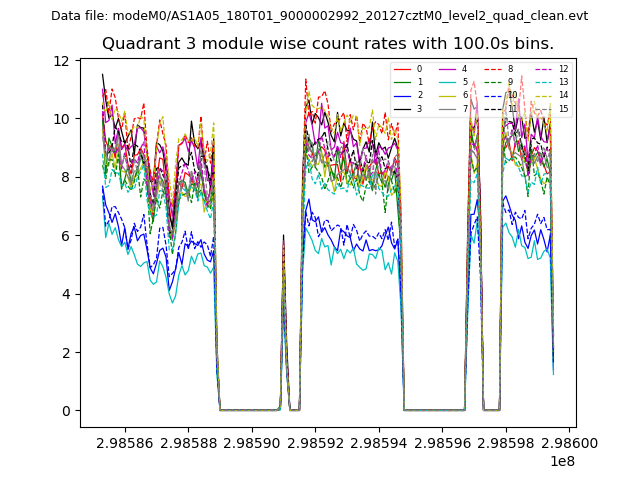 |
 |
| Parameter | Plot |
|---|---|
| CZT HV Monitor |  |
| D_VDD | 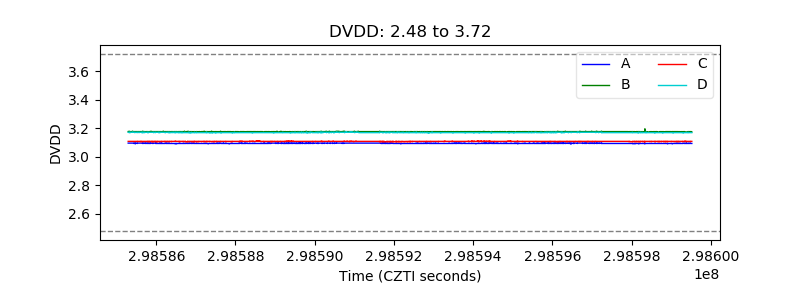 |
| Temperature 1 | 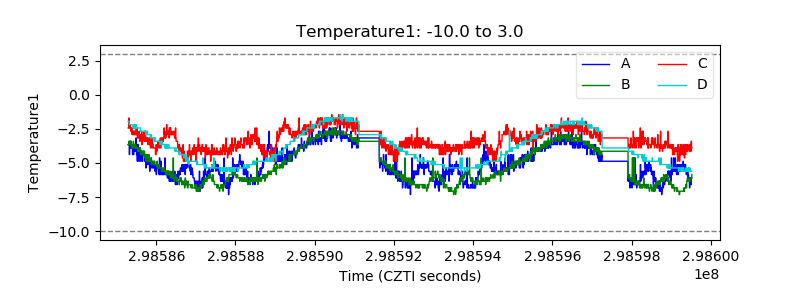 |
| Veto HV Monitor | 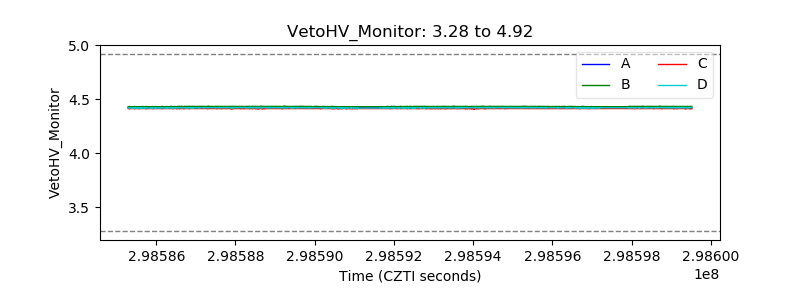 |
| Veto LLD | 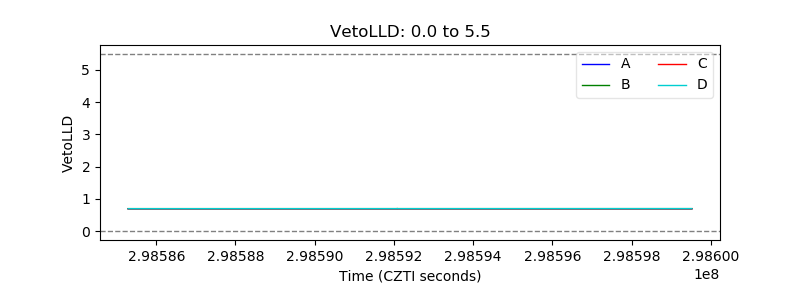 |
| Alpha Counter | 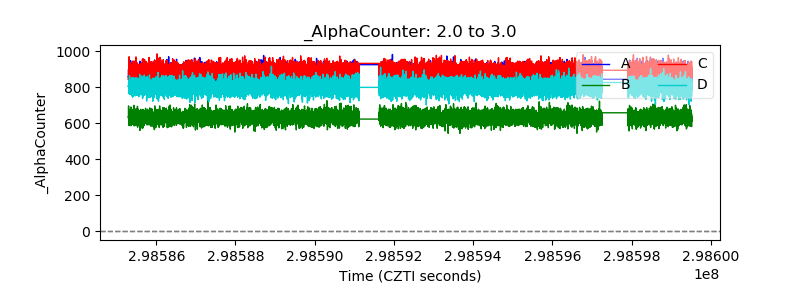 |
| _CPM_Rate | 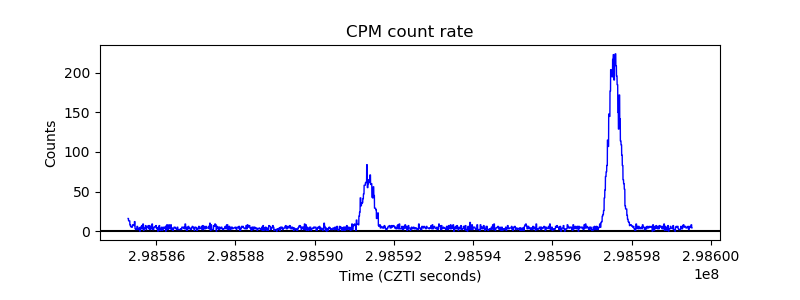 |
| CZT Counter | 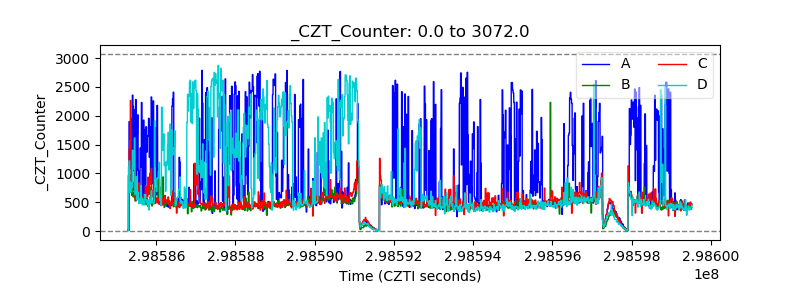 |
| +2.5 Volts monitor |  |
| +5 Volts monitor |  |
| _ROLL_ROT | 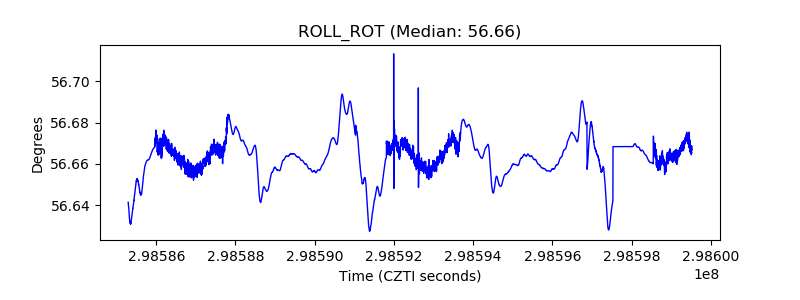 |
| _Roll_DEC | 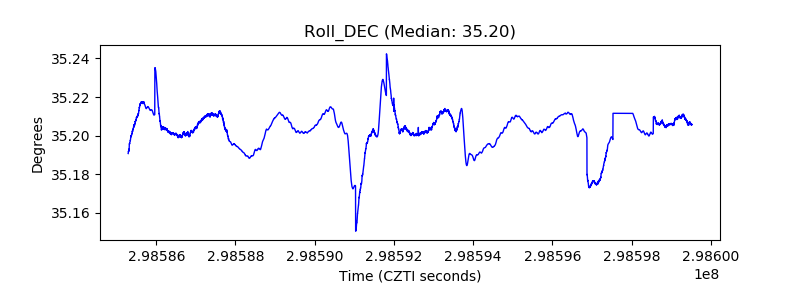 |
| _Roll_RA | 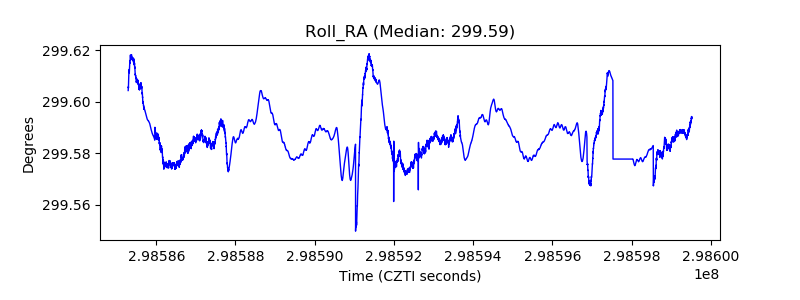 |
| Veto Counter | 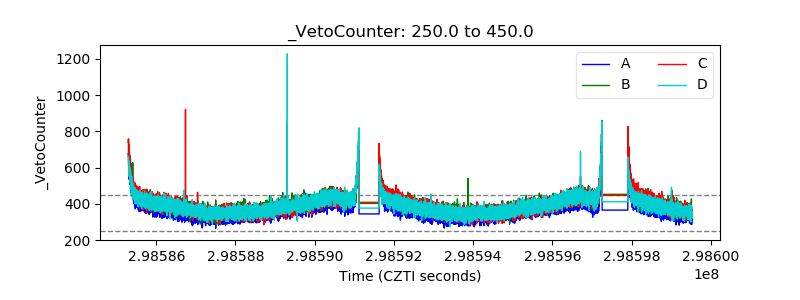 |