| Param | Original file | Final file |
|---|---|---|
| Filename | modeM0/AS1A05_180T01_9000002992_20128cztM0_level2.evt | modeM0/AS1A05_180T01_9000002992_20128cztM0_level2_quad_clean.evt |
| Size (bytes) | 2,777,512,320 | 414,244,800 |
| Size | 2.6 GB | 395.1 MB |
| Events in quadrant A | 26,917,147 | 2,442,752 |
| Events in quadrant B | 16,074,169 | 2,792,755 |
| Events in quadrant C | 16,046,548 | 2,687,842 |
| Events in quadrant D | 23,090,445 | 2,591,623 |
| Mode M9 | |||
|---|---|---|---|
| Quadrant | BADHDUFLAG | Total packets | Discarded packets |
| A | 0 | 28 | 0 |
| B | 0 | 28 | 0 |
| C | 0 | 28 | 0 |
| D | 0 | 28 | 0 |
| Mode M0 | |||
|---|---|---|---|
| Quadrant | BADHDUFLAG | Total packets | Discarded packets |
| A | 0 | 99308 | 5 |
| B | 0 | 66965 | 5 |
| C | 0 | 66187 | 5 |
| D | 0 | 88906 | 5 |
| Mode SS | |||
|---|---|---|---|
| Quadrant | BADHDUFLAG | Total packets | Discarded packets |
| A | 0 | 598 | 0 |
| B | 0 | 598 | 0 |
| C | 0 | 598 | 0 |
| D | 0 | 598 | 0 |
| Quadrant | Total seconds | Saturated seconds | Saturation percentage |
|---|---|---|---|
| A | 29545 | 5943 | 20.115079% |
| B | 29546 | 645 | 2.183037% |
| C | 29546 | 597 | 2.020578% |
| D | 29546 | 2121 | 7.178637% |
Noise dominated data is calculated using 1-second bins in cleaned event files. If a bin has >2000 counts, and if more than 50% of those come from <1% of pixels, then it is considered to be noise-dominated and hence unusable.
| Quadrant | # 1 sec bins | Bins with >0 counts | Bins with >2000 counts | High rate bins dominated by noise | Noise dominated (total time) | Noise dominated (detector-on time) | Marked lightcurve |
|---|---|---|---|---|---|---|---|
| A | 32200 | 29549 | 3579 | 3579 | 11.11% | 12.11% | 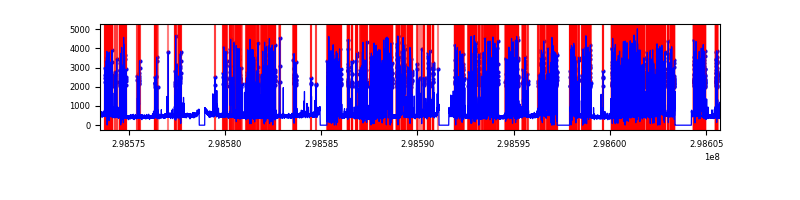 |
| B | 32201 | 29551 | 333 | 333 | 1.03% | 1.13% | 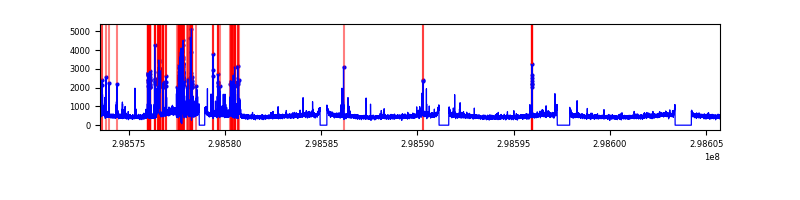 |
| C | 32201 | 29551 | 94 | 94 | 0.29% | 0.32% | 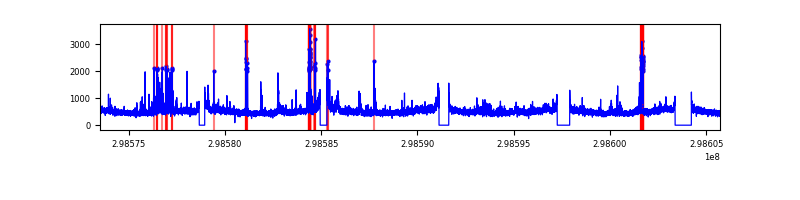 |
| D | 32201 | 29551 | 2053 | 2053 | 6.38% | 6.95% | 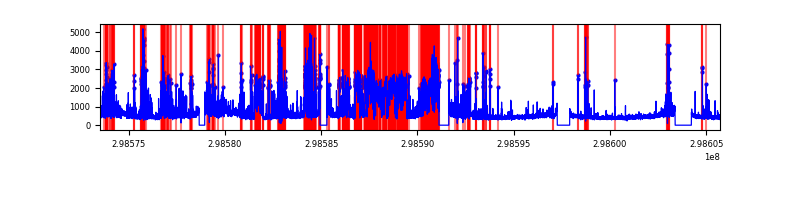 |
Top three noisy pixels from each quadrant. If the there are fewer than three noisy pixels in the level2.evt file, extra rows are filled as -1
| Pixel properties | Quadrant properties | ||||||
|---|---|---|---|---|---|---|---|
| Quadrant | DetID | PixID | Counts | Sigma | Mean | Median | Sigma |
| A | 14 | 238 | 13863042 | 21510.28 | 3198 | 3140 | 644.3 |
| A | 14 | 237 | 375274 | 577.54 | 3198 | 3140 | 644.3 |
| A | 14 | 254 | 342620 | 526.87 | 3198 | 3140 | 644.3 |
| B | 10 | 245 | 1656143 | 2437.66 | 3577 | 3493 | 678.0 |
| B | 0 | 183 | 110013 | 157.12 | 3577 | 3493 | 678.0 |
| B | 0 | 214 | 86874 | 122.99 | 3577 | 3493 | 678.0 |
| C | 3 | 233 | 1963235 | 2445.72 | 3455 | 3487 | 801.3 |
| C | 14 | 238 | 543835 | 674.34 | 3455 | 3487 | 801.3 |
| C | 8 | 208 | 46640 | 53.85 | 3455 | 3487 | 801.3 |
| D | 1 | 52 | 8602625 | 10322.7 | 3439 | 3350 | 833.0 |
| D | 14 | 34 | 912688 | 1091.58 | 3439 | 3350 | 833.0 |
| D | 11 | 176 | 175586 | 206.75 | 3439 | 3350 | 833.0 |
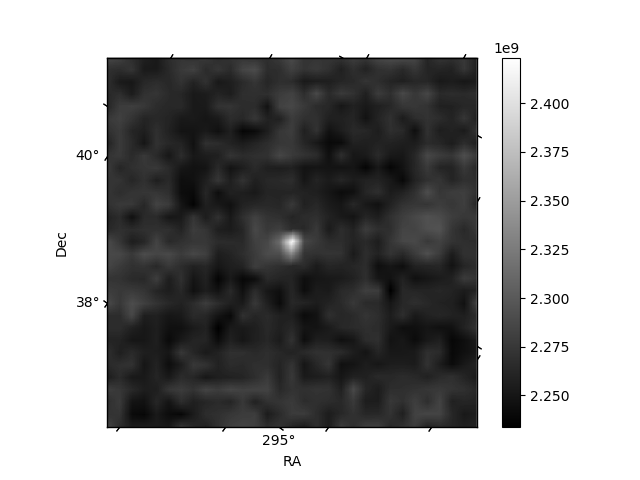
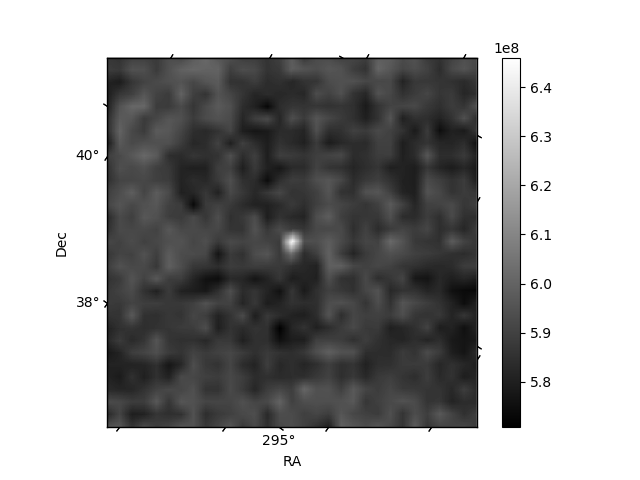
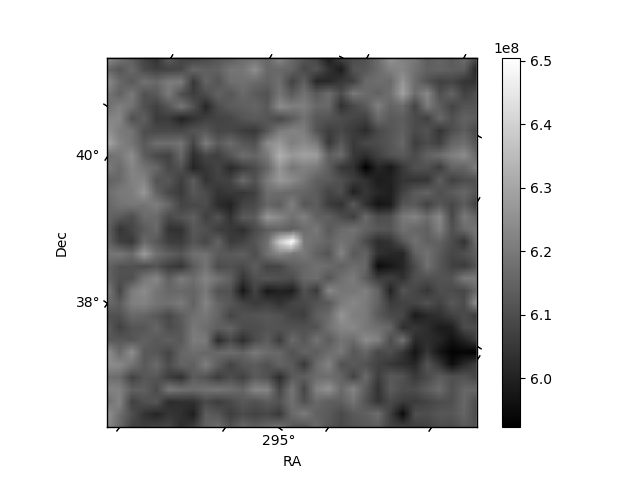
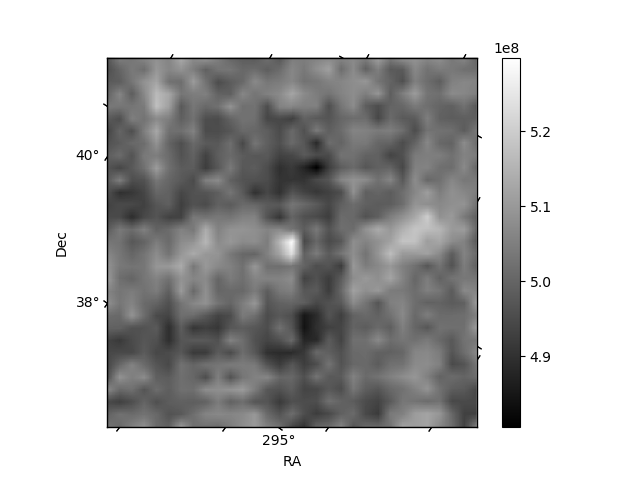
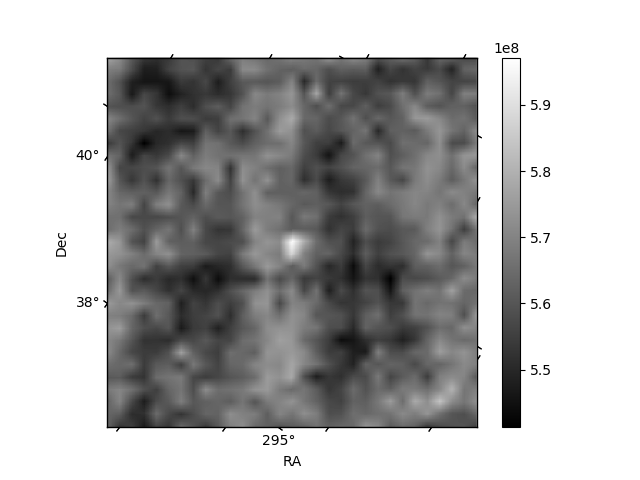
Histogram calculated using DETX and DETY for each event in the final _common_clean file
| Quadrant A | 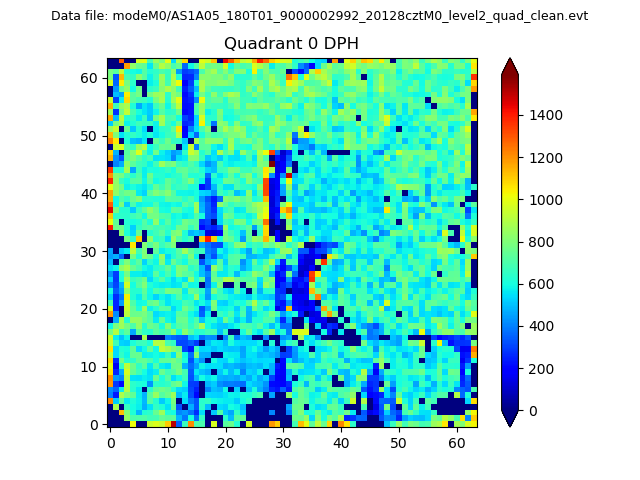 |
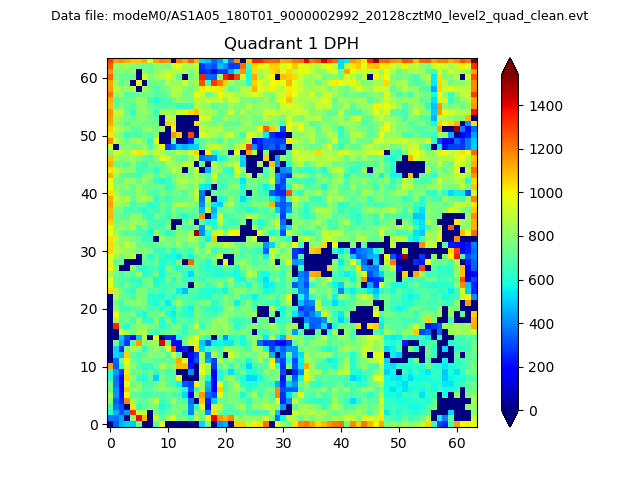 |
Quadrant B |
|---|---|---|---|
| Quadrant D | 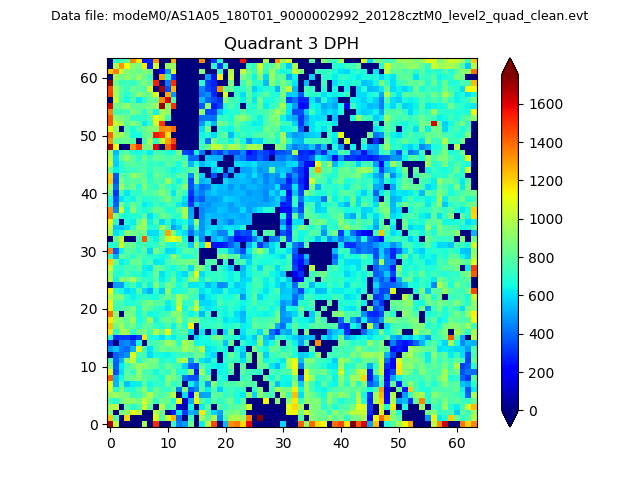 |
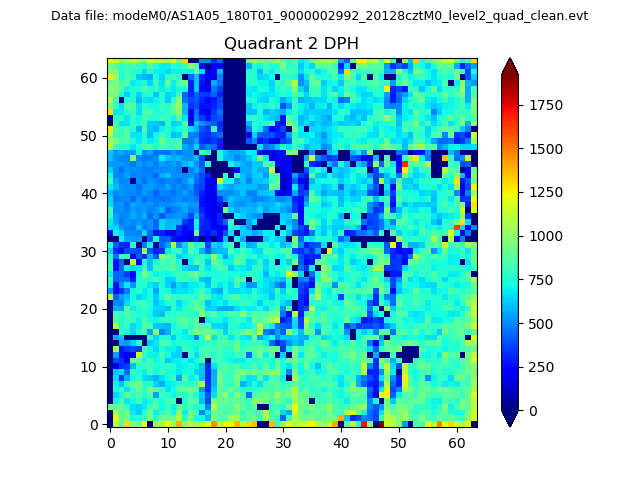 |
Quadrant C |
| Plot type | Count rate plots | Images |
|---|---|---|
| Comparison with Poisson distribution Blue bars denote a histogram of data divided into 1 sec bins. Red curve is a Poisson curve with rate = median count rate of data. |
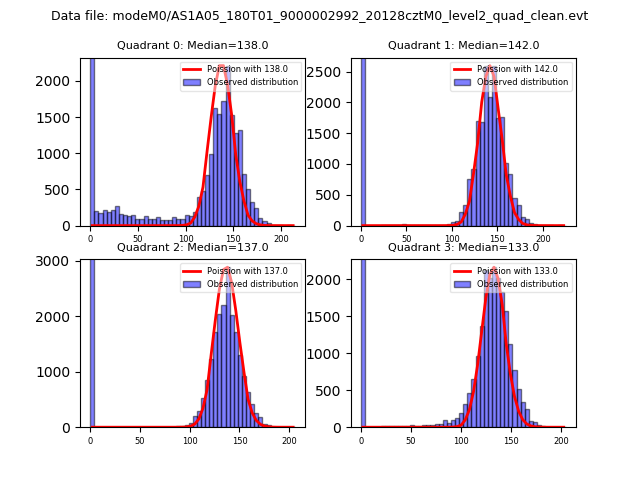 |
 |
| Quadrant-wise count rates Data is divided into 100 sec bins |
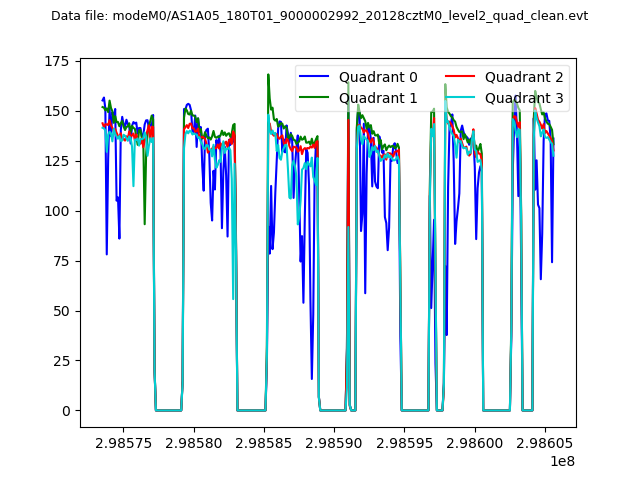 |
|
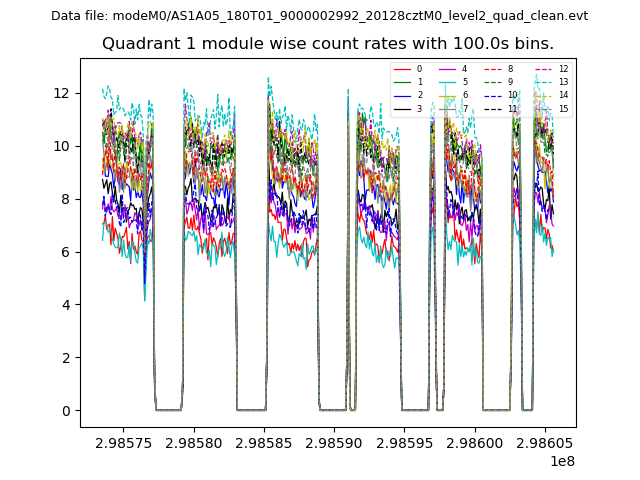
| Module-wise count rates for Quadrant A Data is divided into 100 sec bins |
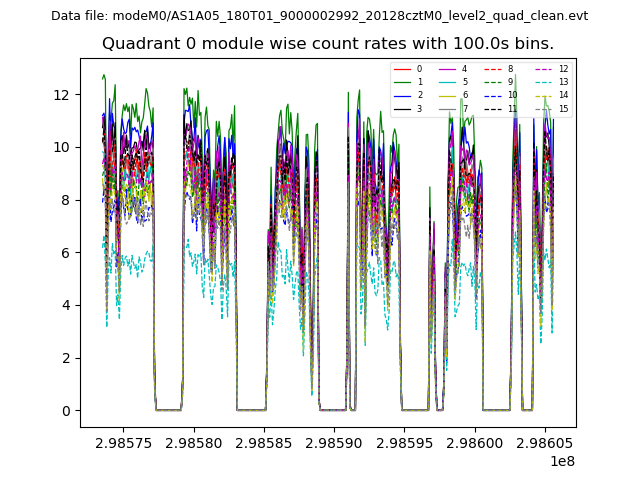 |
 |
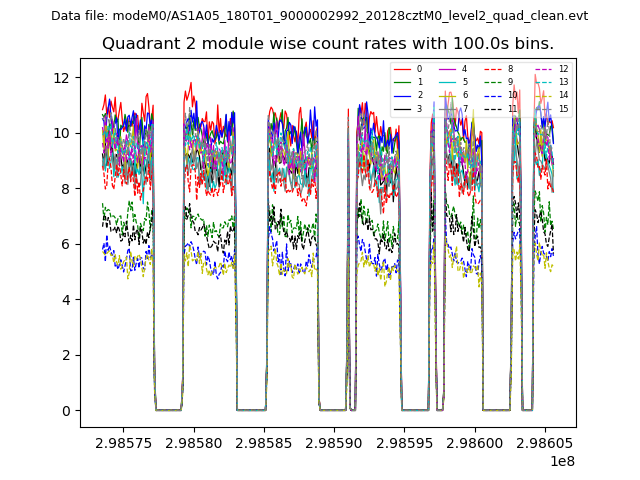
| Module-wise count rates for Quadrant B Data is divided into 100 sec bins |
 |
 |
| Module-wise count rates for Quadrant C Data is divided into 100 sec bins |
 |
 |
| Module-wise count rates for Quadrant D Data is divided into 100 sec bins |
 |
 |
| Parameter | Plot |
|---|---|
| CZT HV Monitor | 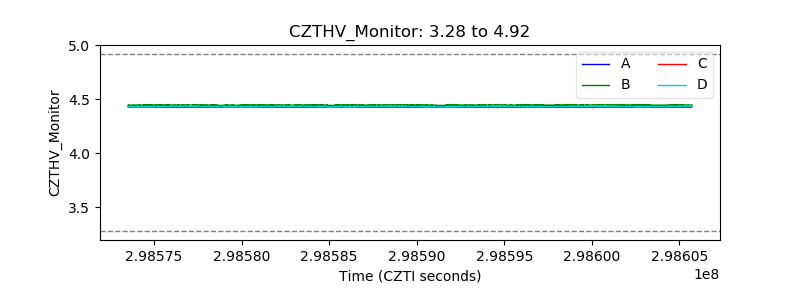 |
| D_VDD |  |
| Temperature 1 | 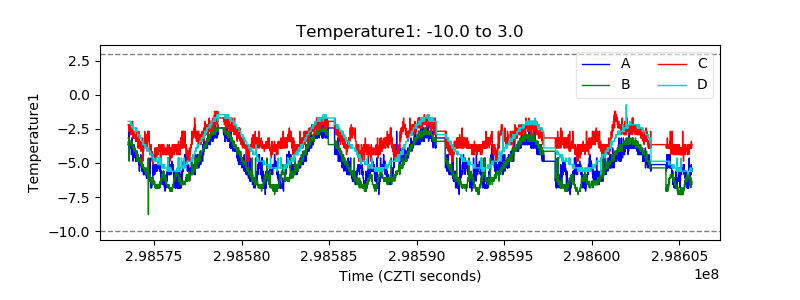 |
| Veto HV Monitor | 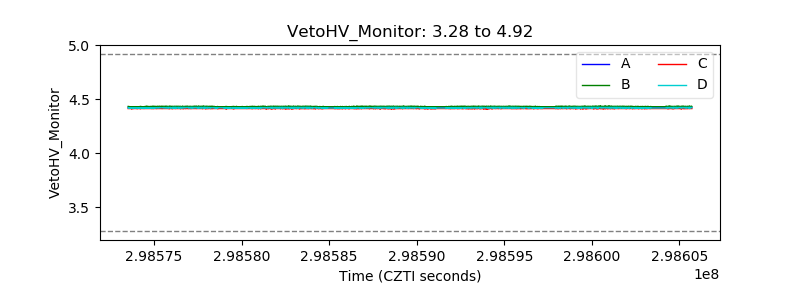 |
| Veto LLD | 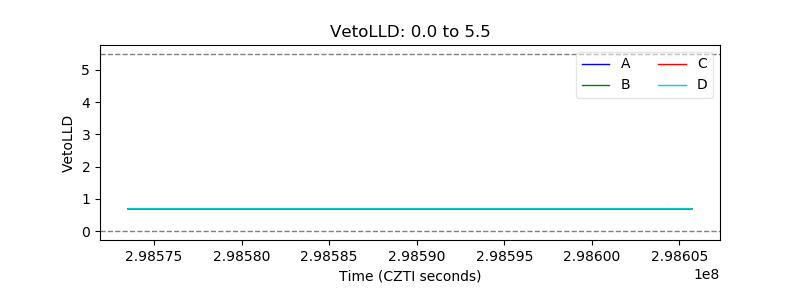 |
| Alpha Counter | 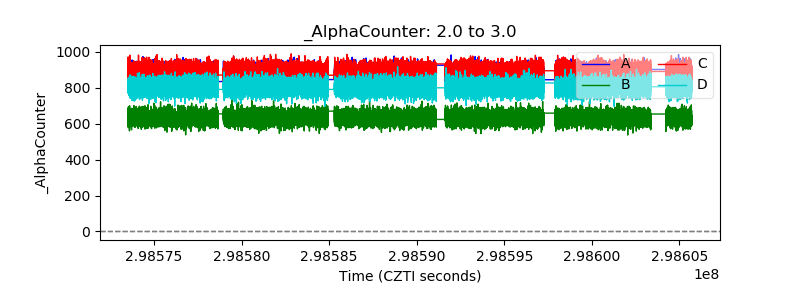 |
| _CPM_Rate | 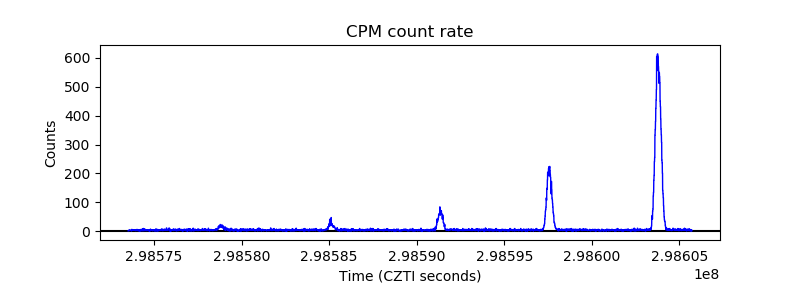 |
| CZT Counter | 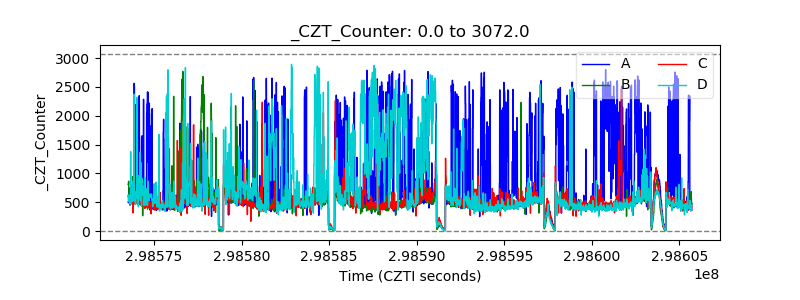 |
| +2.5 Volts monitor |  |
| +5 Volts monitor |  |
| _ROLL_ROT | 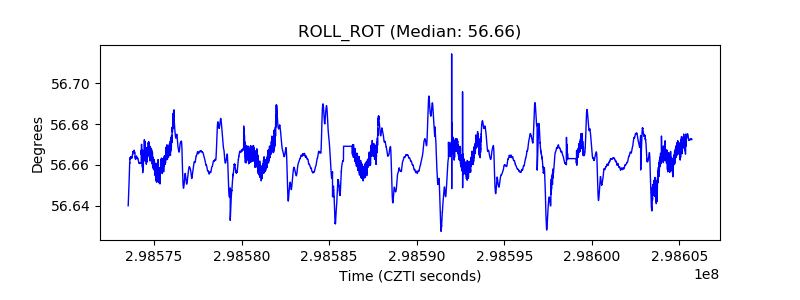 |
| _Roll_DEC | 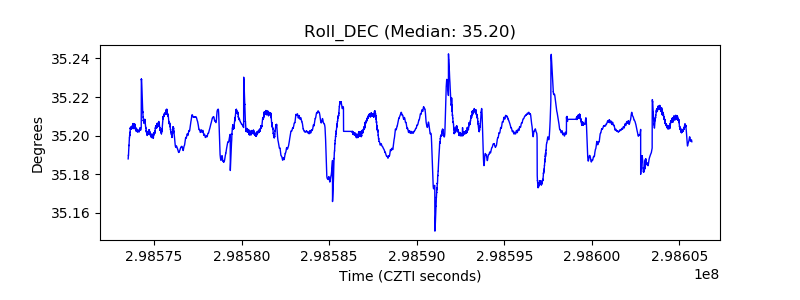 |
| _Roll_RA | 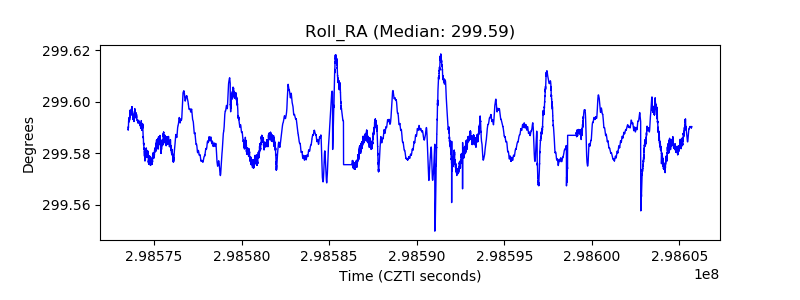 |
| Veto Counter | 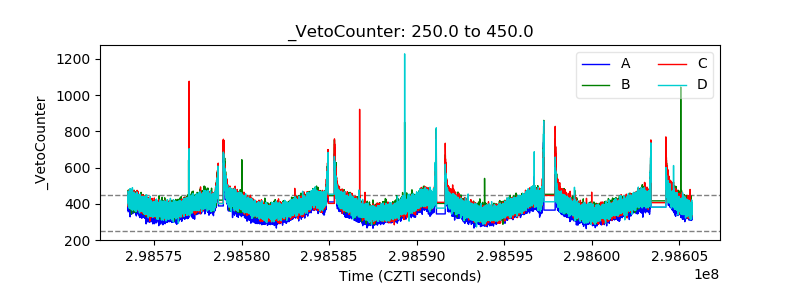 |