| Param | Original file | Final file |
|---|---|---|
| Filename | modeM0/AS1A05_180T01_9000002992_20131cztM0_level2.evt | modeM0/AS1A05_180T01_9000002992_20131cztM0_level2_quad_clean.evt |
| Size (bytes) | 504,938,880 | 92,301,120 |
| Size | 481.5 MB | 88.0 MB |
| Events in quadrant A | 5,652,555 | 533,352 |
| Events in quadrant B | 3,040,732 | 638,761 |
| Events in quadrant C | 2,987,402 | 601,947 |
| Events in quadrant D | 3,201,189 | 598,912 |
| Mode M9 | |||
|---|---|---|---|
| Quadrant | BADHDUFLAG | Total packets | Discarded packets |
| A | 0 | 12 | 0 |
| B | 0 | 12 | 0 |
| C | 0 | 12 | 0 |
| D | 0 | 12 | 0 |
| Mode M0 | |||
|---|---|---|---|
| Quadrant | BADHDUFLAG | Total packets | Discarded packets |
| A | 0 | 20641 | 1 |
| B | 0 | 12670 | 1 |
| C | 0 | 12553 | 1 |
| D | 0 | 13480 | 1 |
| Mode SS | |||
|---|---|---|---|
| Quadrant | BADHDUFLAG | Total packets | Discarded packets |
| A | 0 | 120 | 0 |
| B | 0 | 120 | 0 |
| C | 0 | 120 | 0 |
| D | 0 | 120 | 0 |
| Quadrant | Total seconds | Saturated seconds | Saturation percentage |
|---|---|---|---|
| A | 6049 | 1246 | 20.598446% |
| B | 6050 | 58 | 0.958678% |
| C | 6049 | 56 | 0.925773% |
| D | 6049 | 77 | 1.272938% |
Noise dominated data is calculated using 1-second bins in cleaned event files. If a bin has >2000 counts, and if more than 50% of those come from <1% of pixels, then it is considered to be noise-dominated and hence unusable.
| Quadrant | # 1 sec bins | Bins with >0 counts | Bins with >2000 counts | High rate bins dominated by noise | Noise dominated (total time) | Noise dominated (detector-on time) | Marked lightcurve |
|---|---|---|---|---|---|---|---|
| A | 7164 | 6050 | 765 | 765 | 10.68% | 12.64% |  |
| B | 7165 | 6051 | 2 | 2 | 0.03% | 0.03% | 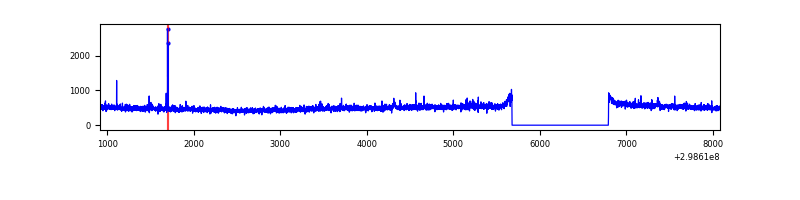 |
| C | 7164 | 6050 | 0 | 0 | 0.00% | 0.00% | 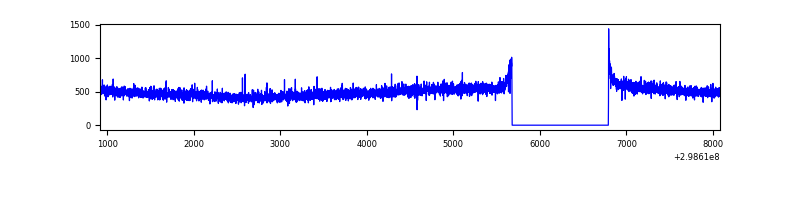 |
| D | 7164 | 6050 | 40 | 40 | 0.56% | 0.66% | 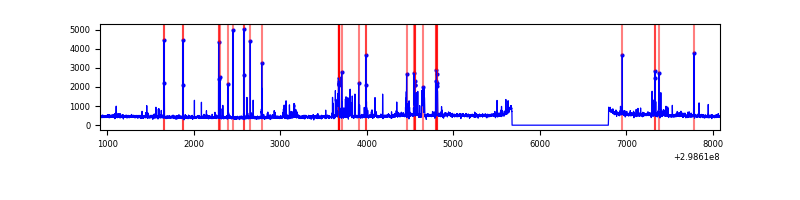 |
Top three noisy pixels from each quadrant. If the there are fewer than three noisy pixels in the level2.evt file, extra rows are filled as -1
| Pixel properties | Quadrant properties | ||||||
|---|---|---|---|---|---|---|---|
| Quadrant | DetID | PixID | Counts | Sigma | Mean | Median | Sigma |
| A | 14 | 238 | 2988117 | 21851.58 | 681 | 672 | 136.7 |
| A | 14 | 237 | 26517 | 189.04 | 681 | 672 | 136.7 |
| A | 12 | 16 | 6891 | 45.49 | 681 | 672 | 136.7 |
| B | 12 | 111 | 17469 | 114.1 | 765 | 748 | 146.6 |
| B | 0 | 214 | 17110 | 111.65 | 765 | 748 | 146.6 |
| B | 3 | 64 | 15380 | 99.84 | 765 | 748 | 146.6 |
| C | 14 | 238 | 116268 | 682.18 | 728 | 736 | 169.4 |
| C | 3 | 233 | 25892 | 148.54 | 728 | 736 | 169.4 |
| C | 13 | 61 | 4942 | 24.84 | 728 | 736 | 169.4 |
| D | 1 | 52 | 278885 | 1564.87 | 741 | 723 | 177.8 |
| D | 14 | 34 | 39969 | 220.79 | 741 | 723 | 177.8 |
| D | 11 | 176 | 37614 | 207.54 | 741 | 723 | 177.8 |
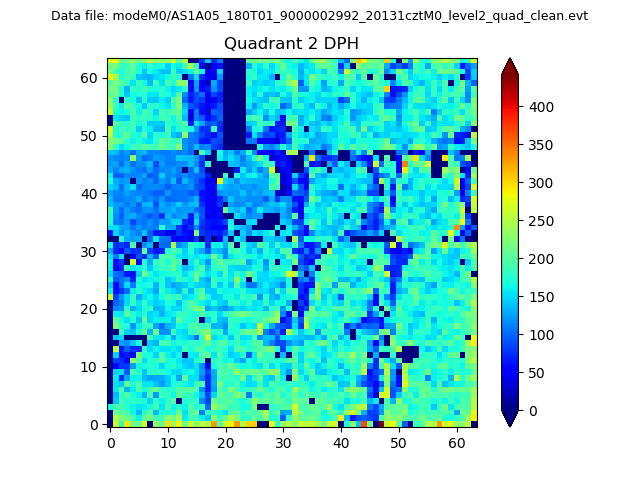
Histogram calculated using DETX and DETY for each event in the final _common_clean file
| Quadrant A | 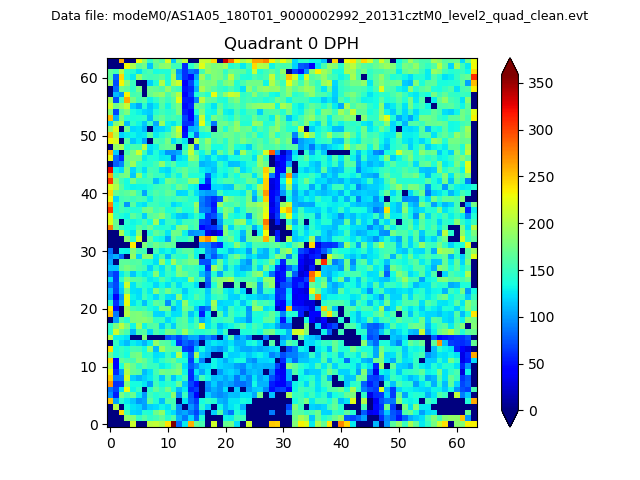 |
 |
Quadrant B |
|---|---|---|---|
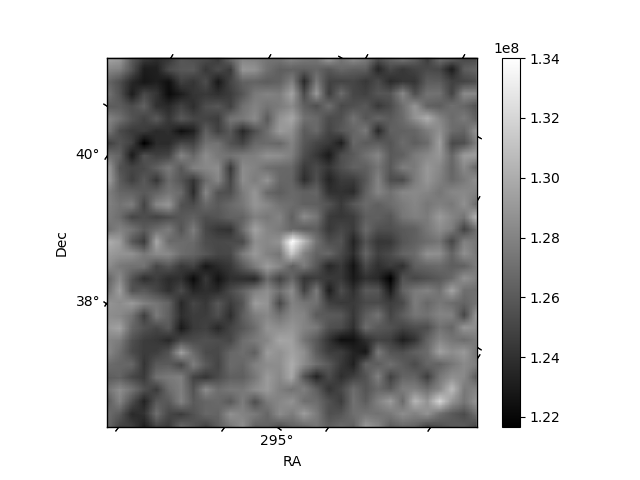
| Quadrant D | 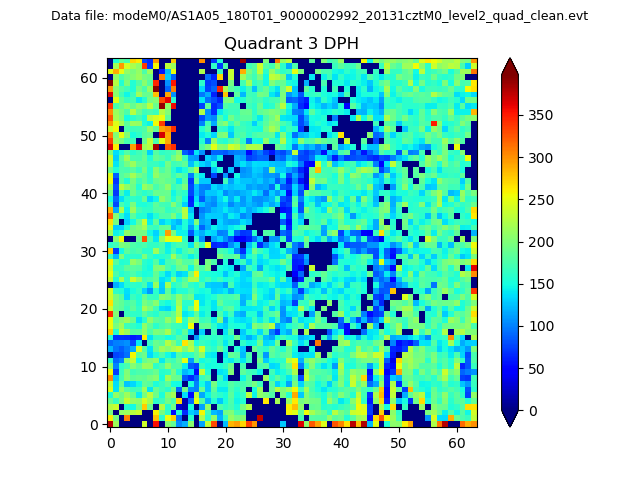 |
 |
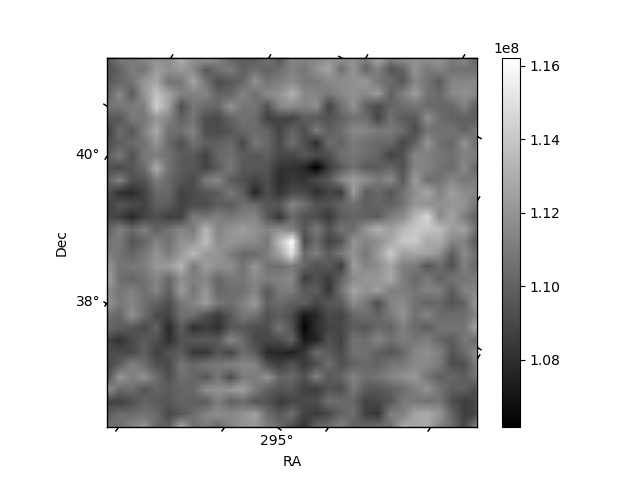
Quadrant C |
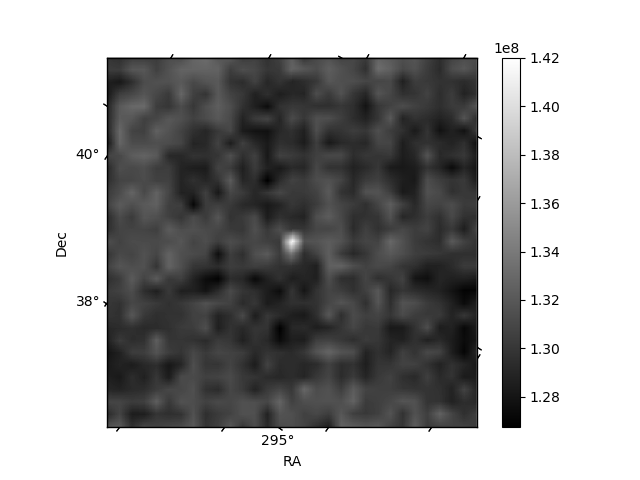
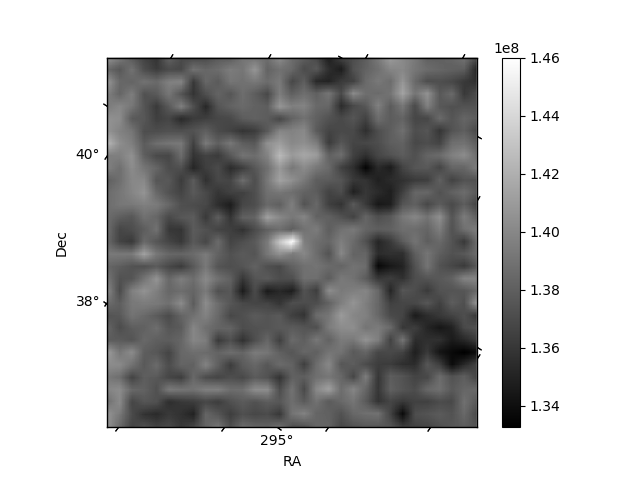
| Plot type | Count rate plots | Images |
|---|---|---|
| Comparison with Poisson distribution Blue bars denote a histogram of data divided into 1 sec bins. Red curve is a Poisson curve with rate = median count rate of data. |
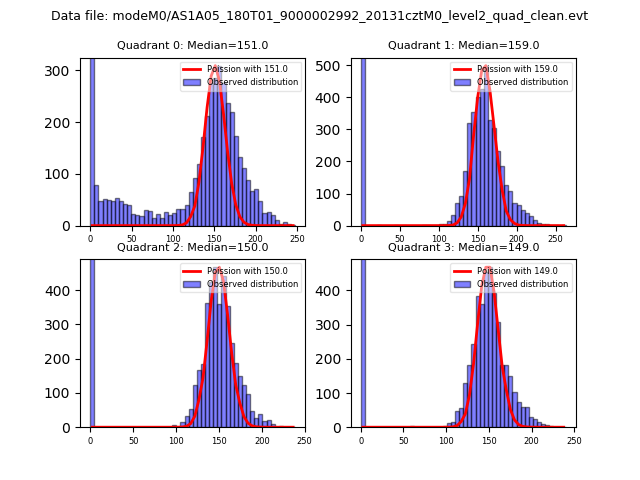 |
 |
| Quadrant-wise count rates Data is divided into 100 sec bins |
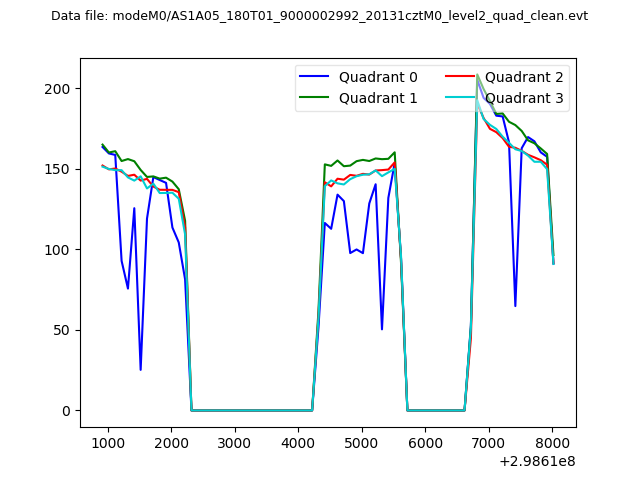 |
|
| Module-wise count rates for Quadrant A Data is divided into 100 sec bins |
 |
 |
| Module-wise count rates for Quadrant B Data is divided into 100 sec bins |
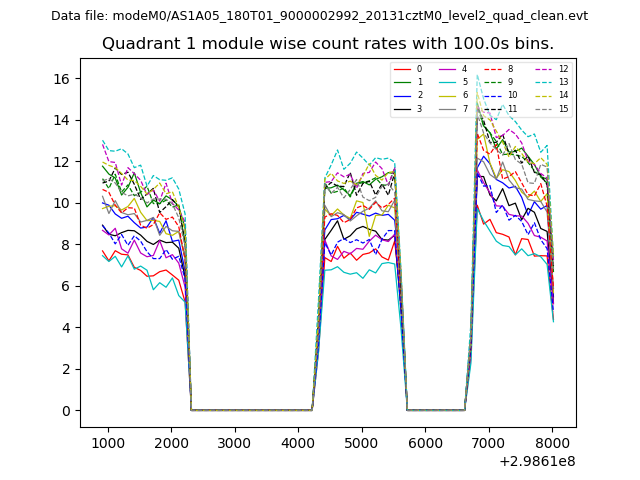 |
 |
| Module-wise count rates for Quadrant C Data is divided into 100 sec bins |
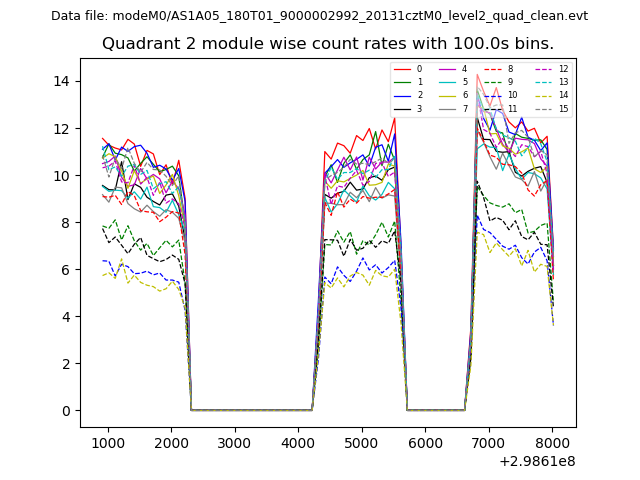 |
 |
| Module-wise count rates for Quadrant D Data is divided into 100 sec bins |
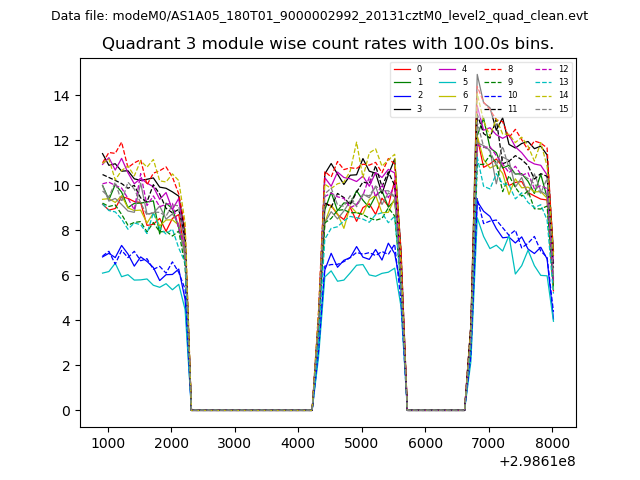 |
 |
| Parameter | Plot |
|---|---|
| CZT HV Monitor | 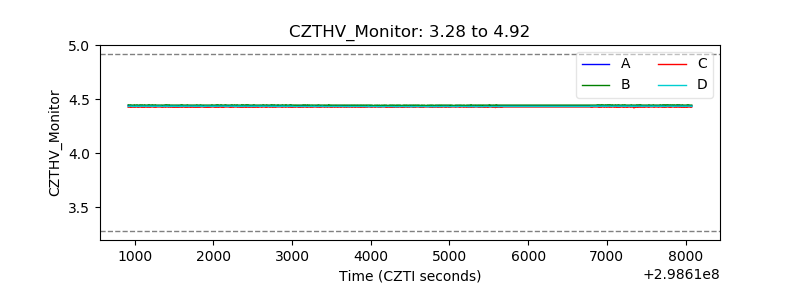 |
| D_VDD | 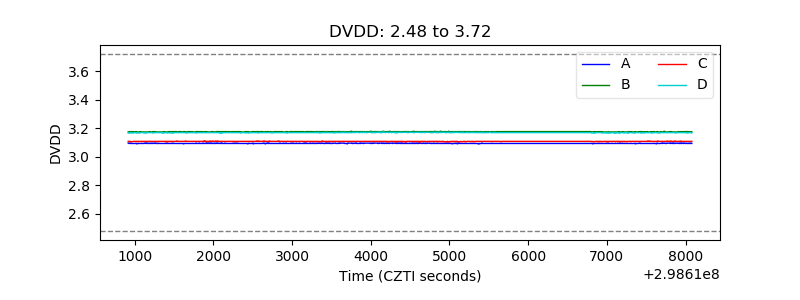 |
| Temperature 1 | 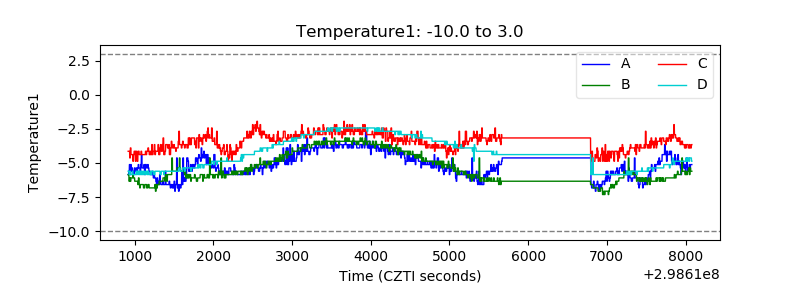 |
| Veto HV Monitor | 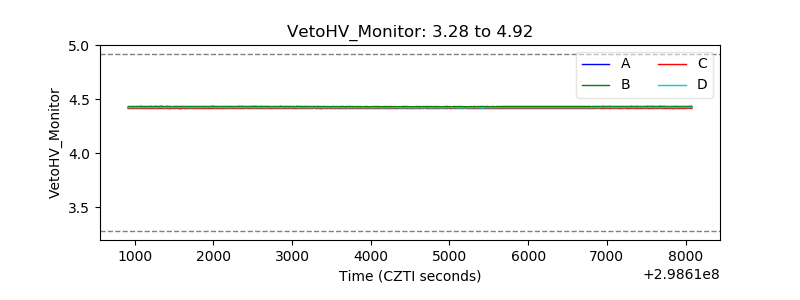 |
| Veto LLD | 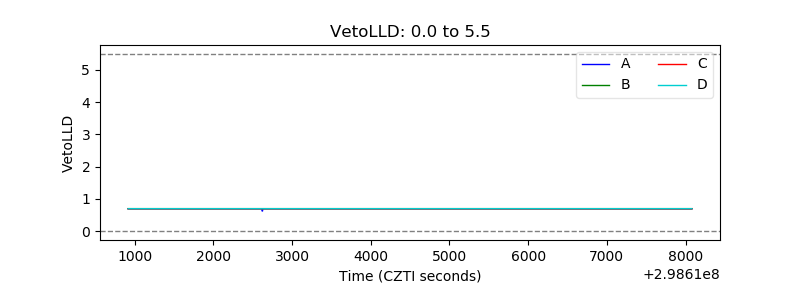 |
| Alpha Counter | 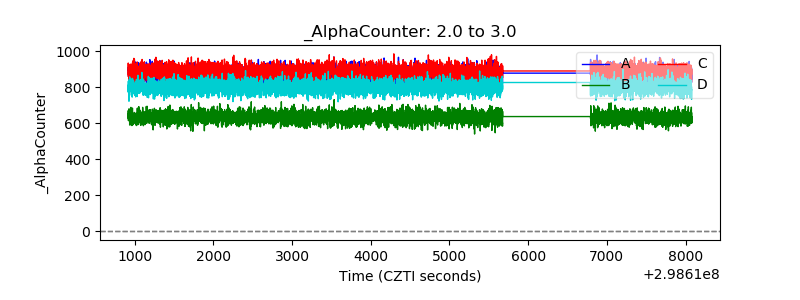 |
| _CPM_Rate | 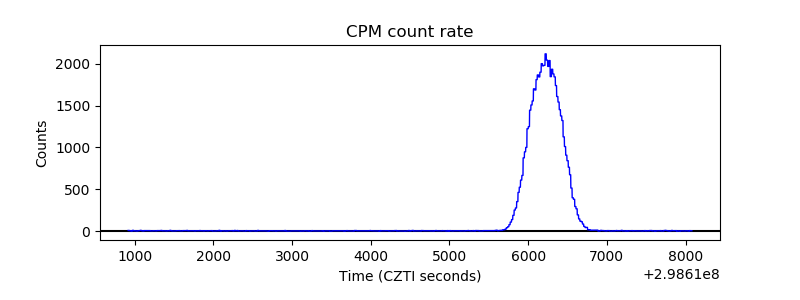 |
| CZT Counter | 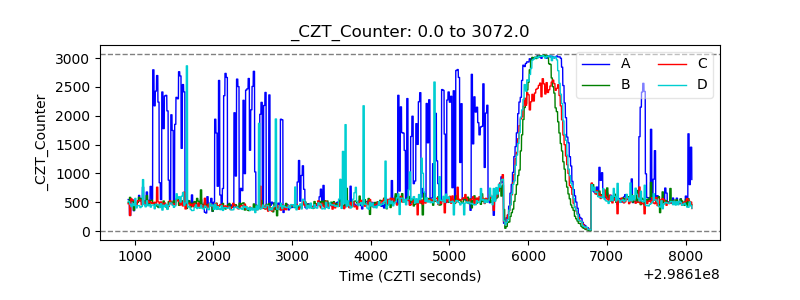 |
| +2.5 Volts monitor |  |
| +5 Volts monitor |  |
| _ROLL_ROT | 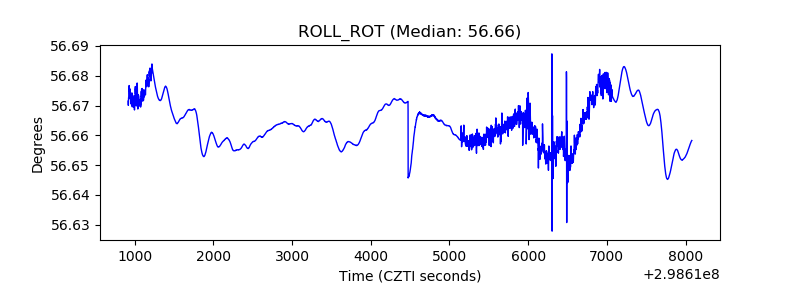 |
| _Roll_DEC | 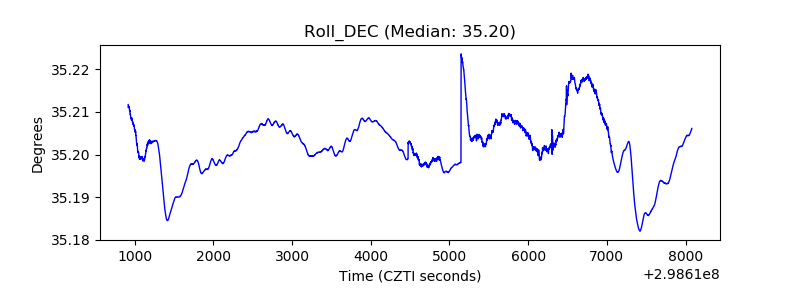 |
| _Roll_RA | 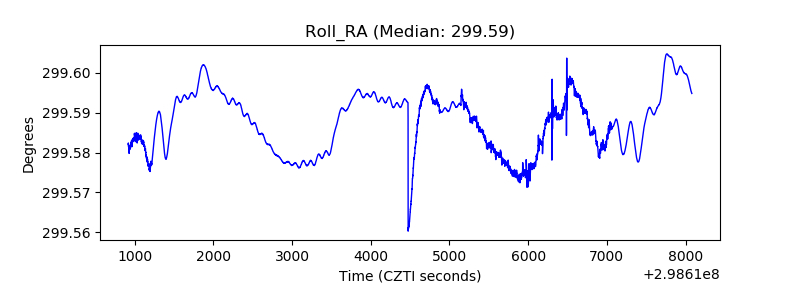 |
| Veto Counter | 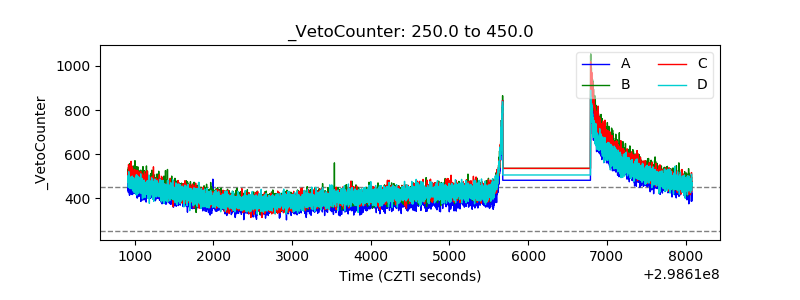 |