| Param | Original file | Final file |
|---|---|---|
| Filename | modeM0/AS1A05_180T01_9000002992_20134cztM0_level2.evt | modeM0/AS1A05_180T01_9000002992_20134cztM0_level2_quad_clean.evt |
| Size (bytes) | 506,280,960 | 72,080,640 |
| Size | 482.8 MB | 68.7 MB |
| Events in quadrant A | 4,291,752 | 426,351 |
| Events in quadrant B | 3,429,552 | 463,518 |
| Events in quadrant C | 3,667,292 | 437,271 |
| Events in quadrant D | 3,537,518 | 436,706 |
| Mode M9 | |||
|---|---|---|---|
| Quadrant | BADHDUFLAG | Total packets | Discarded packets |
| A | 0 | 13 | 0 |
| B | 0 | 13 | 0 |
| C | 0 | 13 | 0 |
| D | 0 | 13 | 0 |
| Mode M0 | |||
|---|---|---|---|
| Quadrant | BADHDUFLAG | Total packets | Discarded packets |
| A | 0 | 16372 | 1 |
| B | 0 | 13757 | 1 |
| C | 0 | 14874 | 1 |
| D | 0 | 14004 | 1 |
| Mode SS | |||
|---|---|---|---|
| Quadrant | BADHDUFLAG | Total packets | Discarded packets |
| A | 0 | 122 | 0 |
| B | 0 | 122 | 0 |
| C | 0 | 122 | 0 |
| D | 0 | 122 | 0 |
| Quadrant | Total seconds | Saturated seconds | Saturation percentage |
|---|---|---|---|
| A | 5990 | 523 | 8.731219% |
| B | 5991 | 138 | 2.303455% |
| C | 5991 | 139 | 2.320147% |
| D | 5991 | 165 | 2.754131% |
Noise dominated data is calculated using 1-second bins in cleaned event files. If a bin has >2000 counts, and if more than 50% of those come from <1% of pixels, then it is considered to be noise-dominated and hence unusable.
| Quadrant | # 1 sec bins | Bins with >0 counts | Bins with >2000 counts | High rate bins dominated by noise | Noise dominated (total time) | Noise dominated (detector-on time) | Marked lightcurve |
|---|---|---|---|---|---|---|---|
| A | 7315 | 5991 | 271 | 271 | 3.70% | 4.52% | 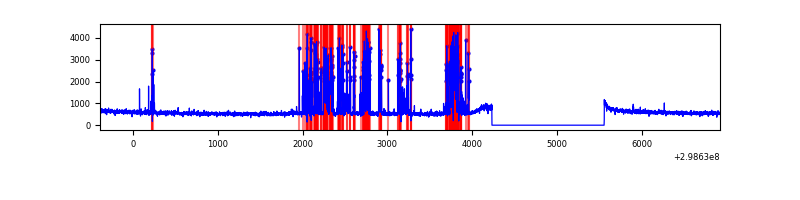 |
| B | 7316 | 5992 | 5 | 5 | 0.07% | 0.08% | 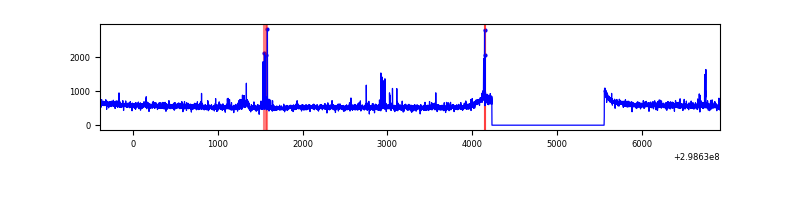 |
| C | 7316 | 5992 | 0 | 0 | 0.00% | 0.00% | 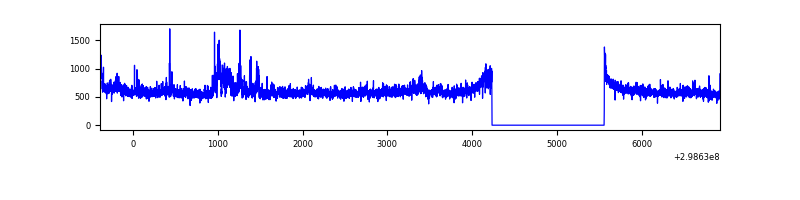 |
| D | 7316 | 5992 | 72 | 72 | 0.98% | 1.20% | 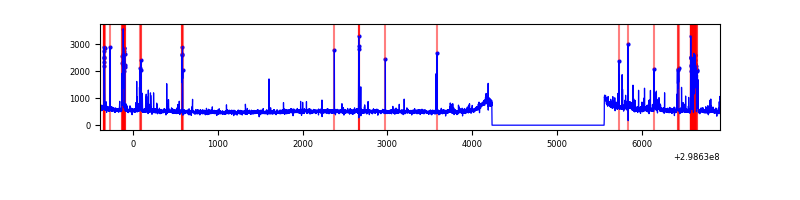 |
Top three noisy pixels from each quadrant. If the there are fewer than three noisy pixels in the level2.evt file, extra rows are filled as -1
| Pixel properties | Quadrant properties | ||||||
|---|---|---|---|---|---|---|---|
| Quadrant | DetID | PixID | Counts | Sigma | Mean | Median | Sigma |
| A | 14 | 238 | 1055756 | 6382.13 | 837 | 825 | 165.3 |
| A | 0 | 226 | 7360 | 39.54 | 837 | 825 | 165.3 |
| A | 13 | 254 | 6893 | 36.71 | 837 | 825 | 165.3 |
| B | 0 | 183 | 44572 | 278.08 | 847 | 830 | 157.3 |
| B | 3 | 64 | 22489 | 137.69 | 847 | 830 | 157.3 |
| B | 0 | 190 | 20859 | 127.33 | 847 | 830 | 157.3 |
| C | 3 | 233 | 349687 | 1885.9 | 805 | 814 | 185.0 |
| C | 14 | 238 | 129796 | 697.24 | 805 | 814 | 185.0 |
| C | 8 | 208 | 34824 | 183.85 | 805 | 814 | 185.0 |
| D | 1 | 52 | 247553 | 1257.22 | 827 | 809 | 196.3 |
| D | 11 | 176 | 116013 | 586.99 | 827 | 809 | 196.3 |
| D | 2 | 234 | 22254 | 109.27 | 827 | 809 | 196.3 |
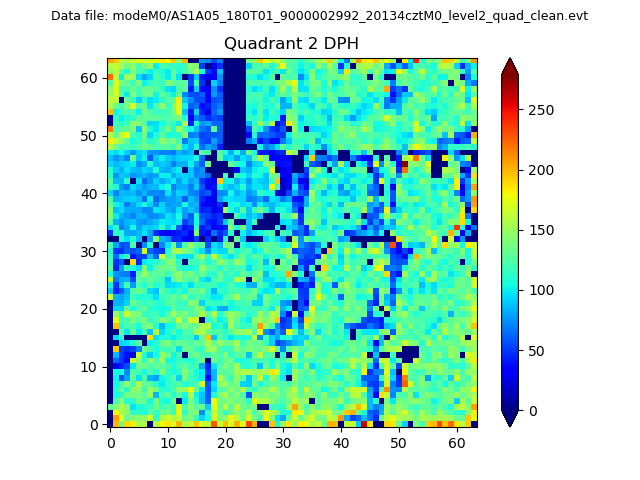
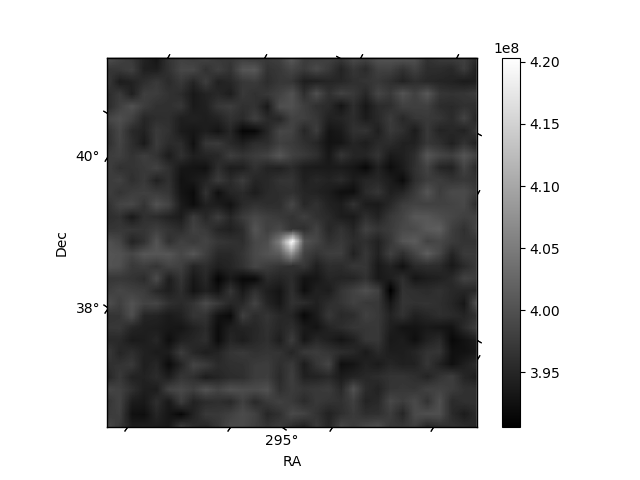
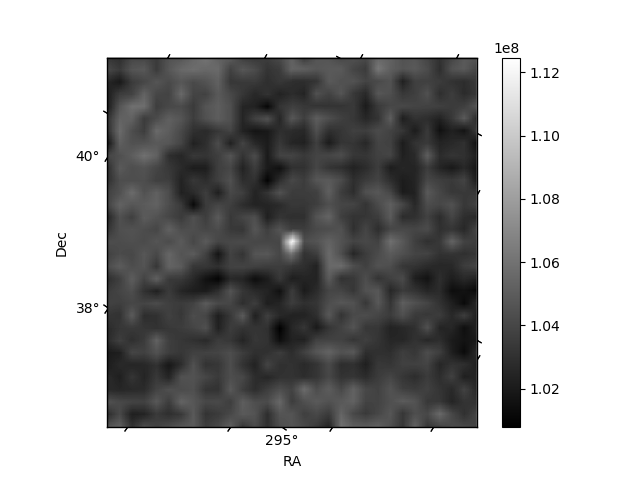
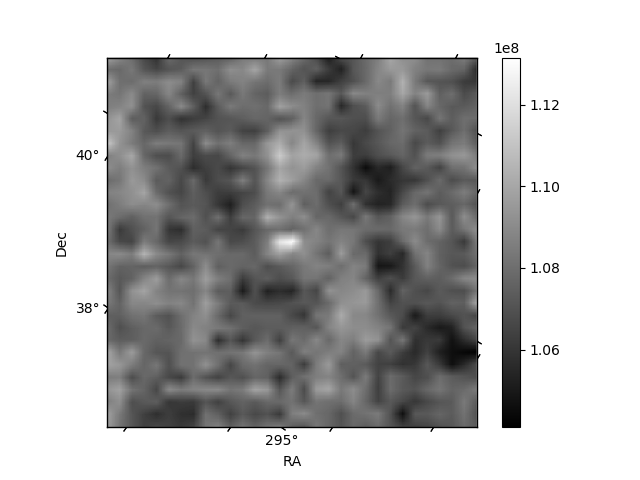
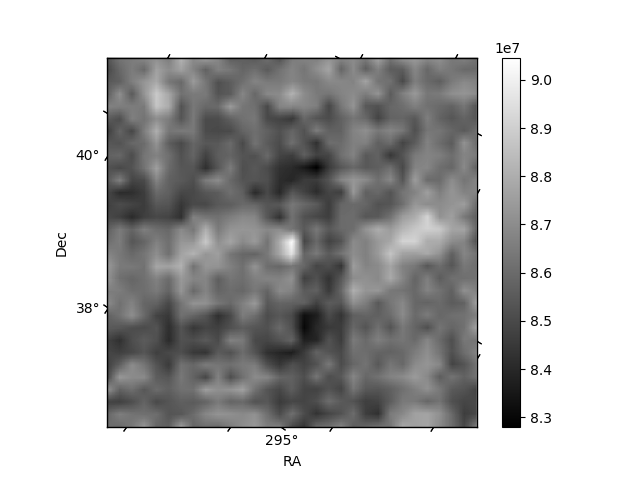
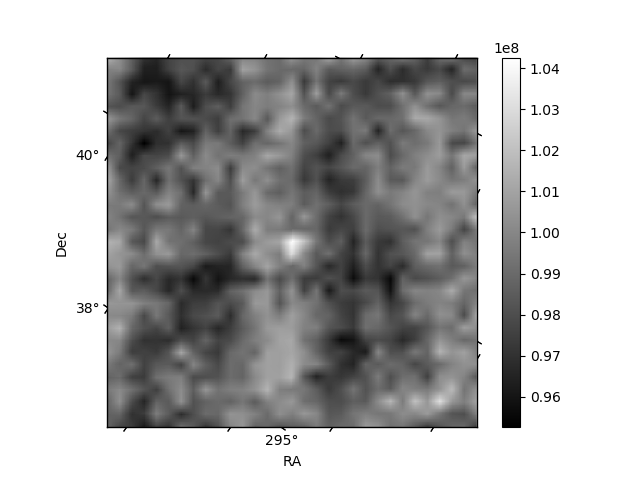
Histogram calculated using DETX and DETY for each event in the final _common_clean file
| Quadrant A | 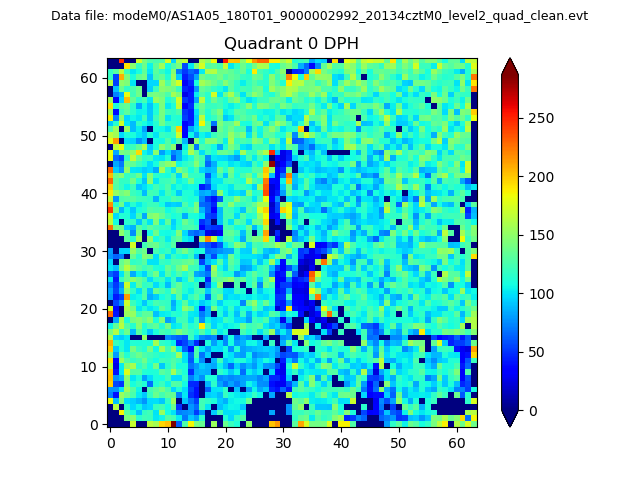 |
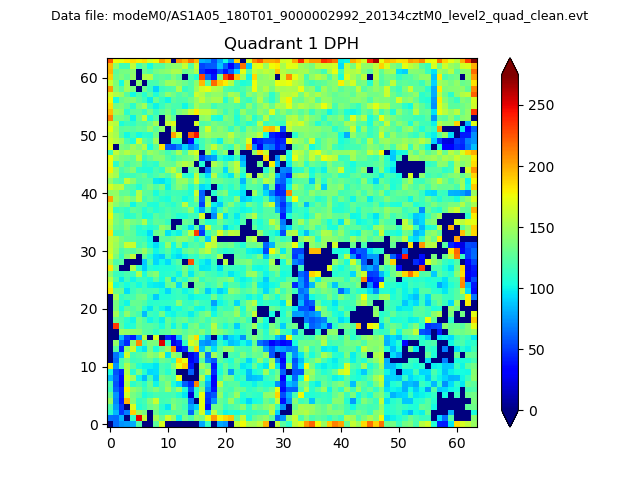 |
Quadrant B |
|---|---|---|---|
| Quadrant D | 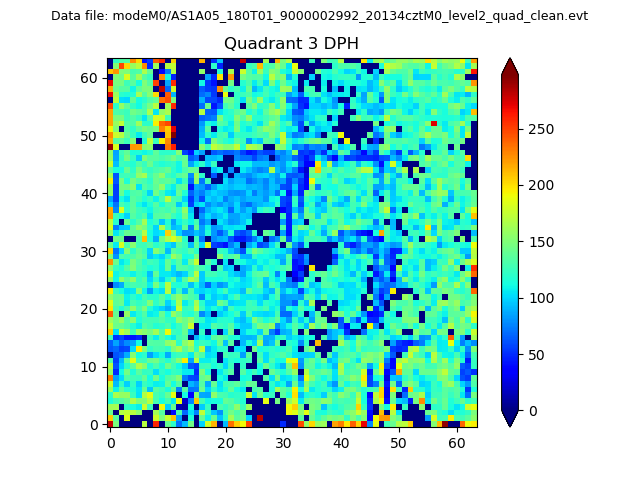 |
 |
Quadrant C |
| Plot type | Count rate plots | Images |
|---|---|---|
| Comparison with Poisson distribution Blue bars denote a histogram of data divided into 1 sec bins. Red curve is a Poisson curve with rate = median count rate of data. |
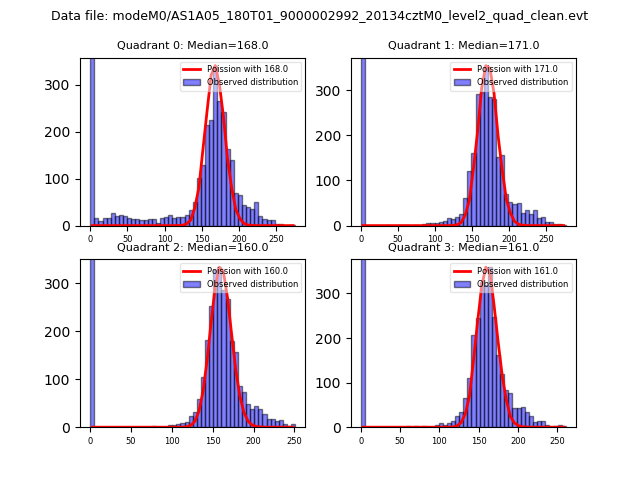 |
 |
| Quadrant-wise count rates Data is divided into 100 sec bins |
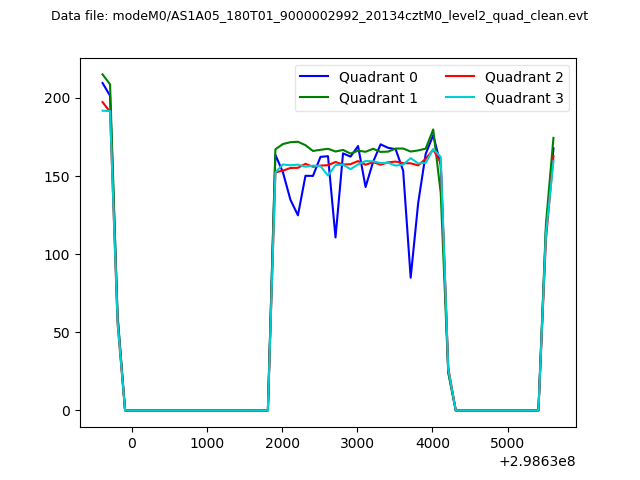 |
|
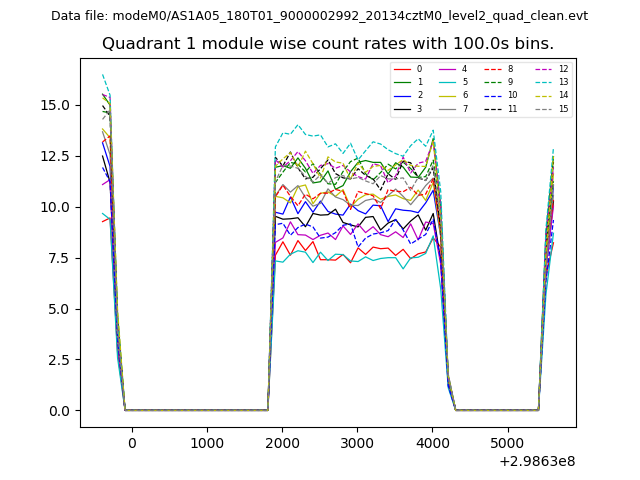
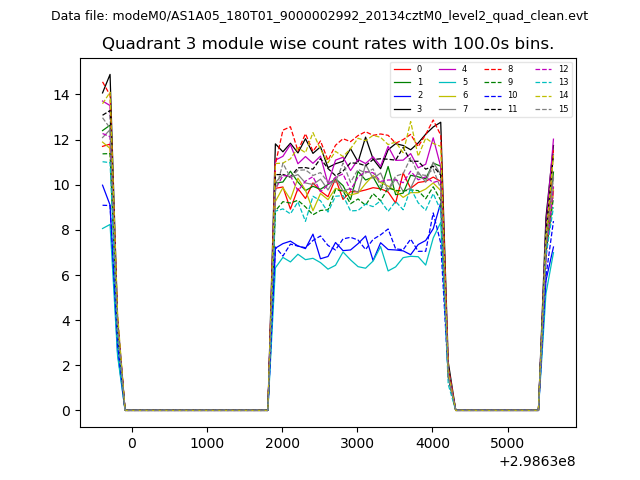
| Module-wise count rates for Quadrant A Data is divided into 100 sec bins |
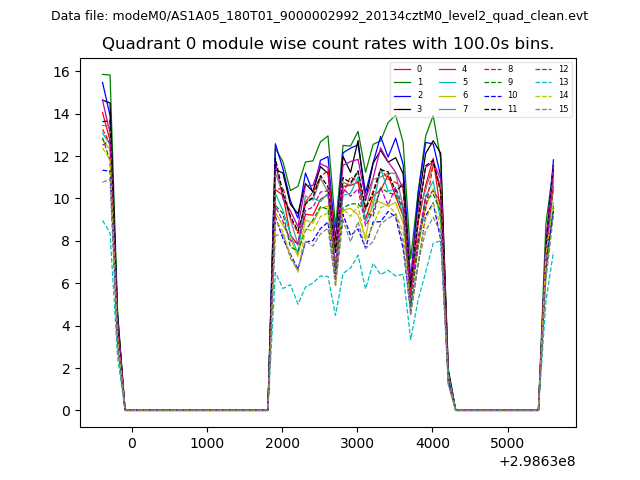 |
 |
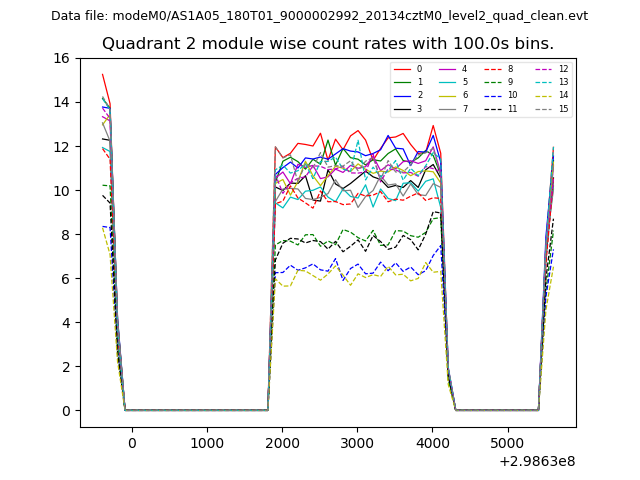
| Module-wise count rates for Quadrant B Data is divided into 100 sec bins |
 |
 |
| Module-wise count rates for Quadrant C Data is divided into 100 sec bins |
 |
 |
| Module-wise count rates for Quadrant D Data is divided into 100 sec bins |
 |
 |
| Parameter | Plot |
|---|---|
| CZT HV Monitor | 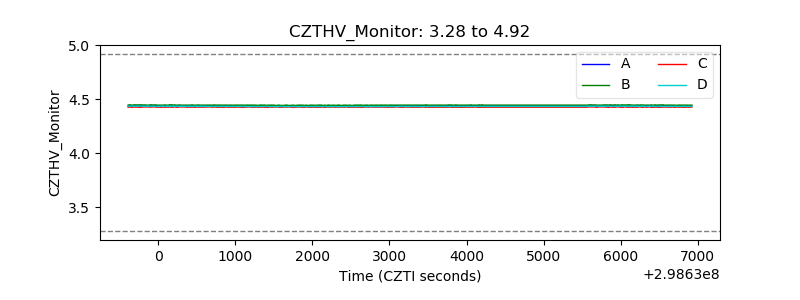 |
| D_VDD | 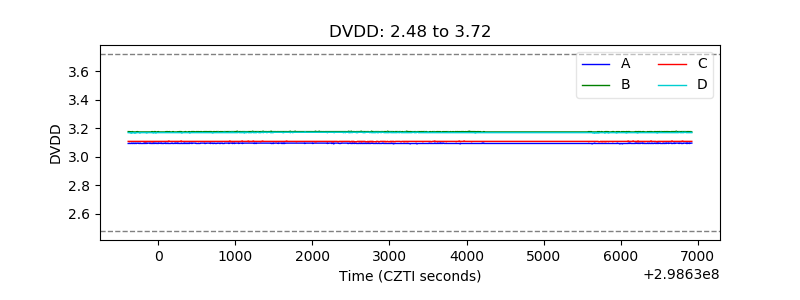 |
| Temperature 1 | 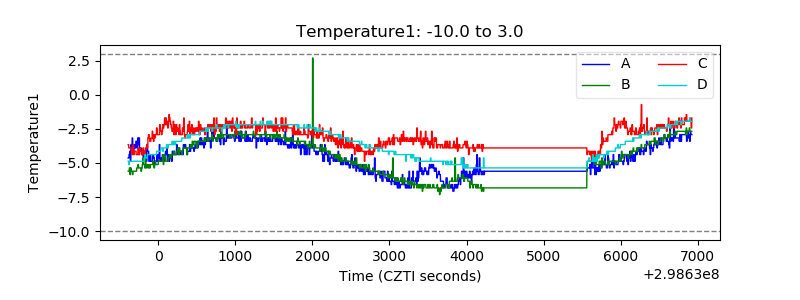 |
| Veto HV Monitor | 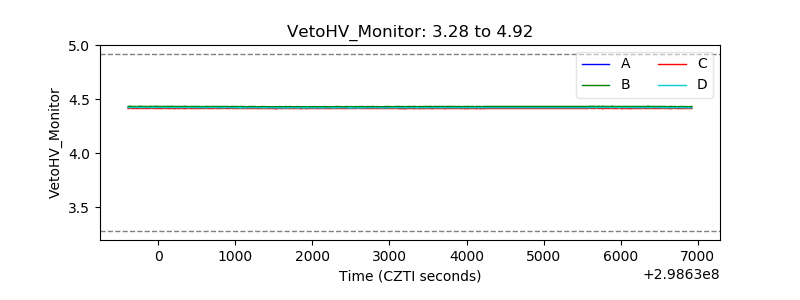 |
| Veto LLD | 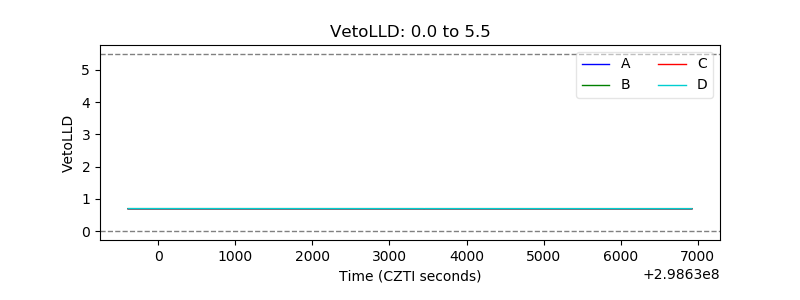 |
| Alpha Counter | 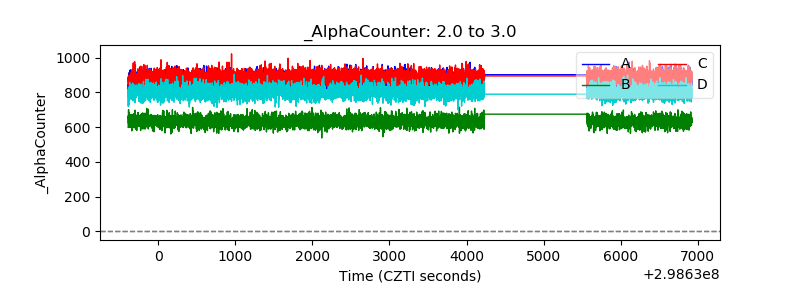 |
| _CPM_Rate | 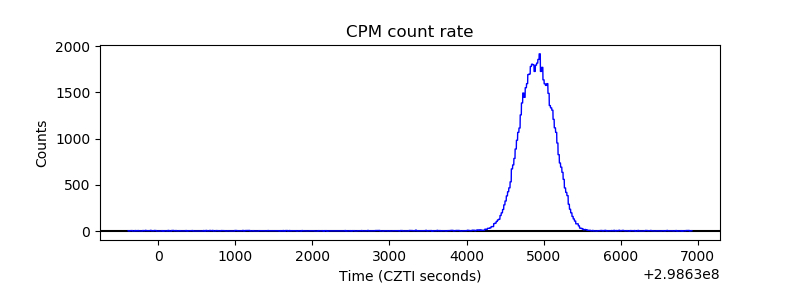 |
| CZT Counter | 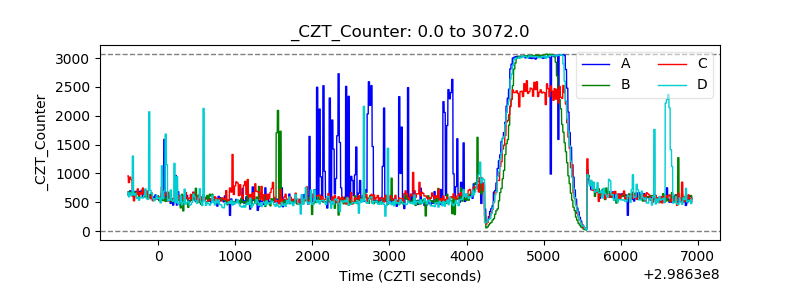 |
| +2.5 Volts monitor |  |
| +5 Volts monitor |  |
| _ROLL_ROT | 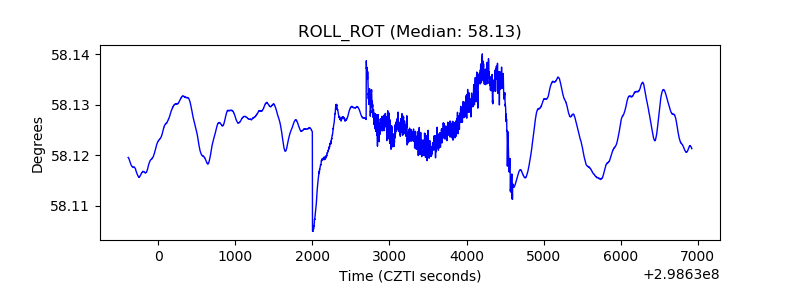 |
| _Roll_DEC | 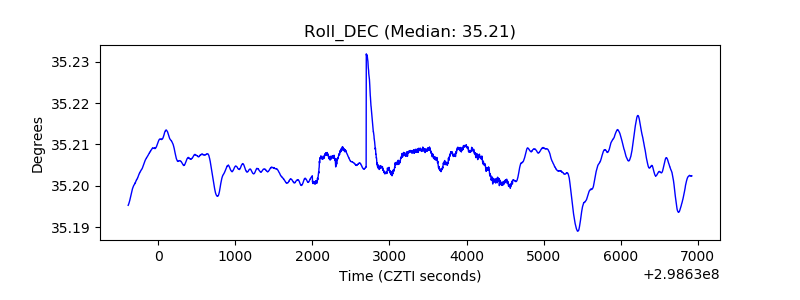 |
| _Roll_RA | 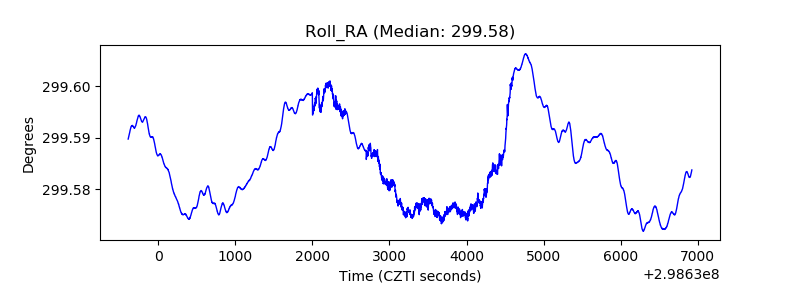 |
| Veto Counter | 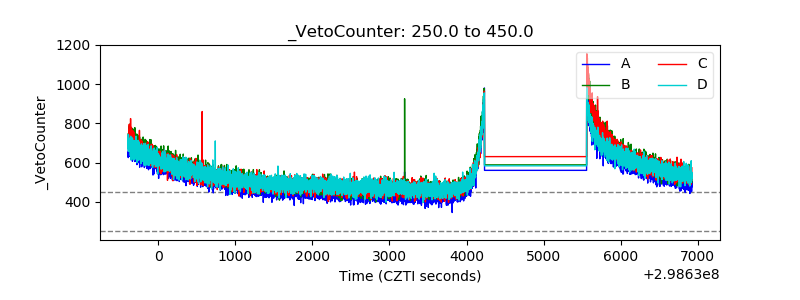 |