| Param | Original file | Final file |
|---|---|---|
| Filename | modeM0/AS1A05_180T01_9000002992_20135cztM0_level2.evt | modeM0/AS1A05_180T01_9000002992_20135cztM0_level2_quad_clean.evt |
| Size (bytes) | 536,281,920 | 75,896,640 |
| Size | 511.4 MB | 72.4 MB |
| Events in quadrant A | 4,327,886 | 458,173 |
| Events in quadrant B | 3,643,926 | 482,719 |
| Events in quadrant C | 3,700,612 | 458,888 |
| Events in quadrant D | 4,136,179 | 452,850 |
| Mode M9 | |||
|---|---|---|---|
| Quadrant | BADHDUFLAG | Total packets | Discarded packets |
| A | 0 | 13 | 0 |
| B | 0 | 13 | 0 |
| C | 0 | 13 | 0 |
| D | 0 | 13 | 0 |
| Mode M0 | |||
|---|---|---|---|
| Quadrant | BADHDUFLAG | Total packets | Discarded packets |
| A | 0 | 16672 | 2 |
| B | 0 | 14673 | 2 |
| C | 0 | 14837 | 2 |
| D | 0 | 16230 | 2 |
| Mode SS | |||
|---|---|---|---|
| Quadrant | BADHDUFLAG | Total packets | Discarded packets |
| A | 0 | 130 | 0 |
| B | 0 | 130 | 0 |
| C | 0 | 130 | 0 |
| D | 0 | 130 | 0 |
| Quadrant | Total seconds | Saturated seconds | Saturation percentage |
|---|---|---|---|
| A | 6381 | 409 | 6.409654% |
| B | 6382 | 164 | 2.569727% |
| C | 6381 | 164 | 2.570130% |
| D | 6381 | 216 | 3.385049% |
Noise dominated data is calculated using 1-second bins in cleaned event files. If a bin has >2000 counts, and if more than 50% of those come from <1% of pixels, then it is considered to be noise-dominated and hence unusable.
| Quadrant | # 1 sec bins | Bins with >0 counts | Bins with >2000 counts | High rate bins dominated by noise | Noise dominated (total time) | Noise dominated (detector-on time) | Marked lightcurve |
|---|---|---|---|---|---|---|---|
| A | 7671 | 6382 | 184 | 184 | 2.40% | 2.88% | 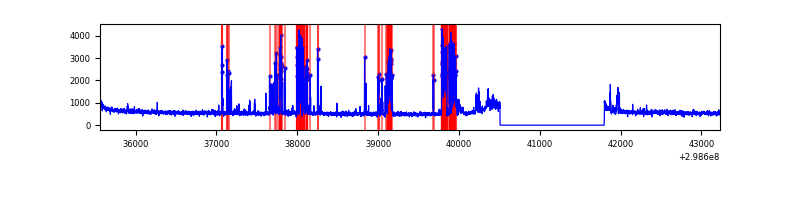 |
| B | 7672 | 6383 | 2 | 2 | 0.03% | 0.03% | 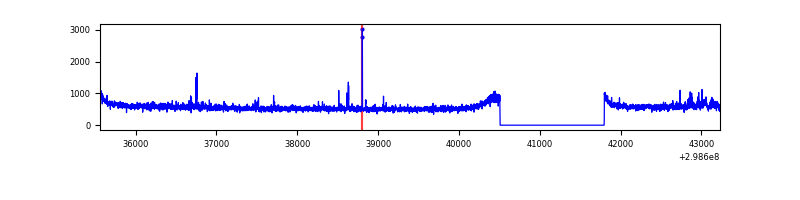 |
| C | 7671 | 6382 | 0 | 0 | 0.00% | 0.00% | 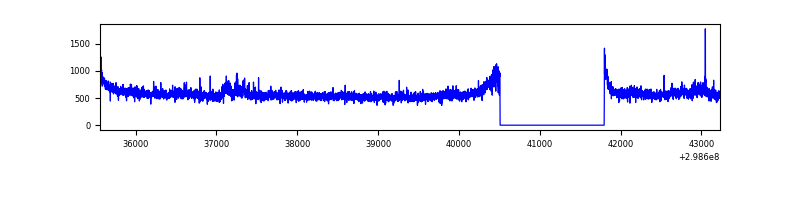 |
| D | 7671 | 6381 | 106 | 106 | 1.38% | 1.66% | 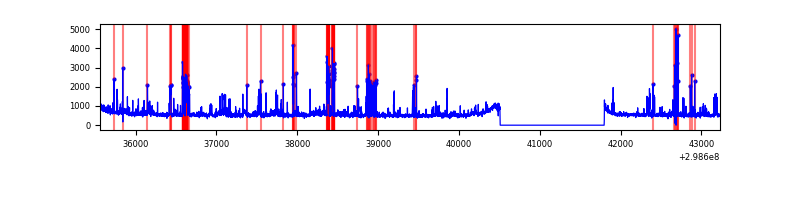 |
Top three noisy pixels from each quadrant. If the there are fewer than three noisy pixels in the level2.evt file, extra rows are filled as -1
| Pixel properties | Quadrant properties | ||||||
|---|---|---|---|---|---|---|---|
| Quadrant | DetID | PixID | Counts | Sigma | Mean | Median | Sigma |
| A | 14 | 238 | 862857 | 4842.74 | 895 | 882 | 178.0 |
| A | 11 | 29 | 12606 | 65.87 | 895 | 882 | 178.0 |
| A | 0 | 226 | 7737 | 38.51 | 895 | 882 | 178.0 |
| B | 10 | 245 | 35929 | 209.84 | 897 | 880 | 167.0 |
| B | 0 | 183 | 35198 | 205.47 | 897 | 880 | 167.0 |
| B | 0 | 214 | 27298 | 158.17 | 897 | 880 | 167.0 |
| C | 3 | 233 | 210283 | 1062.8 | 856 | 866 | 197.0 |
| C | 14 | 238 | 136989 | 690.83 | 856 | 866 | 197.0 |
| C | 8 | 208 | 9138 | 41.98 | 856 | 866 | 197.0 |
| D | 1 | 52 | 632030 | 3018.32 | 877 | 855 | 209.1 |
| D | 2 | 153 | 127968 | 607.86 | 877 | 855 | 209.1 |
| D | 2 | 234 | 24405 | 112.62 | 877 | 855 | 209.1 |
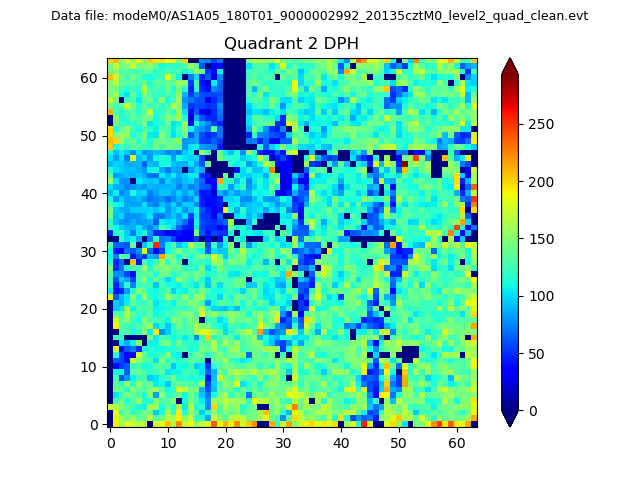
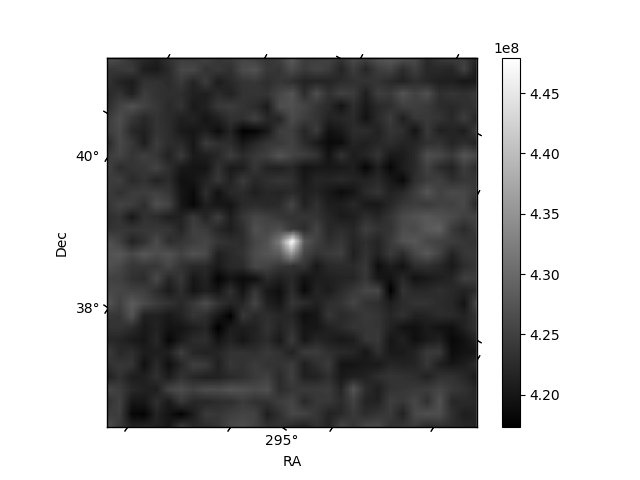
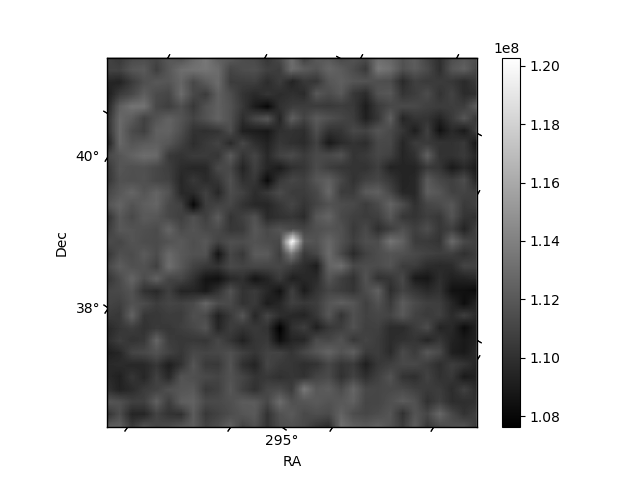
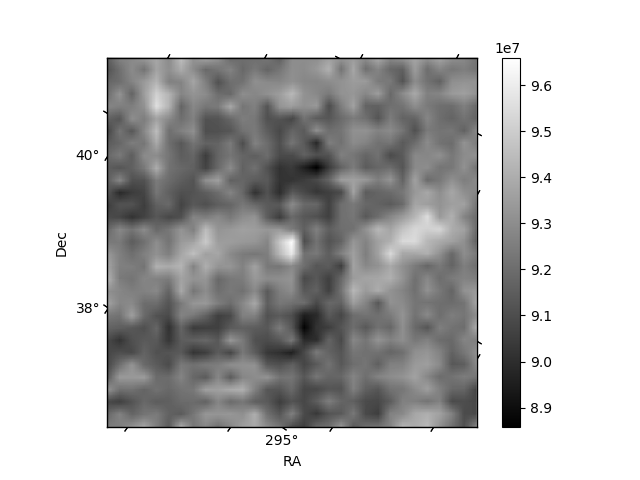
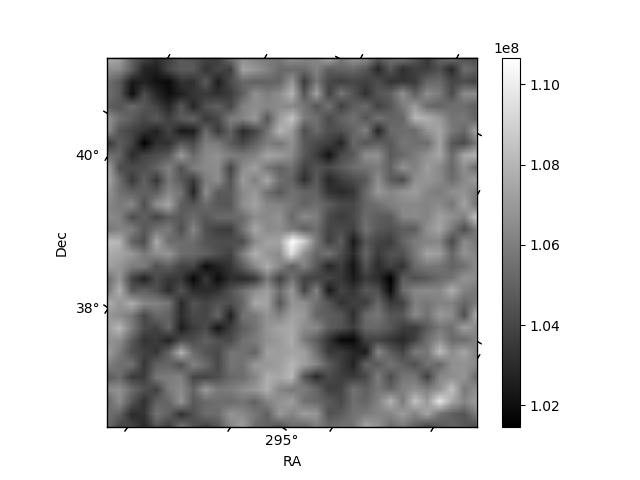
Histogram calculated using DETX and DETY for each event in the final _common_clean file
| Quadrant A | 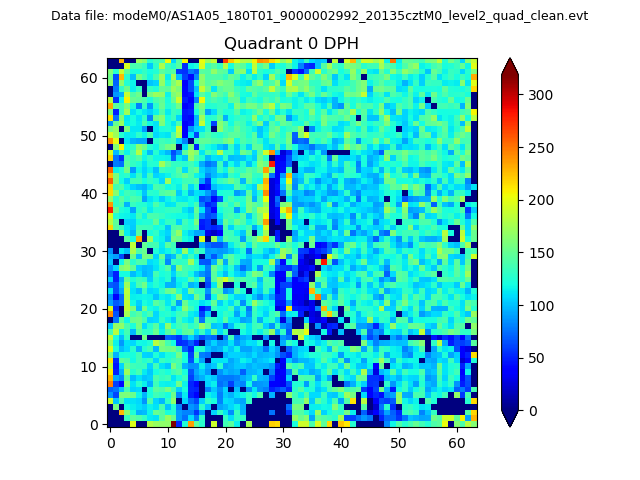 |
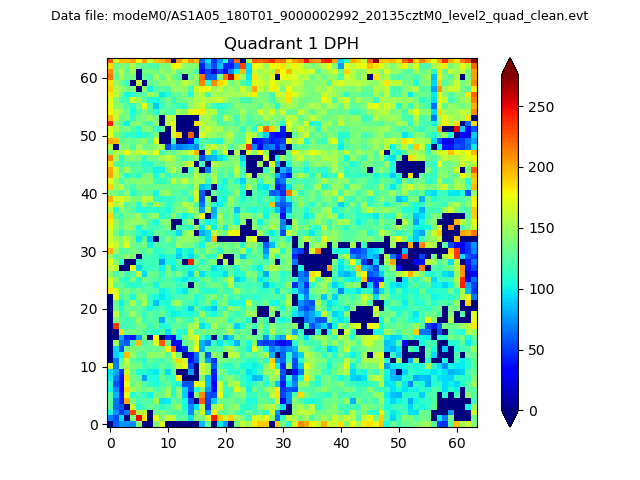 |
Quadrant B |
|---|---|---|---|
| Quadrant D | 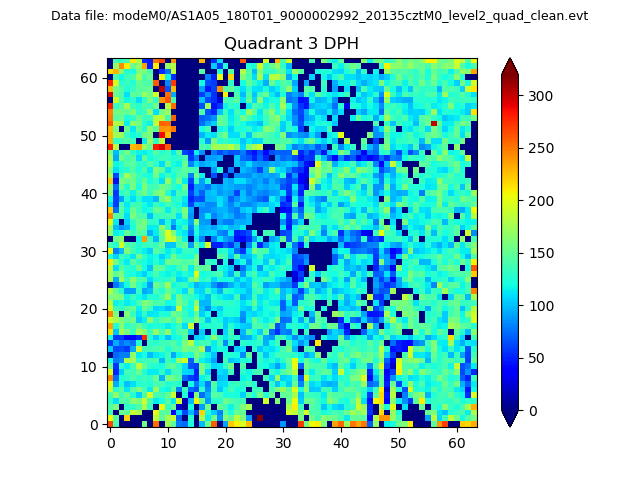 |
 |
Quadrant C |
| Plot type | Count rate plots | Images |
|---|---|---|
| Comparison with Poisson distribution Blue bars denote a histogram of data divided into 1 sec bins. Red curve is a Poisson curve with rate = median count rate of data. |
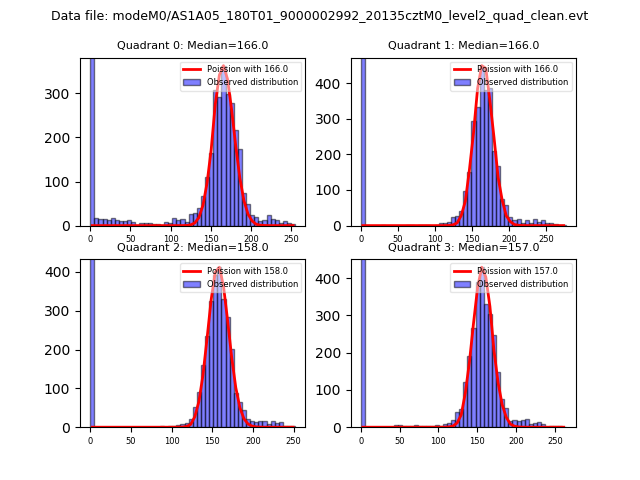 |
 |
| Quadrant-wise count rates Data is divided into 100 sec bins |
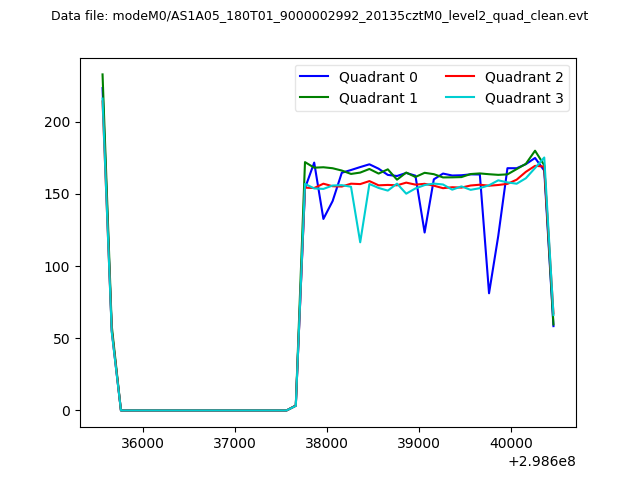 |
|
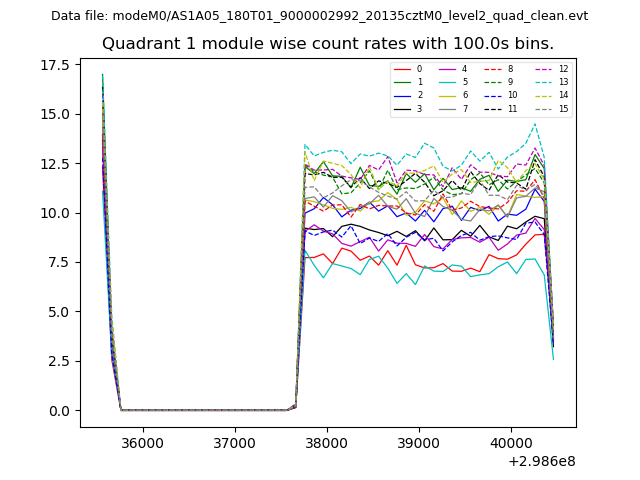
| Module-wise count rates for Quadrant A Data is divided into 100 sec bins |
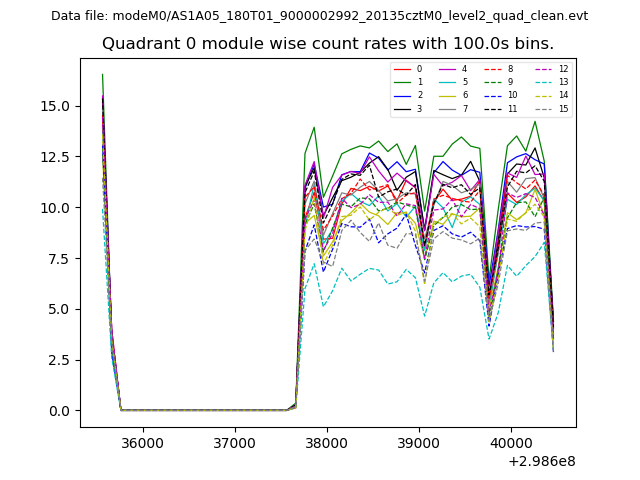 |
 |
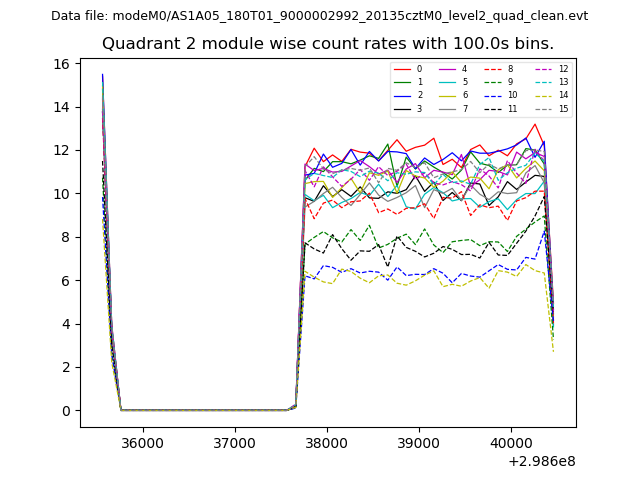
| Module-wise count rates for Quadrant B Data is divided into 100 sec bins |
 |
 |
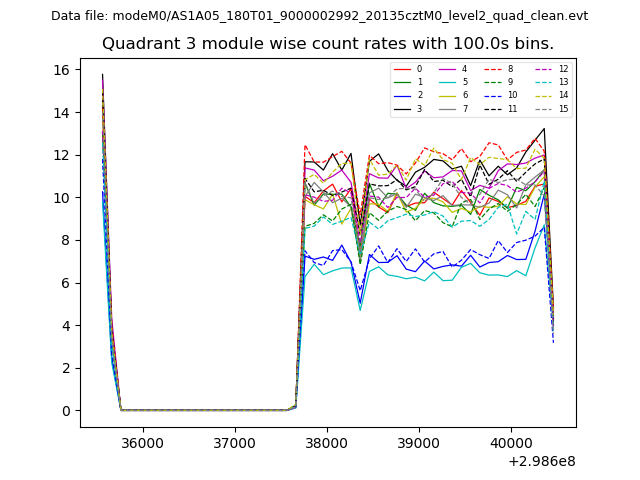
| Module-wise count rates for Quadrant C Data is divided into 100 sec bins |
 |
 |
| Module-wise count rates for Quadrant D Data is divided into 100 sec bins |
 |
 |
| Parameter | Plot |
|---|---|
| CZT HV Monitor | 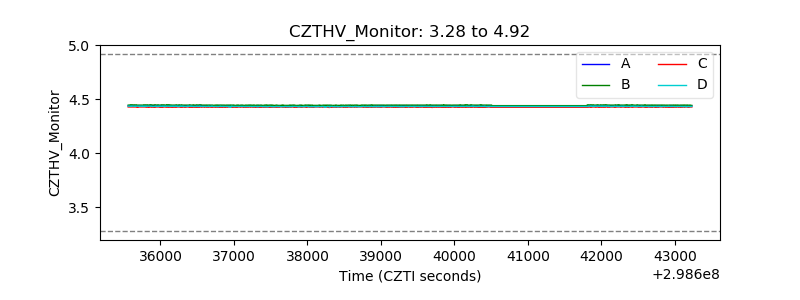 |
| D_VDD |  |
| Temperature 1 | 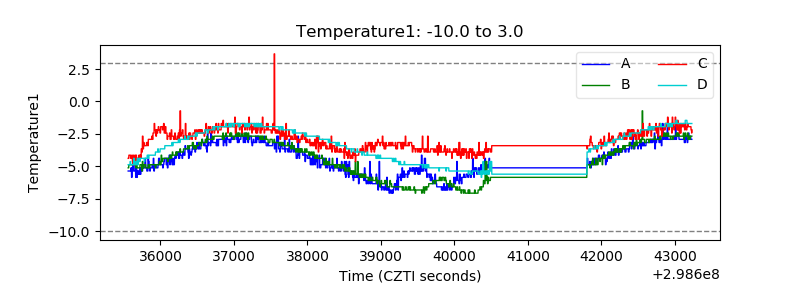 |
| Veto HV Monitor | 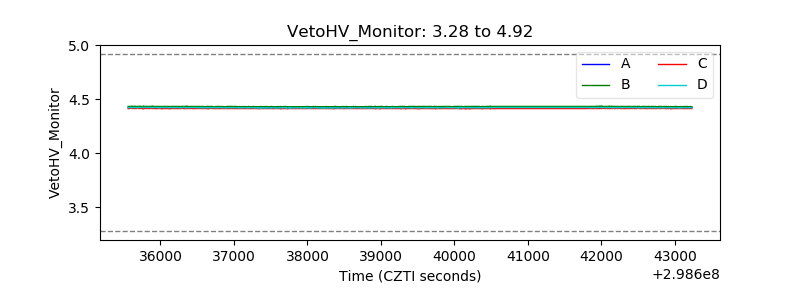 |
| Veto LLD | 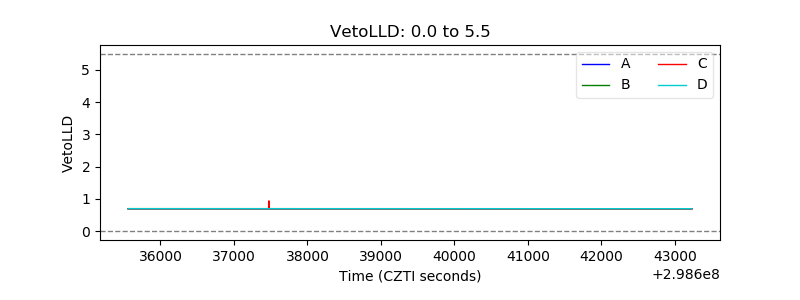 |
| Alpha Counter | 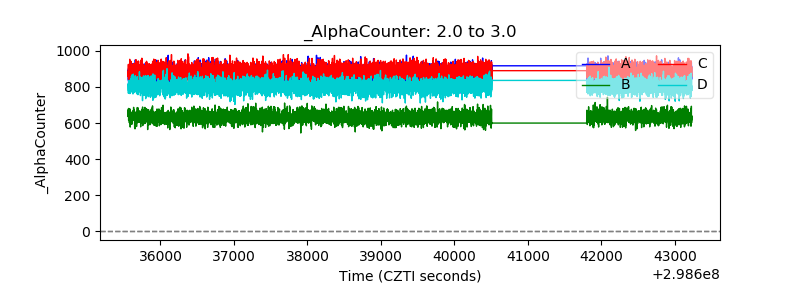 |
| _CPM_Rate | 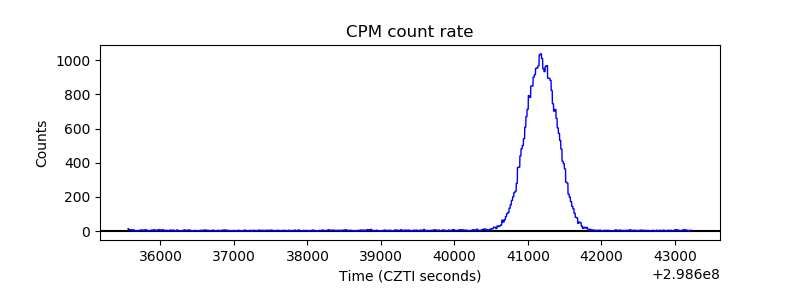 |
| CZT Counter | 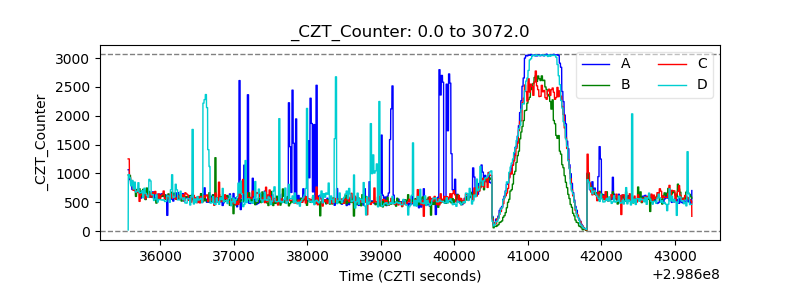 |
| +2.5 Volts monitor |  |
| +5 Volts monitor |  |
| _ROLL_ROT | 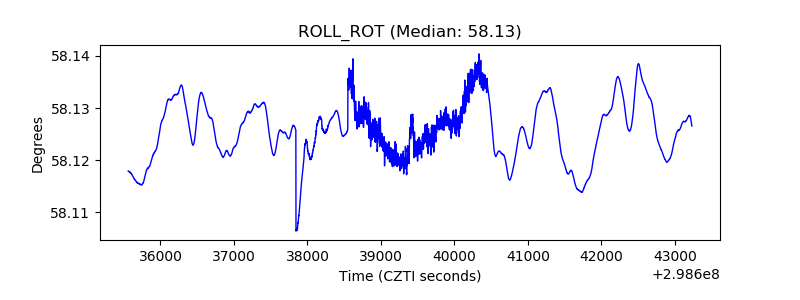 |
| _Roll_DEC | 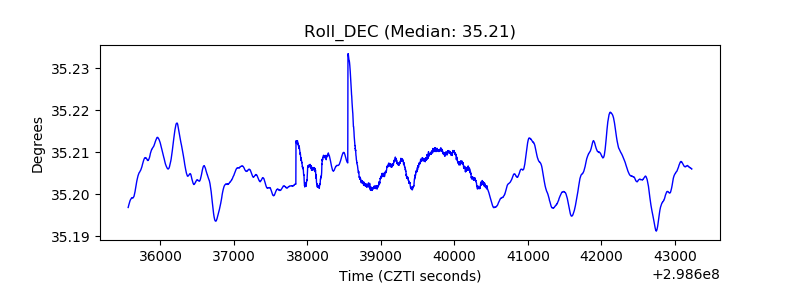 |
| _Roll_RA | 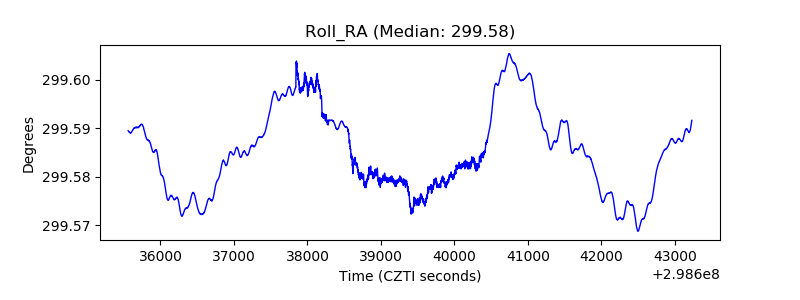 |
| Veto Counter | 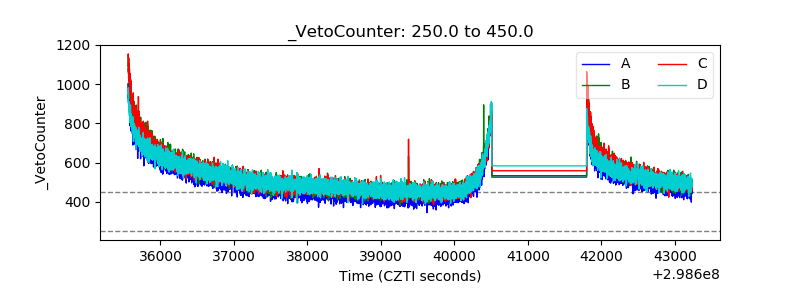 |