| Param | Original file | Final file |
|---|---|---|
| Filename | modeM0/AS1A05_180T01_9000002992_20136cztM0_level2.evt | modeM0/AS1A05_180T01_9000002992_20136cztM0_level2_quad_clean.evt |
| Size (bytes) | 524,151,360 | 85,651,200 |
| Size | 499.9 MB | 81.7 MB |
| Events in quadrant A | 3,966,775 | 542,762 |
| Events in quadrant B | 3,651,110 | 550,726 |
| Events in quadrant C | 3,787,662 | 523,430 |
| Events in quadrant D | 4,016,530 | 512,257 |
| Mode M9 | |||
|---|---|---|---|
| Quadrant | BADHDUFLAG | Total packets | Discarded packets |
| A | 0 | 13 | 0 |
| B | 0 | 14 | 0 |
| C | 0 | 14 | 0 |
| D | 0 | 14 | 0 |
| Mode M0 | |||
|---|---|---|---|
| Quadrant | BADHDUFLAG | Total packets | Discarded packets |
| A | 0 | 15677 | 2 |
| B | 0 | 14739 | 2 |
| C | 0 | 15140 | 2 |
| D | 0 | 15948 | 2 |
| Mode SS | |||
|---|---|---|---|
| Quadrant | BADHDUFLAG | Total packets | Discarded packets |
| A | 0 | 134 | 0 |
| B | 0 | 134 | 0 |
| C | 0 | 134 | 0 |
| D | 0 | 134 | 0 |
| Quadrant | Total seconds | Saturated seconds | Saturation percentage |
|---|---|---|---|
| A | 6664 | 292 | 4.381753% |
| B | 6664 | 159 | 2.385954% |
| C | 6664 | 196 | 2.941176% |
| D | 6664 | 259 | 3.886555% |
Noise dominated data is calculated using 1-second bins in cleaned event files. If a bin has >2000 counts, and if more than 50% of those come from <1% of pixels, then it is considered to be noise-dominated and hence unusable.
| Quadrant | # 1 sec bins | Bins with >0 counts | Bins with >2000 counts | High rate bins dominated by noise | Noise dominated (total time) | Noise dominated (detector-on time) | Marked lightcurve |
|---|---|---|---|---|---|---|---|
| A | 7719 | 6665 | 98 | 98 | 1.27% | 1.47% | 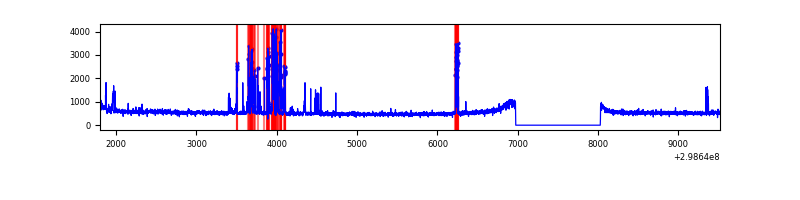 |
| B | 7719 | 6665 | 0 | 0 | 0.00% | 0.00% | 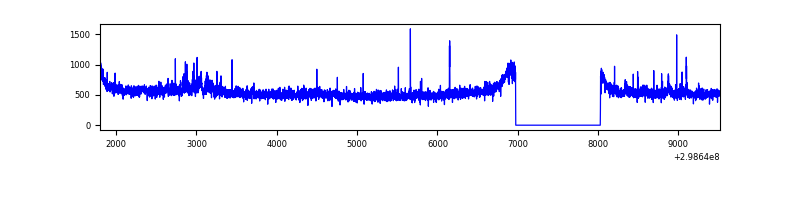 |
| C | 7719 | 6665 | 0 | 0 | 0.00% | 0.00% | 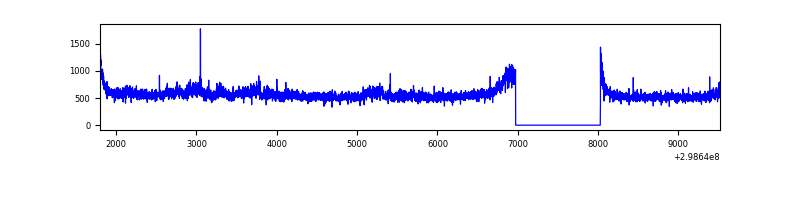 |
| D | 7719 | 6664 | 127 | 127 | 1.65% | 1.91% | 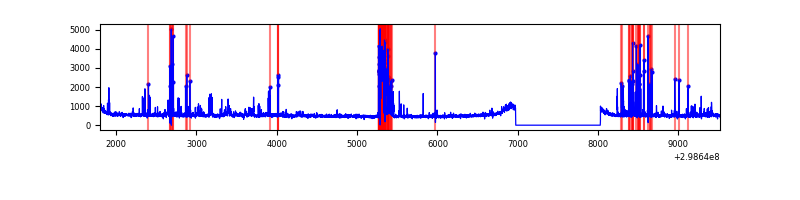 |
Top three noisy pixels from each quadrant. If the there are fewer than three noisy pixels in the level2.evt file, extra rows are filled as -1
| Pixel properties | Quadrant properties | ||||||
|---|---|---|---|---|---|---|---|
| Quadrant | DetID | PixID | Counts | Sigma | Mean | Median | Sigma |
| A | 14 | 238 | 447169 | 2468.09 | 907 | 893 | 180.8 |
| A | 14 | 237 | 20964 | 111.0 | 907 | 893 | 180.8 |
| A | 11 | 29 | 9865 | 49.62 | 907 | 893 | 180.8 |
| B | 10 | 245 | 53408 | 310.23 | 901 | 885 | 169.3 |
| B | 0 | 183 | 24493 | 139.44 | 901 | 885 | 169.3 |
| B | 12 | 111 | 20265 | 114.47 | 901 | 885 | 169.3 |
| C | 3 | 233 | 269936 | 1341.61 | 864 | 873 | 200.6 |
| C | 14 | 238 | 136007 | 673.81 | 864 | 873 | 200.6 |
| C | 8 | 208 | 11719 | 54.08 | 864 | 873 | 200.6 |
| D | 12 | 238 | 305274 | 1423.2 | 881 | 860 | 213.9 |
| D | 1 | 52 | 290371 | 1353.53 | 881 | 860 | 213.9 |
| D | 13 | 249 | 33067 | 150.57 | 881 | 860 | 213.9 |
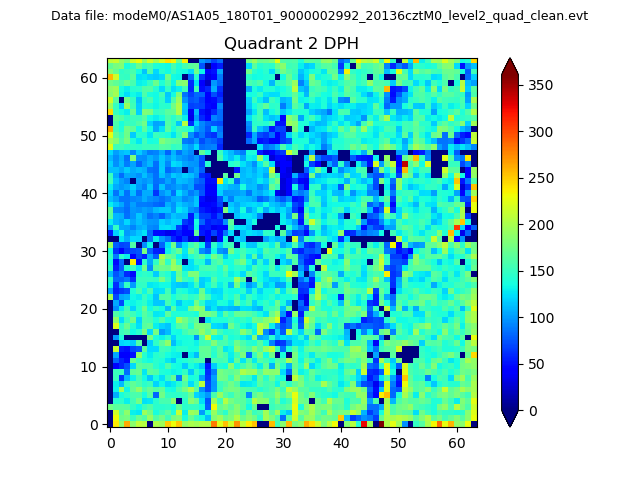
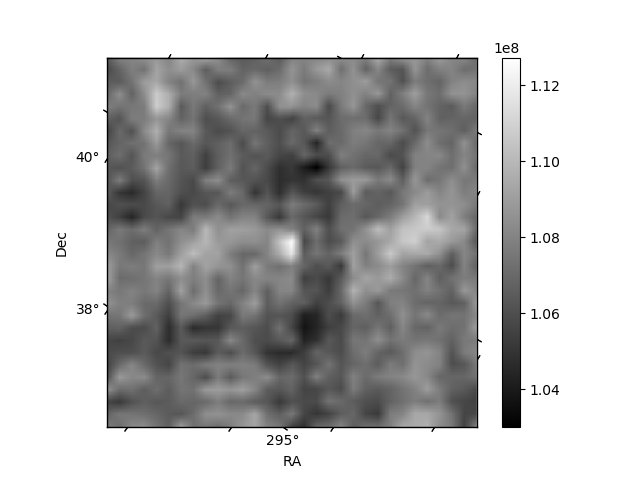
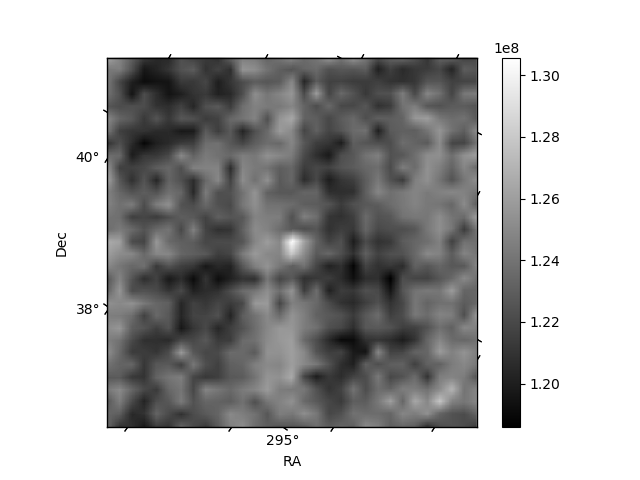
Histogram calculated using DETX and DETY for each event in the final _common_clean file
| Quadrant A | 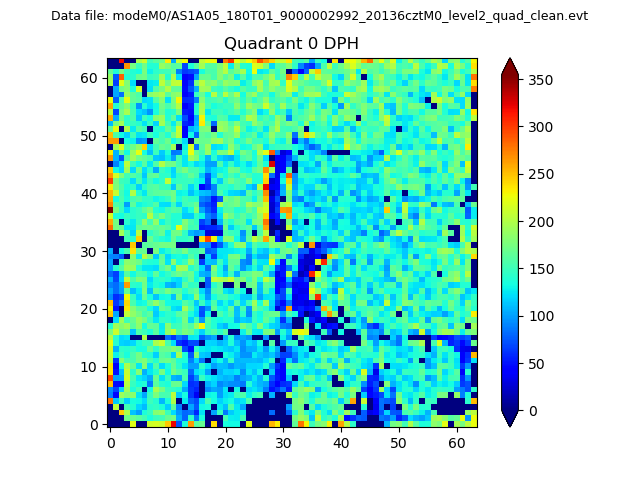 |
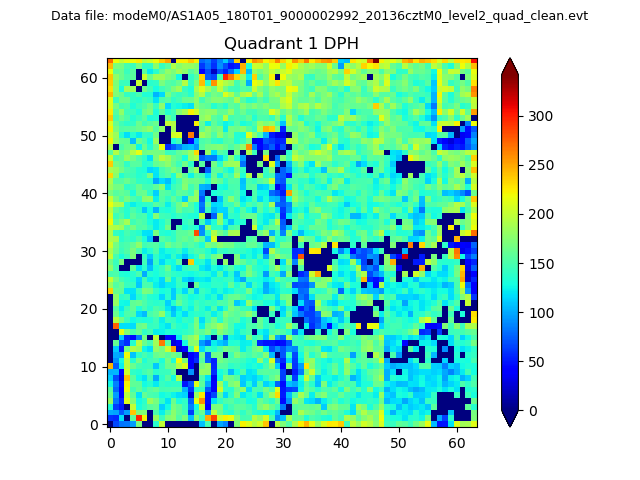 |
Quadrant B |
|---|---|---|---|
| Quadrant D | 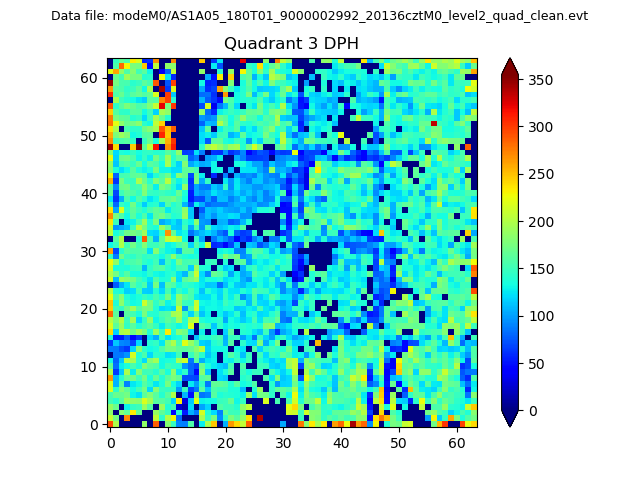 |
 |
Quadrant C |
| Plot type | Count rate plots | Images |
|---|---|---|
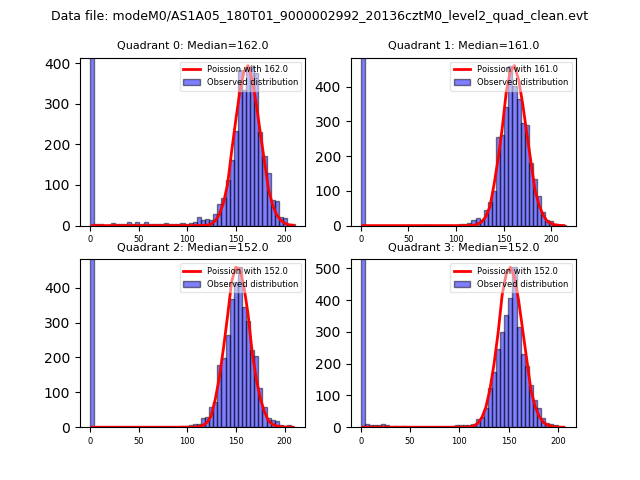
| Comparison with Poisson distribution Blue bars denote a histogram of data divided into 1 sec bins. Red curve is a Poisson curve with rate = median count rate of data. |
 |
 |
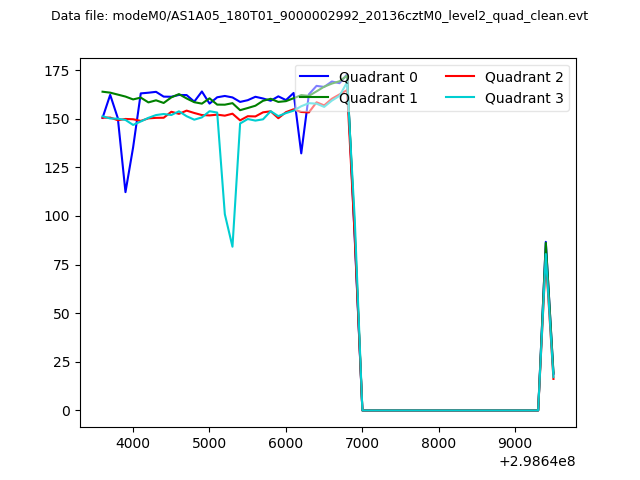
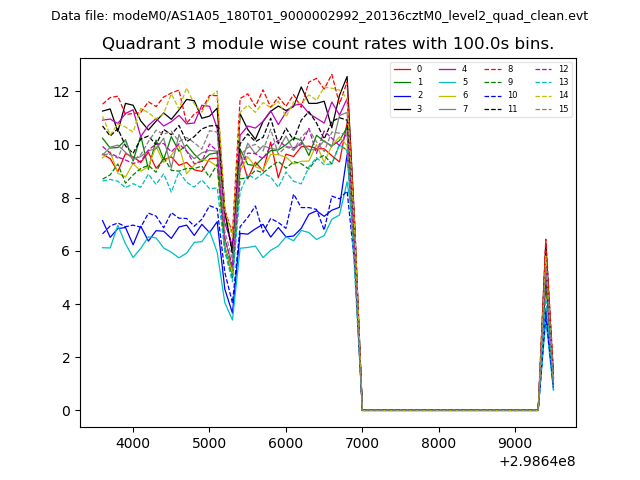
| Quadrant-wise count rates Data is divided into 100 sec bins |
 |
|
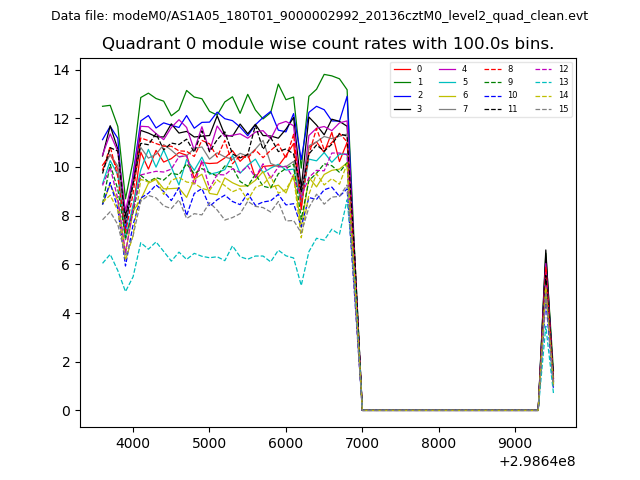
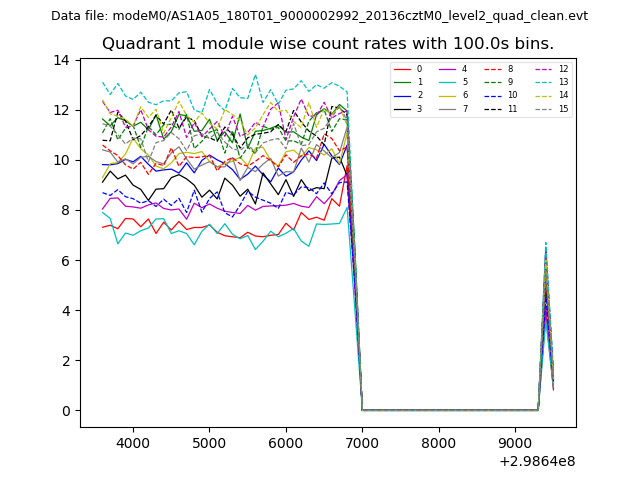
| Module-wise count rates for Quadrant A Data is divided into 100 sec bins |
 |
 |
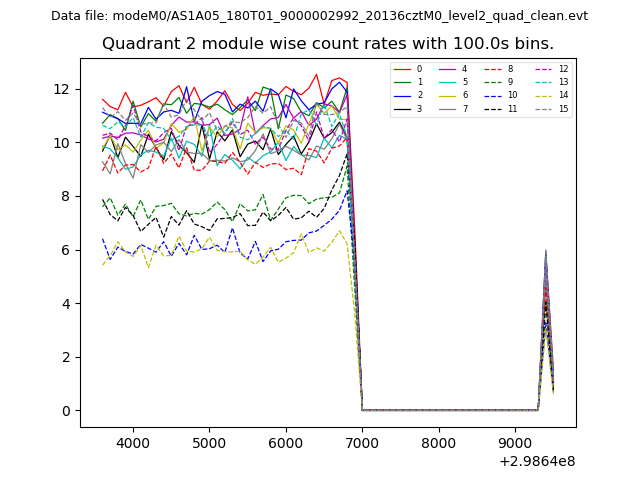
| Module-wise count rates for Quadrant B Data is divided into 100 sec bins |
 |
 |
| Module-wise count rates for Quadrant C Data is divided into 100 sec bins |
 |
 |
| Module-wise count rates for Quadrant D Data is divided into 100 sec bins |
 |
 |
| Parameter | Plot |
|---|---|
| CZT HV Monitor | 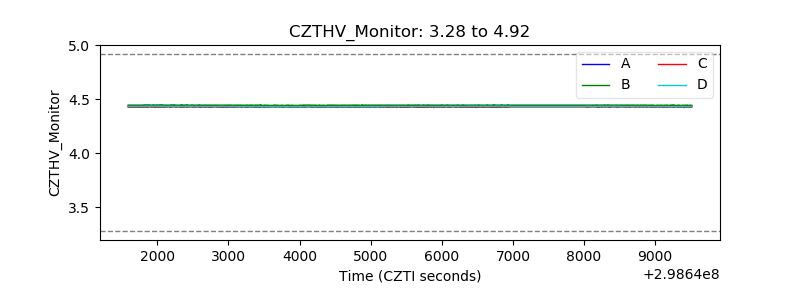 |
| D_VDD | 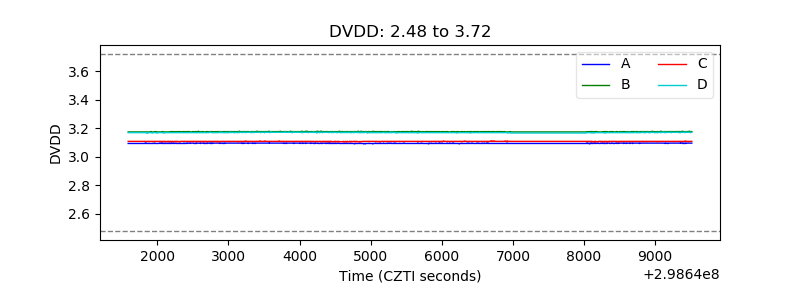 |
| Temperature 1 | 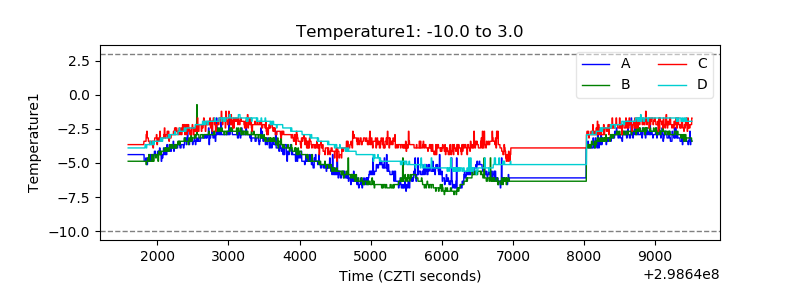 |
| Veto HV Monitor | 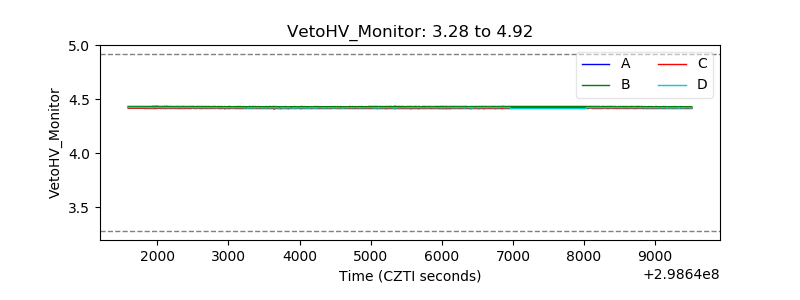 |
| Veto LLD | 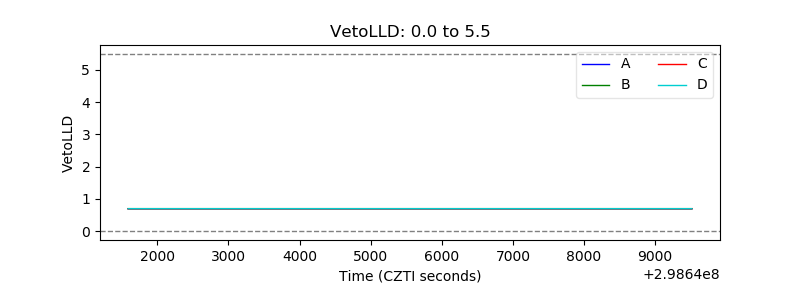 |
| Alpha Counter | 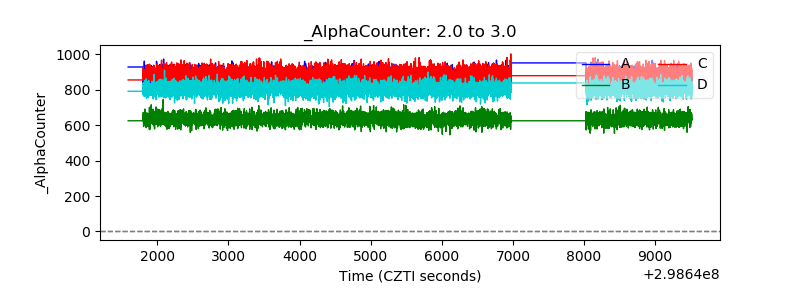 |
| _CPM_Rate | 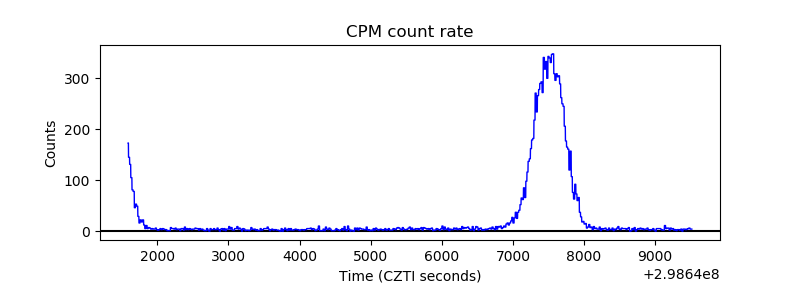 |
| CZT Counter | 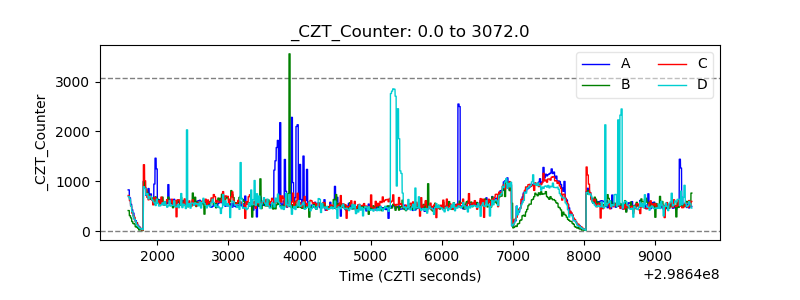 |
| +2.5 Volts monitor |  |
| +5 Volts monitor | 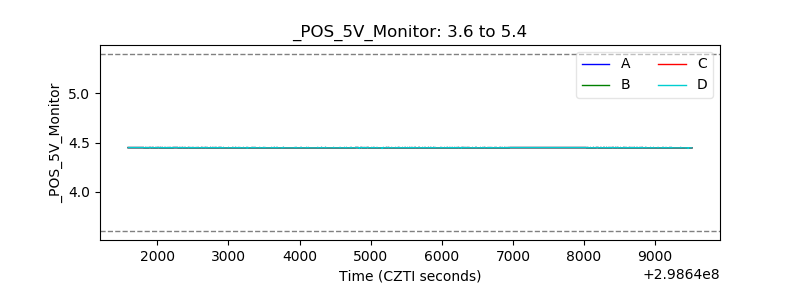 |
| _ROLL_ROT | 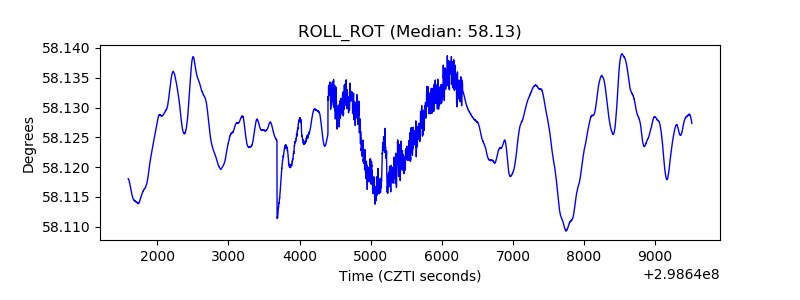 |
| _Roll_DEC | 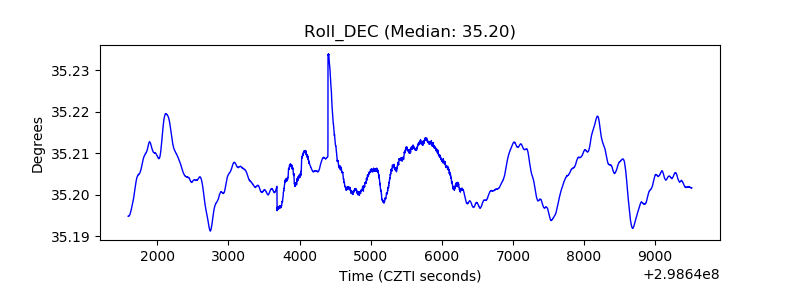 |
| _Roll_RA | 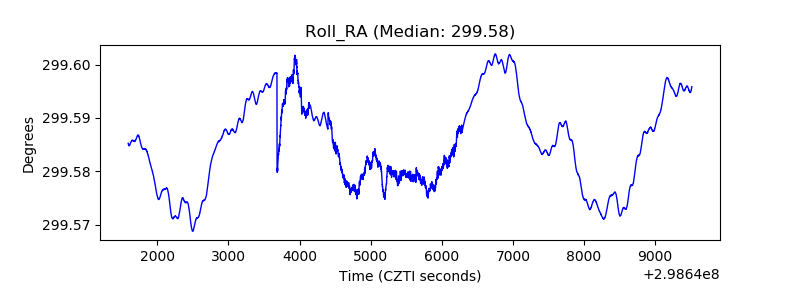 |
| Veto Counter | 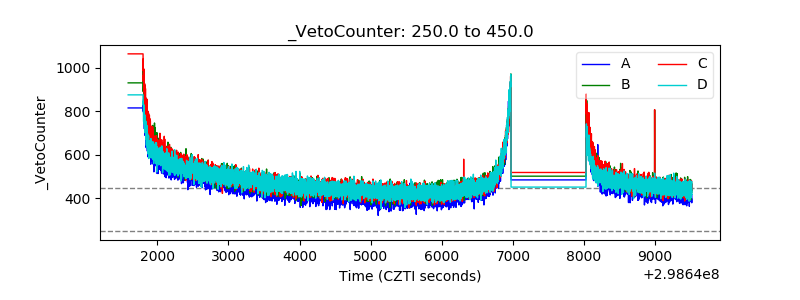 |