| Param | Original file | Final file |
|---|---|---|
| Filename | modeM0/AS1A05_180T01_9000002992_20137cztM0_level2.evt | modeM0/AS1A05_180T01_9000002992_20137cztM0_level2_quad_clean.evt |
| Size (bytes) | 541,460,160 | 96,863,040 |
| Size | 516.4 MB | 92.4 MB |
| Events in quadrant A | 3,965,814 | 631,959 |
| Events in quadrant B | 4,373,031 | 616,593 |
| Events in quadrant C | 3,647,180 | 603,745 |
| Events in quadrant D | 3,944,989 | 601,210 |
| Mode M9 | |||
|---|---|---|---|
| Quadrant | BADHDUFLAG | Total packets | Discarded packets |
| A | 0 | 13 | 0 |
| B | 0 | 14 | 0 |
| C | 0 | 14 | 0 |
| D | 0 | 14 | 0 |
| Mode M0 | |||
|---|---|---|---|
| Quadrant | BADHDUFLAG | Total packets | Discarded packets |
| A | 0 | 15896 | 4 |
| B | 0 | 17107 | 2 |
| C | 0 | 14661 | 2 |
| D | 0 | 16100 | 2 |
| Mode SS | |||
|---|---|---|---|
| Quadrant | BADHDUFLAG | Total packets | Discarded packets |
| A | 0 | 142 | 0 |
| B | 0 | 142 | 0 |
| C | 0 | 142 | 0 |
| D | 0 | 142 | 0 |
| Quadrant | Total seconds | Saturated seconds | Saturation percentage |
|---|---|---|---|
| A | 6880 | 199 | 2.892442% |
| B | 6880 | 434 | 6.308140% |
| C | 6880 | 112 | 1.627907% |
| D | 6880 | 128 | 1.860465% |
Noise dominated data is calculated using 1-second bins in cleaned event files. If a bin has >2000 counts, and if more than 50% of those come from <1% of pixels, then it is considered to be noise-dominated and hence unusable.
| Quadrant | # 1 sec bins | Bins with >0 counts | Bins with >2000 counts | High rate bins dominated by noise | Noise dominated (total time) | Noise dominated (detector-on time) | Marked lightcurve |
|---|---|---|---|---|---|---|---|
| A | 7660 | 6881 | 80 | 80 | 1.04% | 1.16% | 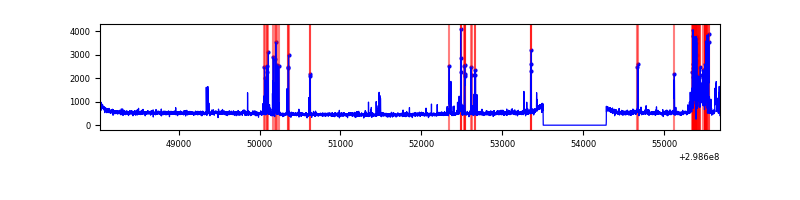 |
| B | 7660 | 6881 | 240 | 240 | 3.13% | 3.49% |  |
| C | 7660 | 6881 | 0 | 0 | 0.00% | 0.00% | 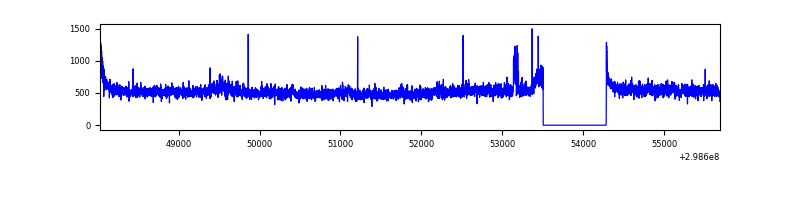 |
| D | 7660 | 6881 | 67 | 67 | 0.87% | 0.97% | 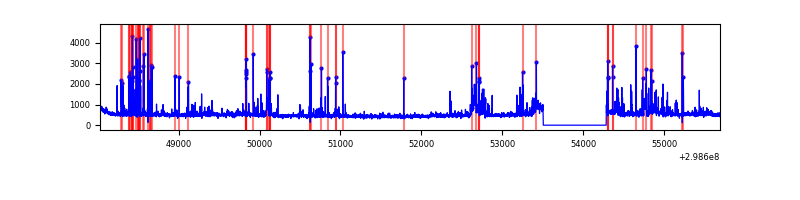 |
Top three noisy pixels from each quadrant. If the there are fewer than three noisy pixels in the level2.evt file, extra rows are filled as -1
| Pixel properties | Quadrant properties | ||||||
|---|---|---|---|---|---|---|---|
| Quadrant | DetID | PixID | Counts | Sigma | Mean | Median | Sigma |
| A | 14 | 238 | 409001 | 2264.87 | 890 | 876 | 180.2 |
| A | 15 | 192 | 122895 | 677.14 | 890 | 876 | 180.2 |
| A | 14 | 237 | 8916 | 44.62 | 890 | 876 | 180.2 |
| B | 10 | 245 | 932998 | 5646.94 | 865 | 847 | 165.1 |
| B | 0 | 183 | 32489 | 191.68 | 865 | 847 | 165.1 |
| B | 12 | 111 | 19393 | 112.35 | 865 | 847 | 165.1 |
| C | 3 | 233 | 136450 | 689.41 | 847 | 853 | 196.7 |
| C | 14 | 238 | 132928 | 671.51 | 847 | 853 | 196.7 |
| C | 8 | 208 | 62477 | 313.31 | 847 | 853 | 196.7 |
| D | 1 | 52 | 599525 | 2867.0 | 863 | 842 | 208.8 |
| D | 13 | 249 | 31676 | 147.66 | 863 | 842 | 208.8 |
| D | 2 | 234 | 27675 | 128.5 | 863 | 842 | 208.8 |
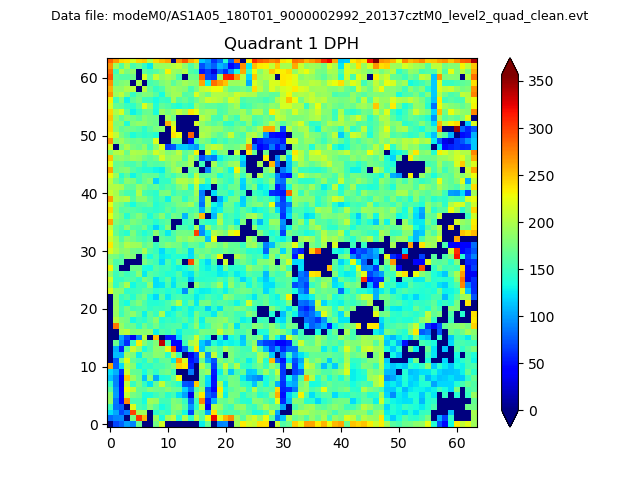
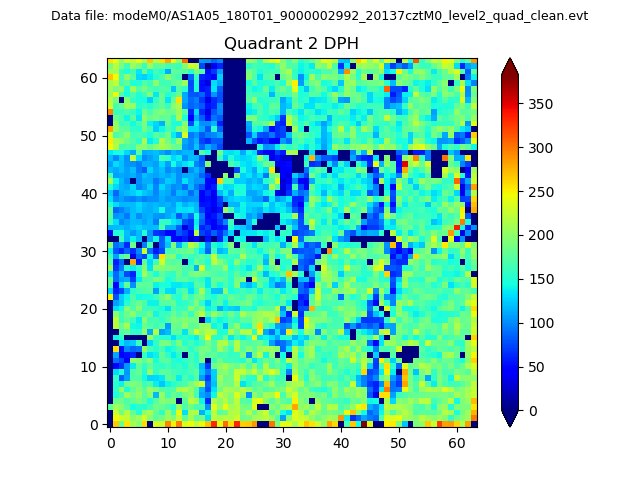
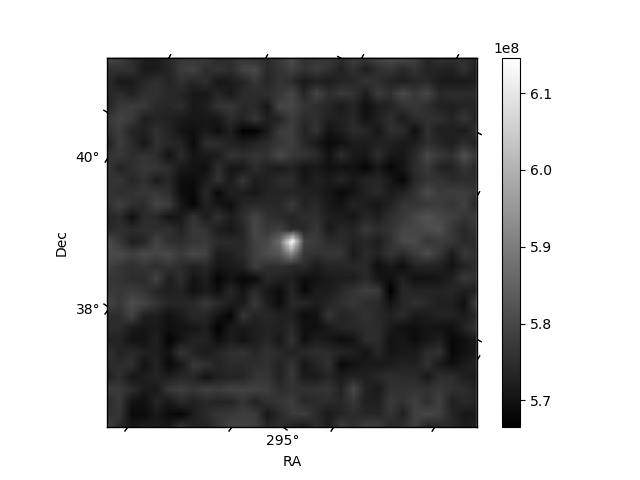
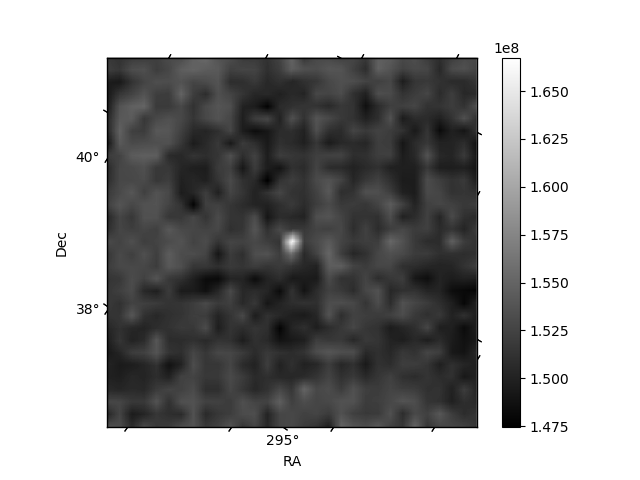
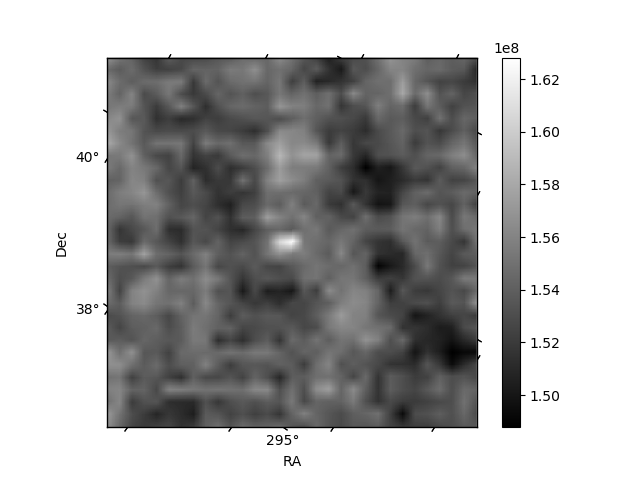
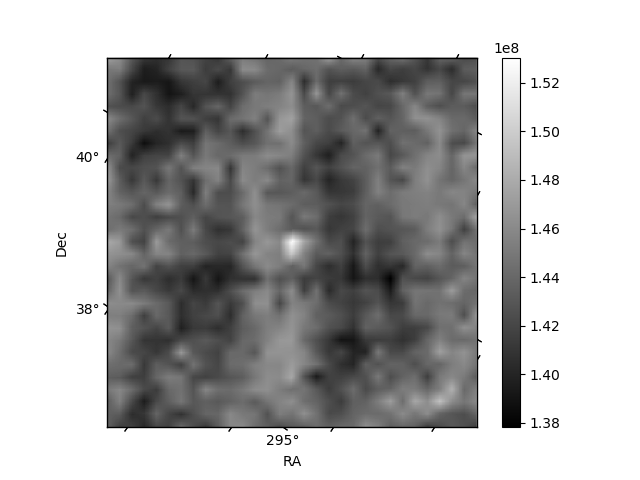
Histogram calculated using DETX and DETY for each event in the final _common_clean file
| Quadrant A | 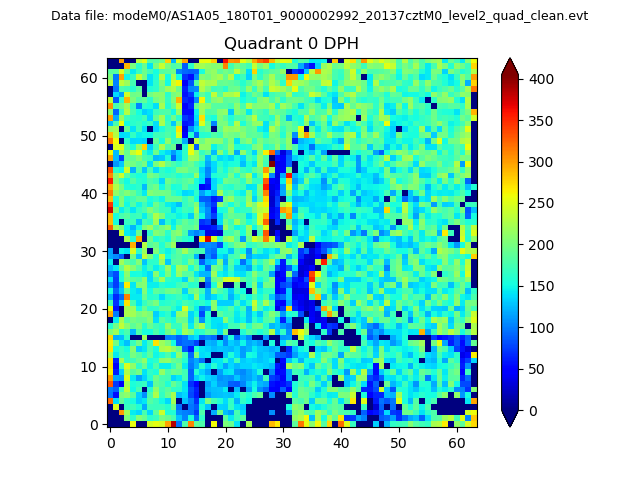 |
 |
Quadrant B |
|---|---|---|---|
| Quadrant D | 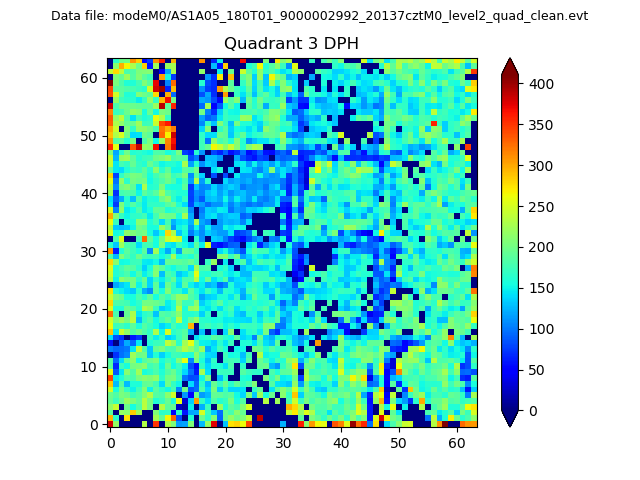 |
 |
Quadrant C |
| Plot type | Count rate plots | Images |
|---|---|---|
| Comparison with Poisson distribution Blue bars denote a histogram of data divided into 1 sec bins. Red curve is a Poisson curve with rate = median count rate of data. |
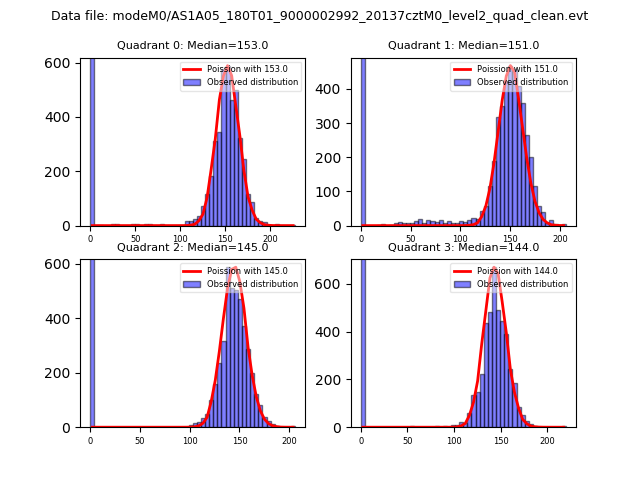 |
 |
| Quadrant-wise count rates Data is divided into 100 sec bins |
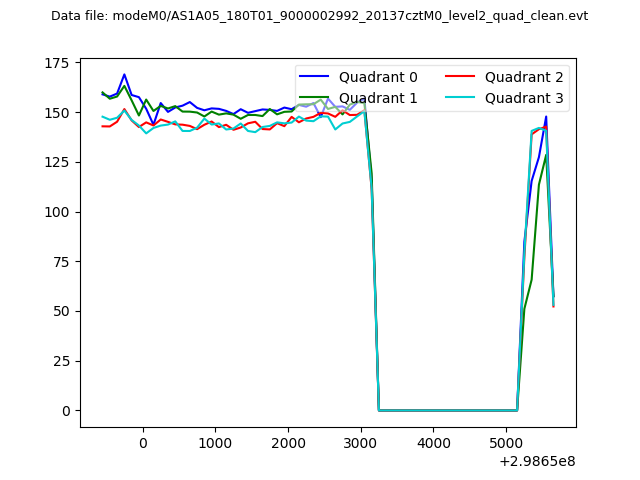 |
|
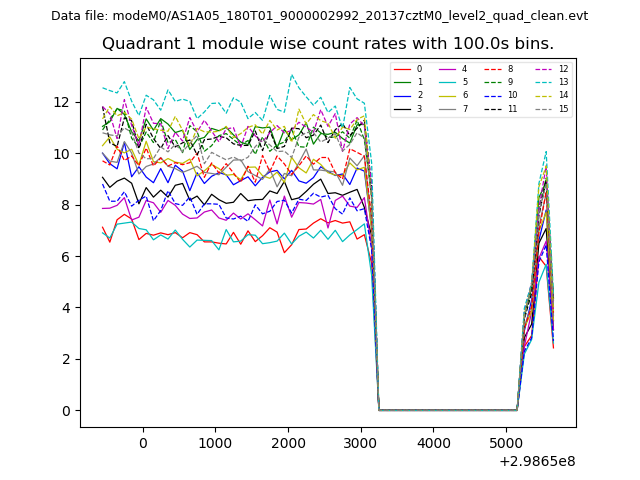
| Module-wise count rates for Quadrant A Data is divided into 100 sec bins |
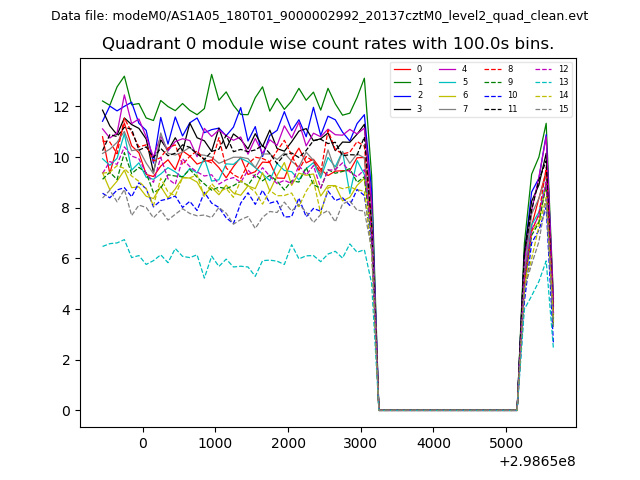 |
 |
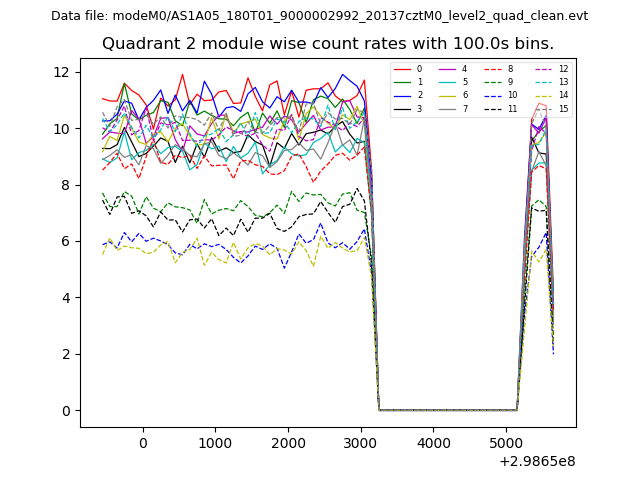
| Module-wise count rates for Quadrant B Data is divided into 100 sec bins |
 |
 |
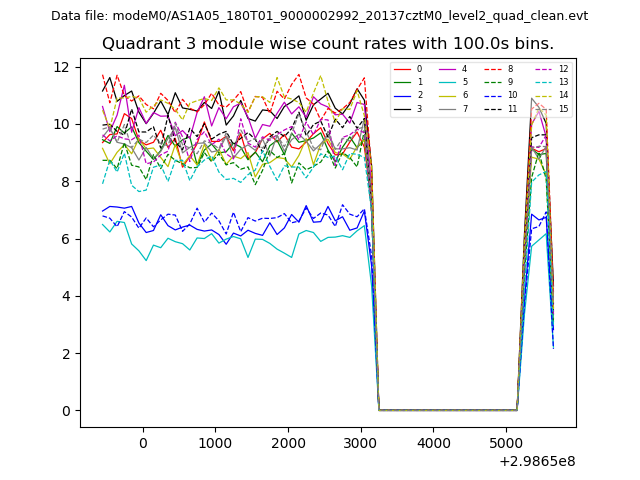
| Module-wise count rates for Quadrant C Data is divided into 100 sec bins |
 |
 |
| Module-wise count rates for Quadrant D Data is divided into 100 sec bins |
 |
 |
| Parameter | Plot |
|---|---|
| CZT HV Monitor | 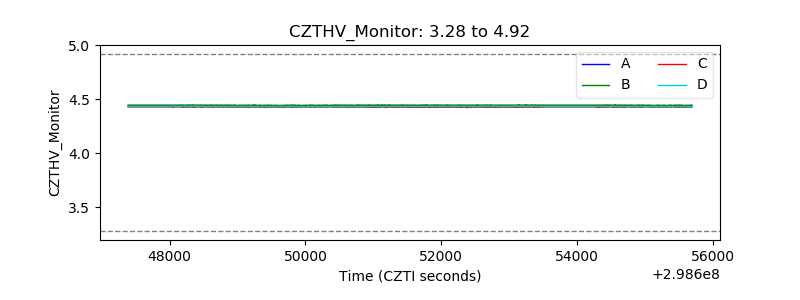 |
| D_VDD | 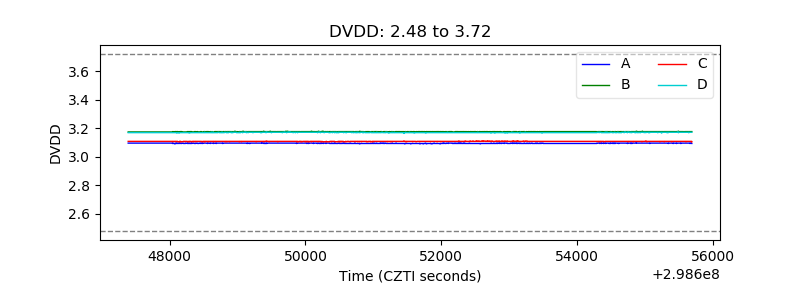 |
| Temperature 1 |  |
| Veto HV Monitor | 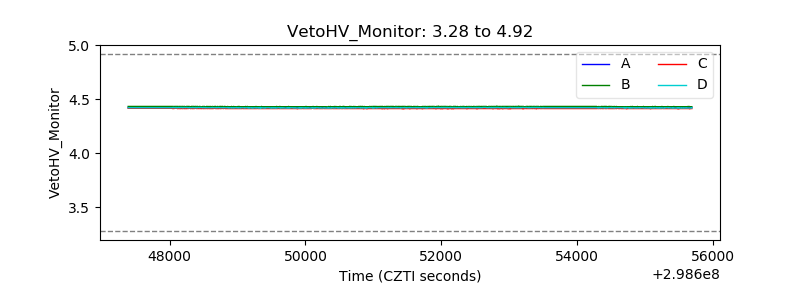 |
| Veto LLD | 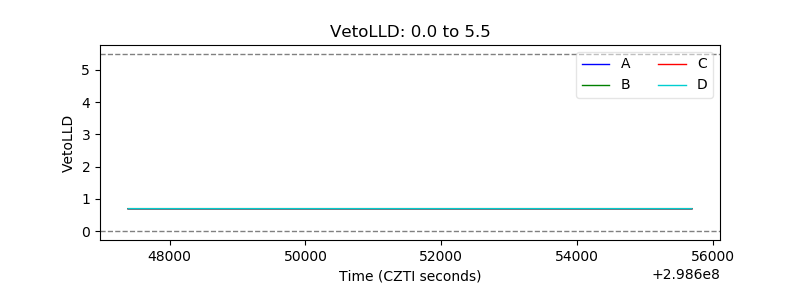 |
| Alpha Counter | 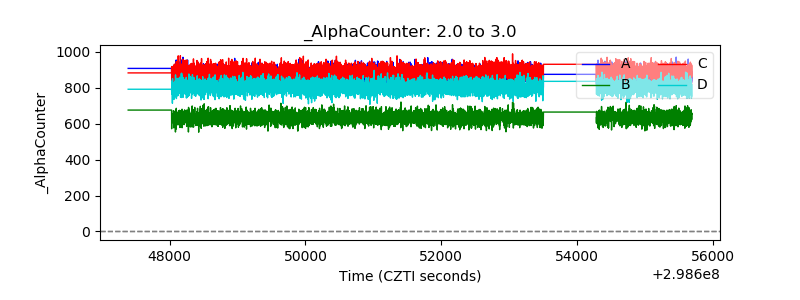 |
| _CPM_Rate | 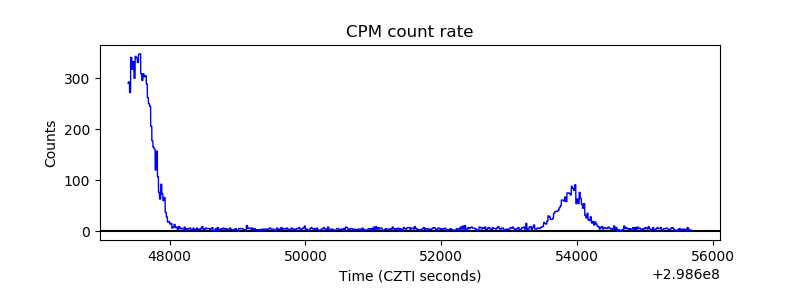 |
| CZT Counter | 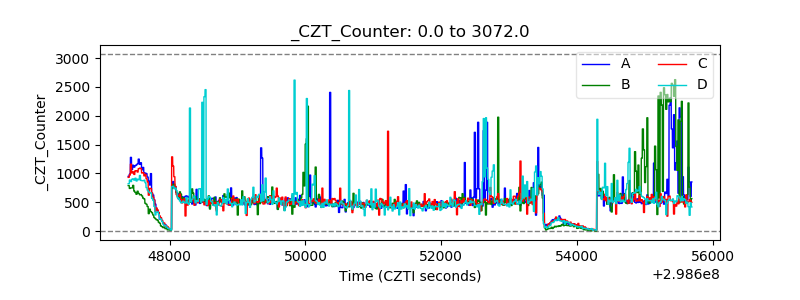 |
| +2.5 Volts monitor | 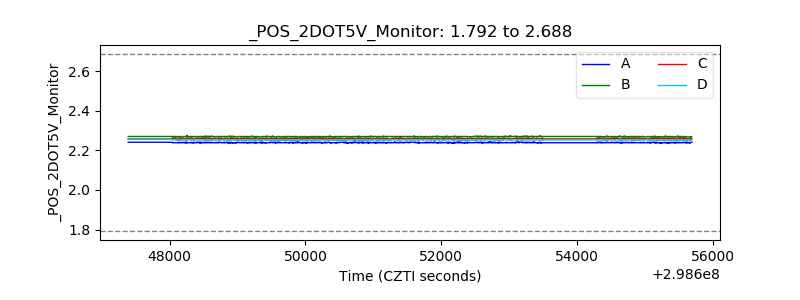 |
| +5 Volts monitor |  |
| _ROLL_ROT | 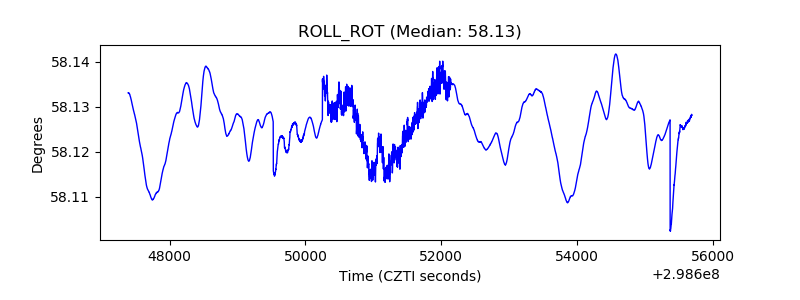 |
| _Roll_DEC | 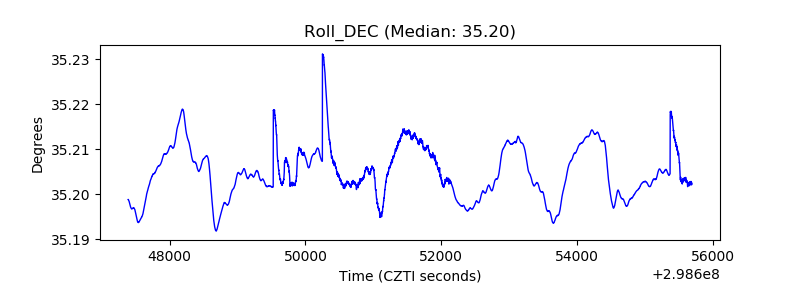 |
| _Roll_RA | 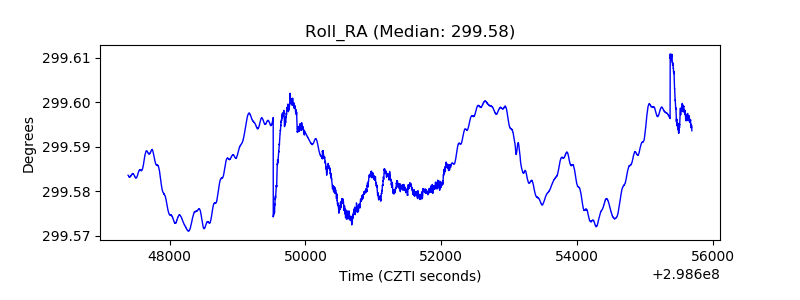 |
| Veto Counter | 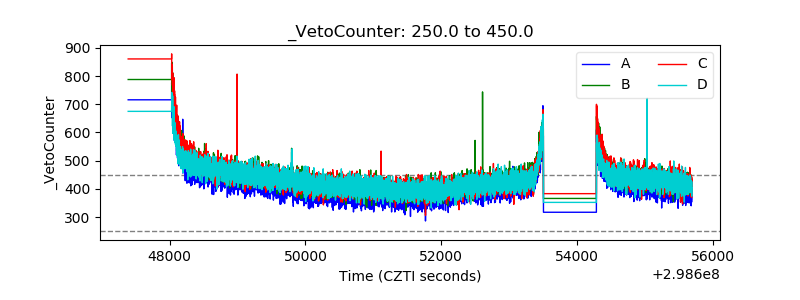 |