| Param | Original file | Final file |
|---|---|---|
| Filename | modeM0/AS1A05_180T01_9000002992_20138cztM0_level2.evt | modeM0/AS1A05_180T01_9000002992_20138cztM0_level2_quad_clean.evt |
| Size (bytes) | 650,332,800 | 101,952,000 |
| Size | 620.2 MB | 97.2 MB |
| Events in quadrant A | 5,264,863 | 630,744 |
| Events in quadrant B | 5,848,570 | 646,543 |
| Events in quadrant C | 3,963,948 | 642,513 |
| Events in quadrant D | 4,103,772 | 639,328 |
| Mode M9 | |||
|---|---|---|---|
| Quadrant | BADHDUFLAG | Total packets | Discarded packets |
| A | 0 | 10 | 0 |
| B | 0 | 10 | 0 |
| C | 0 | 10 | 0 |
| D | 0 | 10 | 0 |
| Mode M0 | |||
|---|---|---|---|
| Quadrant | BADHDUFLAG | Total packets | Discarded packets |
| A | 0 | 20370 | 2 |
| B | 0 | 22146 | 2 |
| C | 0 | 16286 | 2 |
| D | 0 | 17226 | 2 |
| Mode SS | |||
|---|---|---|---|
| Quadrant | BADHDUFLAG | Total packets | Discarded packets |
| A | 0 | 158 | 0 |
| B | 0 | 158 | 0 |
| C | 0 | 158 | 0 |
| D | 0 | 158 | 0 |
| Quadrant | Total seconds | Saturated seconds | Saturation percentage |
|---|---|---|---|
| A | 7582 | 647 | 8.533369% |
| B | 7582 | 752 | 9.918227% |
| C | 7582 | 172 | 2.268531% |
| D | 7581 | 134 | 1.767577% |
Noise dominated data is calculated using 1-second bins in cleaned event files. If a bin has >2000 counts, and if more than 50% of those come from <1% of pixels, then it is considered to be noise-dominated and hence unusable.
| Quadrant | # 1 sec bins | Bins with >0 counts | Bins with >2000 counts | High rate bins dominated by noise | Noise dominated (total time) | Noise dominated (detector-on time) | Marked lightcurve |
|---|---|---|---|---|---|---|---|
| A | 8697 | 7585 | 341 | 341 | 3.92% | 4.50% | 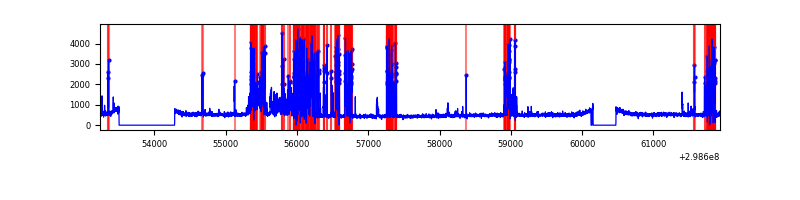 |
| B | 8697 | 7584 | 433 | 433 | 4.98% | 5.71% | 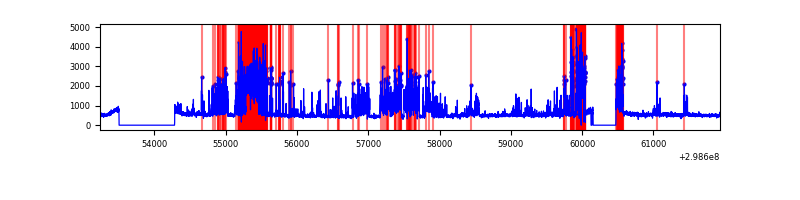 |
| C | 8697 | 7585 | 0 | 0 | 0.00% | 0.00% | 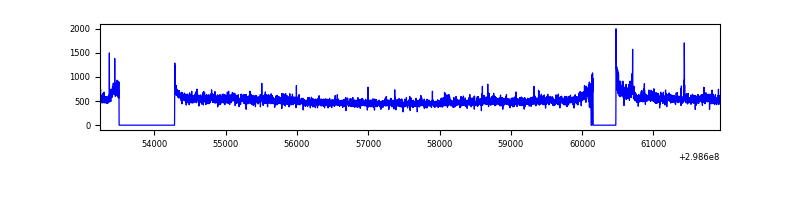 |
| D | 8696 | 7584 | 45 | 45 | 0.52% | 0.59% |  |
Top three noisy pixels from each quadrant. If the there are fewer than three noisy pixels in the level2.evt file, extra rows are filled as -1
| Pixel properties | Quadrant properties | ||||||
|---|---|---|---|---|---|---|---|
| Quadrant | DetID | PixID | Counts | Sigma | Mean | Median | Sigma |
| A | 14 | 238 | 1364864 | 7158.57 | 940 | 923 | 190.5 |
| A | 15 | 192 | 271375 | 1419.45 | 940 | 923 | 190.5 |
| A | 13 | 254 | 8247 | 38.44 | 940 | 923 | 190.5 |
| B | 10 | 245 | 2142561 | 12046.48 | 924 | 904 | 177.8 |
| B | 7 | 220 | 29745 | 162.23 | 924 | 904 | 177.8 |
| B | 12 | 111 | 21170 | 113.99 | 924 | 904 | 177.8 |
| C | 14 | 238 | 145687 | 671.4 | 925 | 932 | 215.6 |
| C | 3 | 233 | 113253 | 520.96 | 925 | 932 | 215.6 |
| C | 8 | 208 | 73837 | 338.15 | 925 | 932 | 215.6 |
| D | 1 | 52 | 395295 | 1706.61 | 945 | 919 | 231.1 |
| D | 14 | 34 | 63185 | 269.45 | 945 | 919 | 231.1 |
| D | 7 | 38 | 38097 | 160.88 | 945 | 919 | 231.1 |
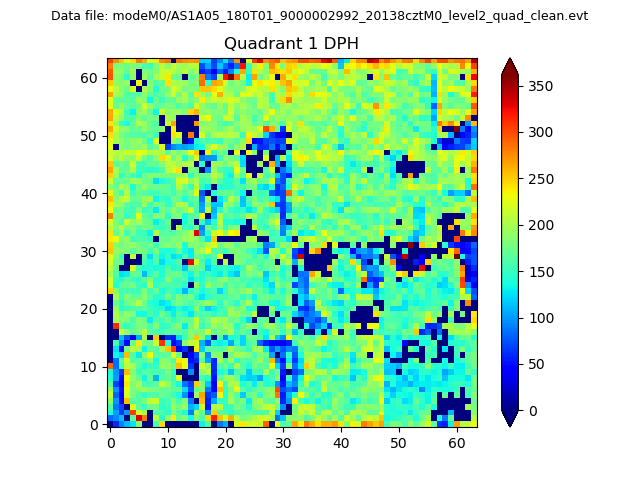
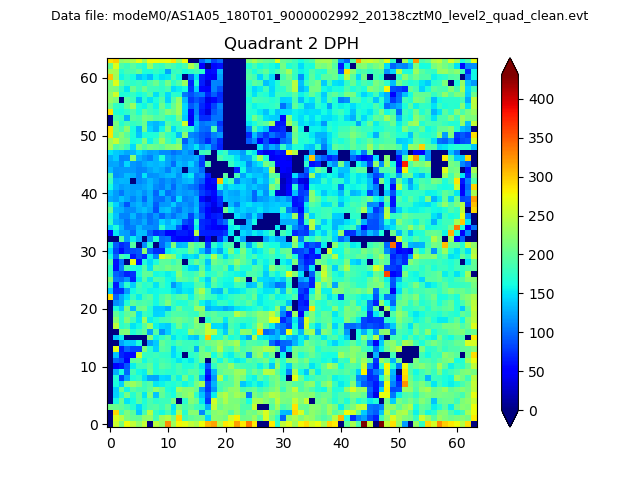
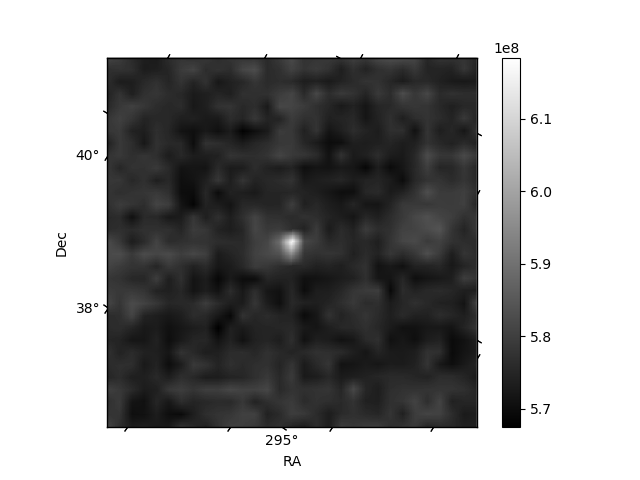
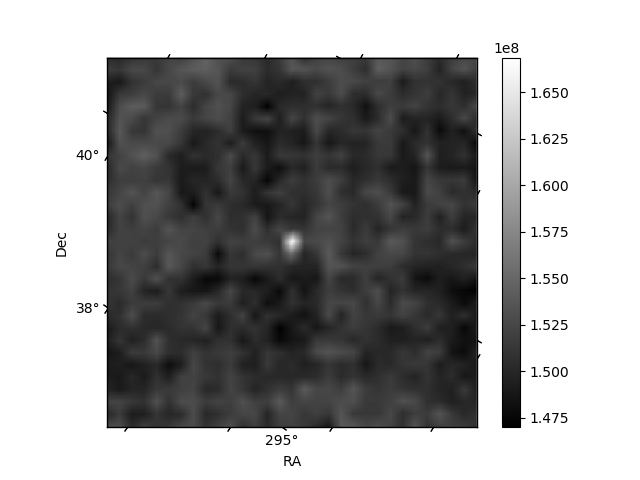
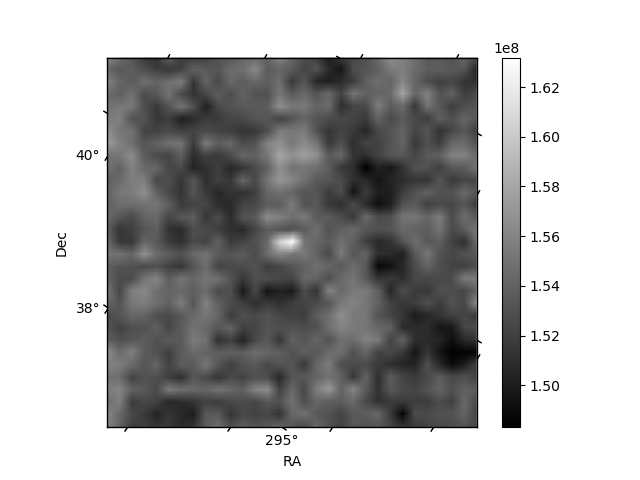
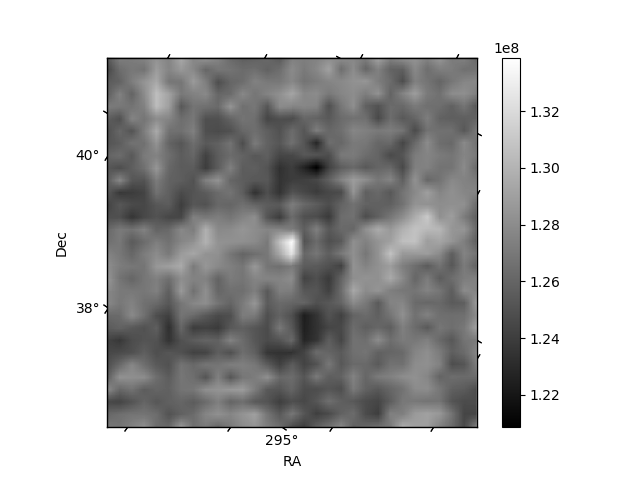
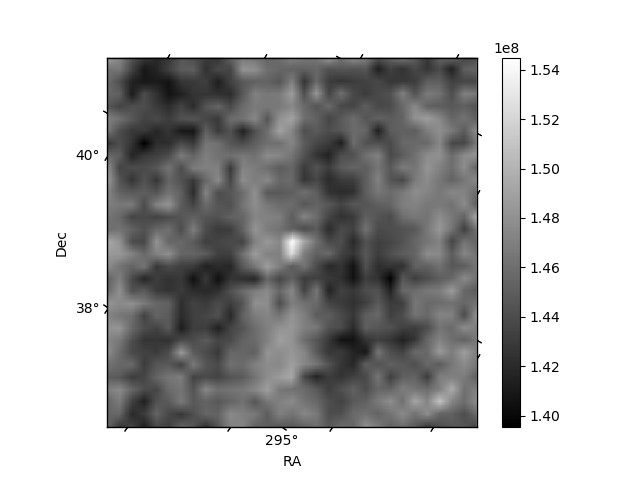
Histogram calculated using DETX and DETY for each event in the final _common_clean file
| Quadrant A | 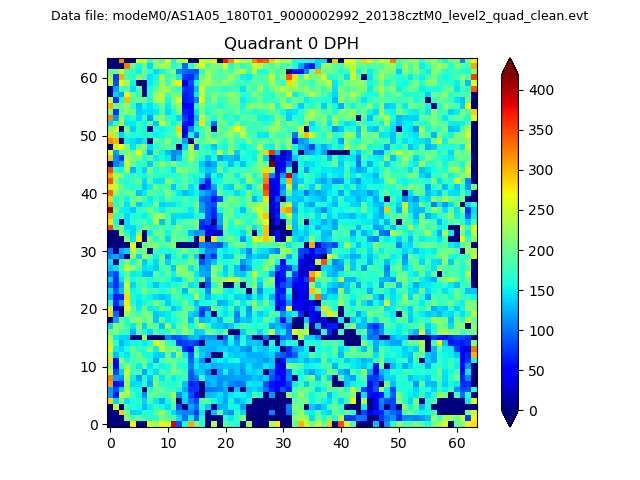 |
 |
Quadrant B |
|---|---|---|---|
| Quadrant D | 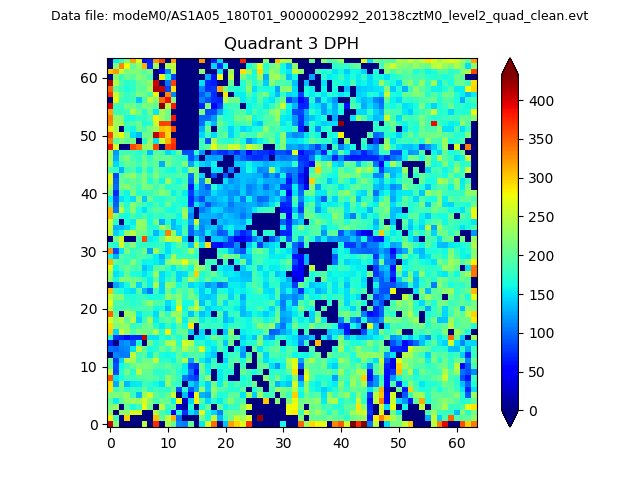 |
 |
Quadrant C |
| Plot type | Count rate plots | Images |
|---|---|---|
| Comparison with Poisson distribution Blue bars denote a histogram of data divided into 1 sec bins. Red curve is a Poisson curve with rate = median count rate of data. |
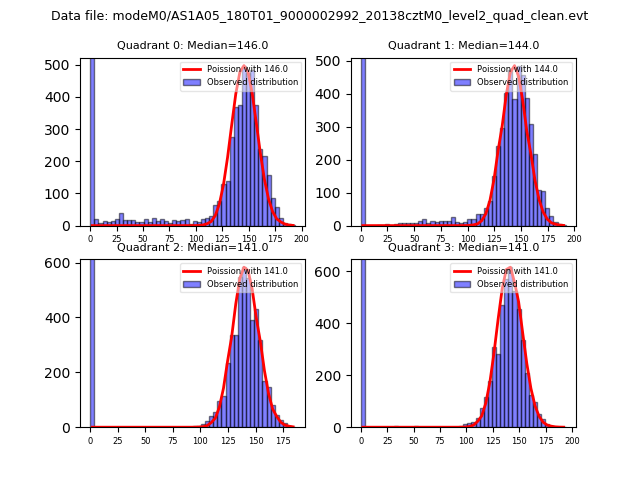 |
 |
| Quadrant-wise count rates Data is divided into 100 sec bins |
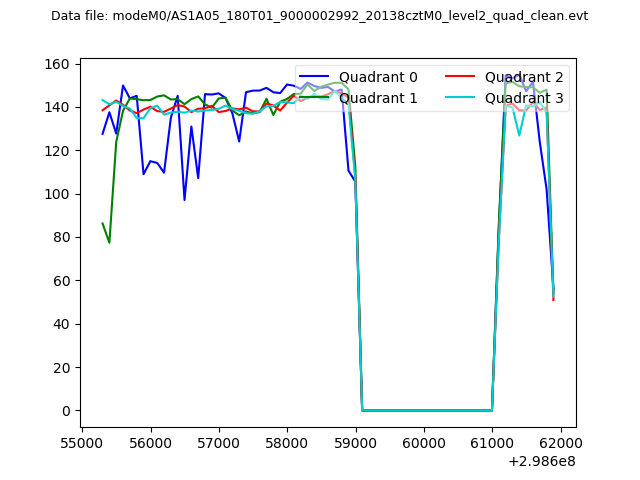 |
|
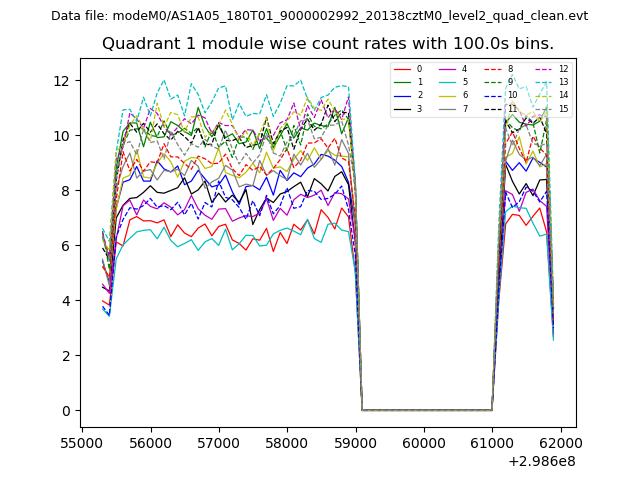
| Module-wise count rates for Quadrant A Data is divided into 100 sec bins |
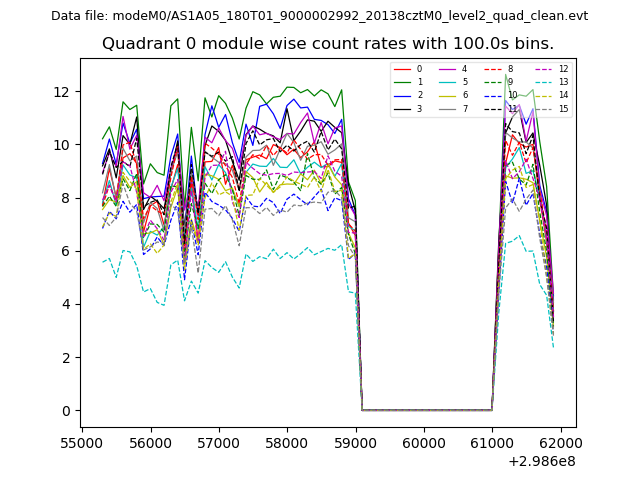 |
 |
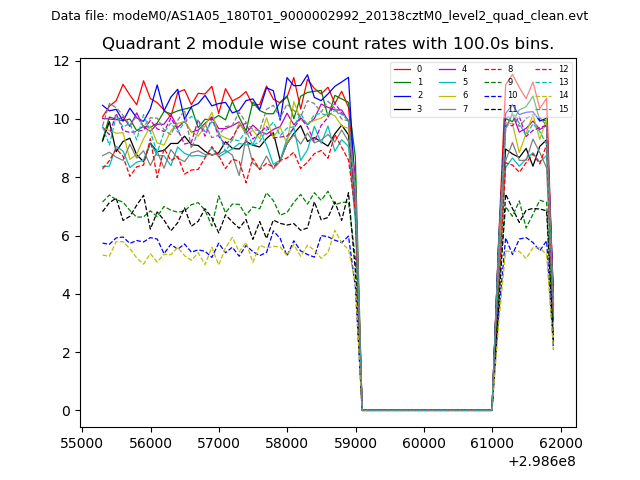
| Module-wise count rates for Quadrant B Data is divided into 100 sec bins |
 |
 |
| Module-wise count rates for Quadrant C Data is divided into 100 sec bins |
 |
 |
| Module-wise count rates for Quadrant D Data is divided into 100 sec bins |
 |
 |
| Parameter | Plot |
|---|---|
| CZT HV Monitor | 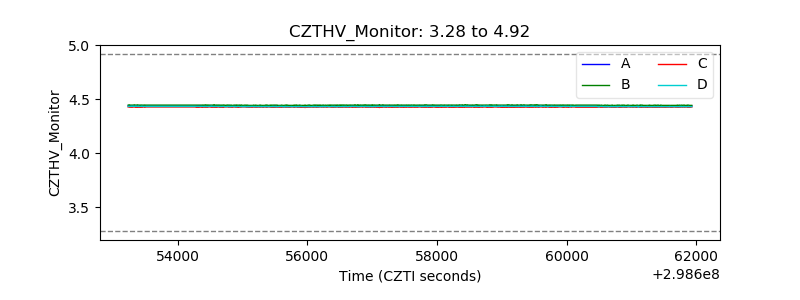 |
| D_VDD |  |
| Temperature 1 | 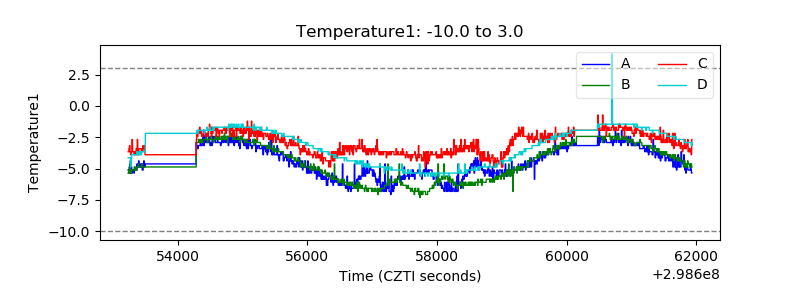 |
| Veto HV Monitor | 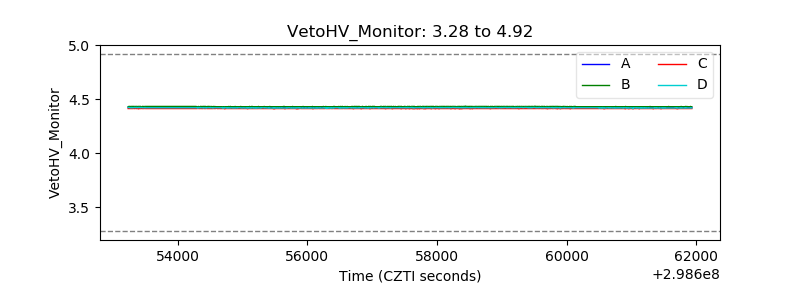 |
| Veto LLD | 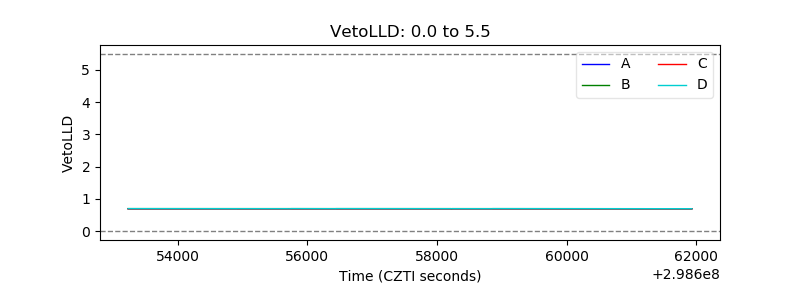 |
| Alpha Counter | 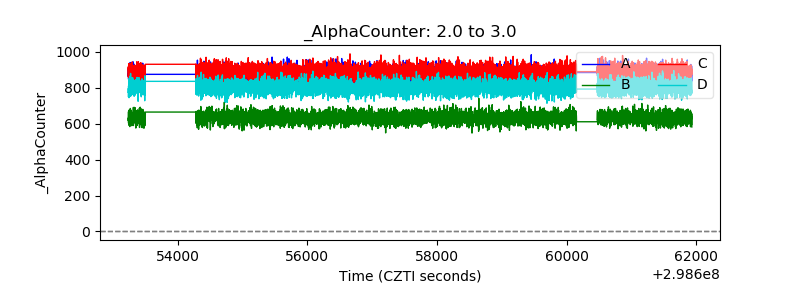 |
| _CPM_Rate | 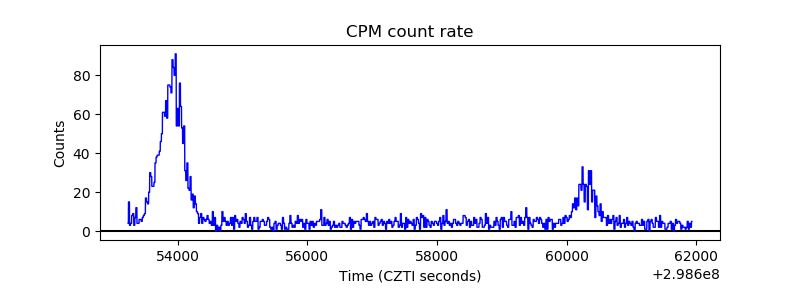 |
| CZT Counter | 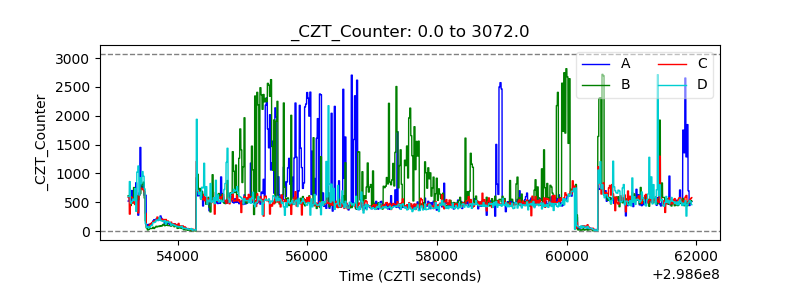 |
| +2.5 Volts monitor |  |
| +5 Volts monitor |  |
| _ROLL_ROT | 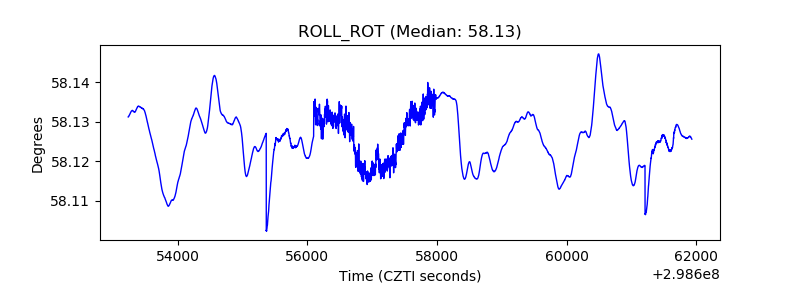 |
| _Roll_DEC | 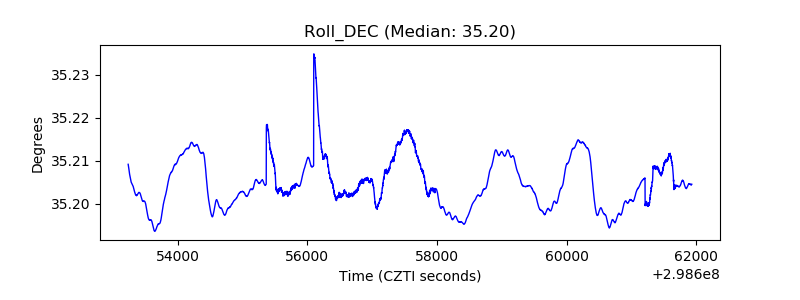 |
| _Roll_RA | 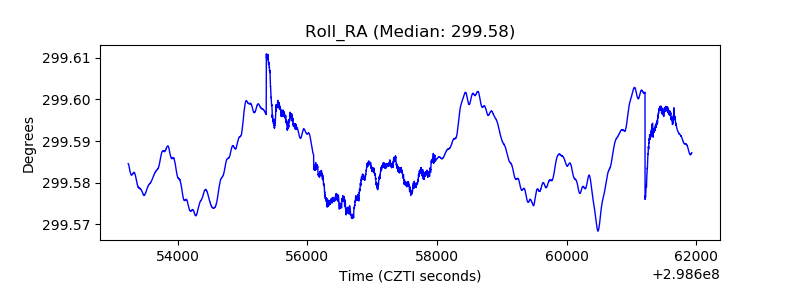 |
| Veto Counter | 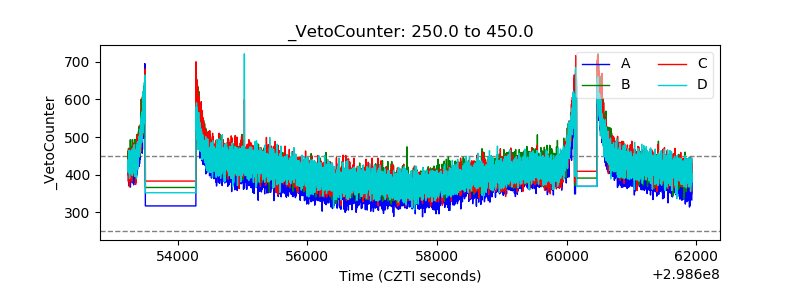 |