| Param | Original file | Final file |
|---|---|---|
| Filename | modeM0/AS1A05_180T01_9000002992_20139cztM0_level2.evt | modeM0/AS1A05_180T01_9000002992_20139cztM0_level2_quad_clean.evt |
| Size (bytes) | 615,116,160 | 110,194,560 |
| Size | 586.6 MB | 105.1 MB |
| Events in quadrant A | 5,147,133 | 698,936 |
| Events in quadrant B | 4,104,946 | 731,332 |
| Events in quadrant C | 3,948,202 | 703,437 |
| Events in quadrant D | 4,925,386 | 686,536 |
| Mode M9 | |||
|---|---|---|---|
| Quadrant | BADHDUFLAG | Total packets | Discarded packets |
| A | 0 | 3 | 0 |
| B | 0 | 3 | 0 |
| C | 0 | 3 | 0 |
| D | 0 | 3 | 0 |
| Mode M0 | |||
|---|---|---|---|
| Quadrant | BADHDUFLAG | Total packets | Discarded packets |
| A | 0 | 19964 | 2 |
| B | 0 | 16808 | 1 |
| C | 0 | 16281 | 1 |
| D | 0 | 19625 | 1 |
| Mode SS | |||
|---|---|---|---|
| Quadrant | BADHDUFLAG | Total packets | Discarded packets |
| A | 0 | 152 | 0 |
| B | 0 | 152 | 0 |
| C | 0 | 152 | 0 |
| D | 0 | 152 | 0 |
| Quadrant | Total seconds | Saturated seconds | Saturation percentage |
|---|---|---|---|
| A | 7427 | 648 | 8.724923% |
| B | 7427 | 171 | 2.302410% |
| C | 7428 | 145 | 1.952073% |
| D | 7428 | 258 | 3.473344% |
Noise dominated data is calculated using 1-second bins in cleaned event files. If a bin has >2000 counts, and if more than 50% of those come from <1% of pixels, then it is considered to be noise-dominated and hence unusable.
| Quadrant | # 1 sec bins | Bins with >0 counts | Bins with >2000 counts | High rate bins dominated by noise | Noise dominated (total time) | Noise dominated (detector-on time) | Marked lightcurve |
|---|---|---|---|---|---|---|---|
| A | 7732 | 7429 | 390 | 390 | 5.04% | 5.25% | 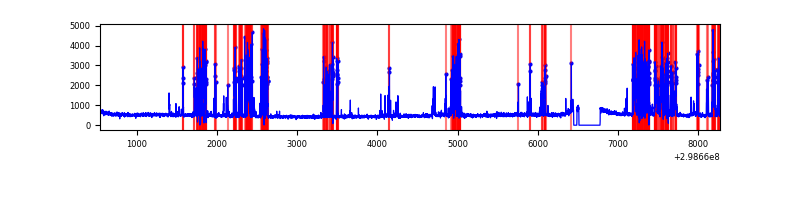 |
| B | 7732 | 7429 | 65 | 65 | 0.84% | 0.87% | 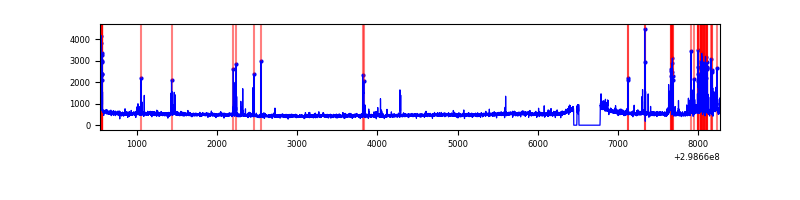 |
| C | 7733 | 7430 | 1 | 1 | 0.01% | 0.01% | 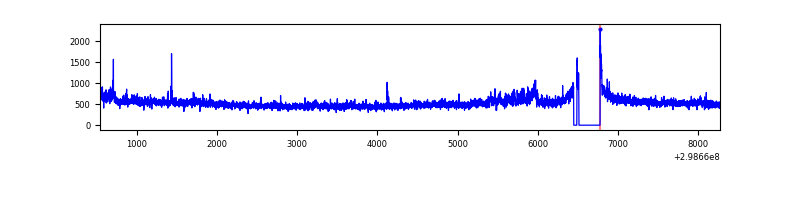 |
| D | 7733 | 7430 | 183 | 183 | 2.37% | 2.46% | 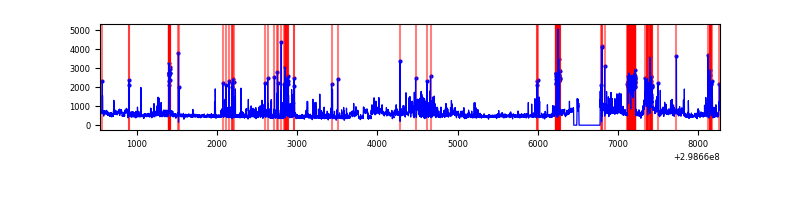 |
Top three noisy pixels from each quadrant. If the there are fewer than three noisy pixels in the level2.evt file, extra rows are filled as -1
| Pixel properties | Quadrant properties | ||||||
|---|---|---|---|---|---|---|---|
| Quadrant | DetID | PixID | Counts | Sigma | Mean | Median | Sigma |
| A | 14 | 238 | 1656646 | 9038.6 | 903 | 886 | 183.2 |
| A | 15 | 192 | 8830 | 43.37 | 903 | 886 | 183.2 |
| A | 0 | 226 | 7574 | 36.51 | 903 | 886 | 183.2 |
| B | 10 | 245 | 329924 | 1860.52 | 927 | 908 | 176.8 |
| B | 7 | 220 | 57363 | 319.24 | 927 | 908 | 176.8 |
| B | 0 | 197 | 45159 | 250.23 | 927 | 908 | 176.8 |
| C | 3 | 233 | 247063 | 1168.89 | 896 | 902 | 210.6 |
| C | 14 | 238 | 141593 | 668.07 | 896 | 902 | 210.6 |
| C | 8 | 208 | 49678 | 231.61 | 896 | 902 | 210.6 |
| D | 1 | 52 | 1266775 | 5741.03 | 905 | 880 | 220.5 |
| D | 7 | 96 | 65495 | 293.04 | 905 | 880 | 220.5 |
| D | 12 | 17 | 59021 | 263.68 | 905 | 880 | 220.5 |
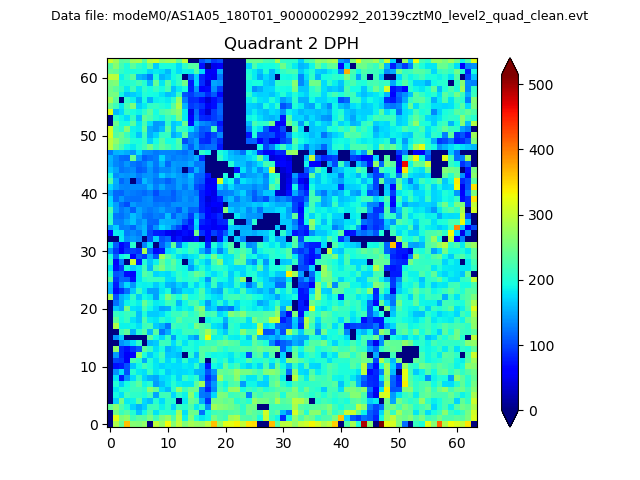
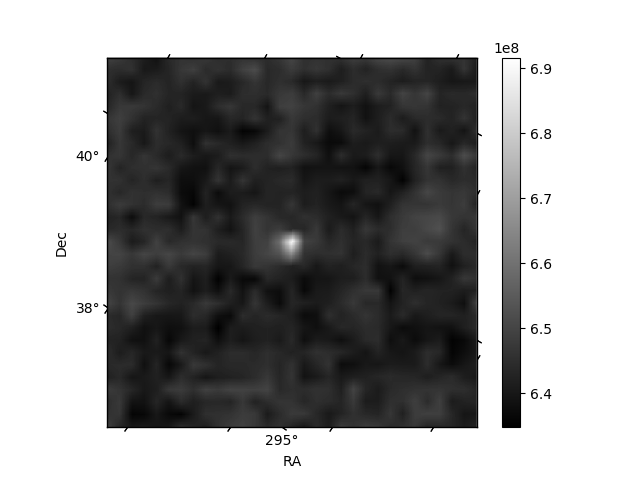
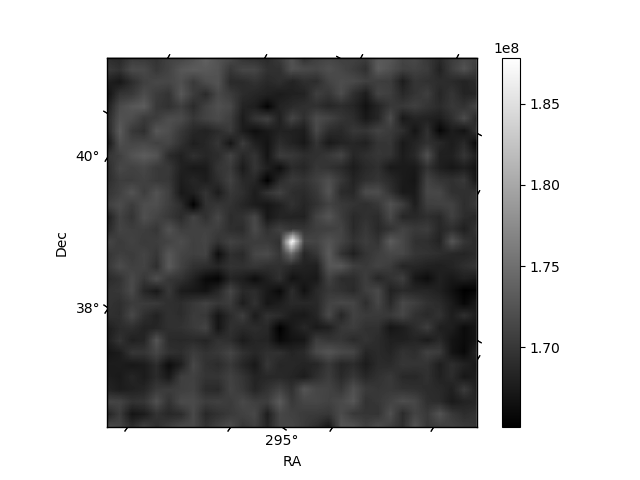
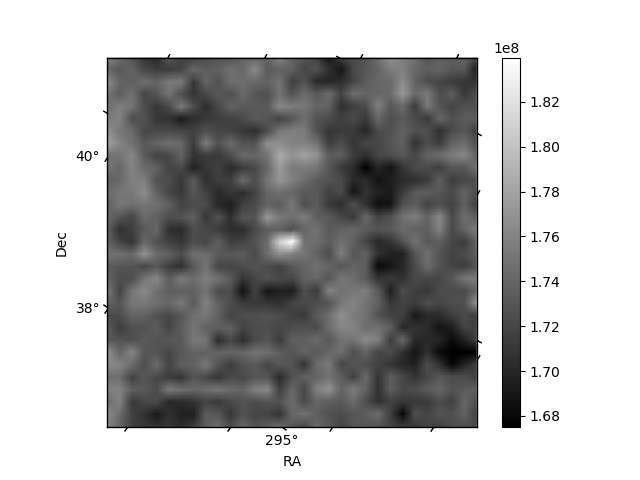
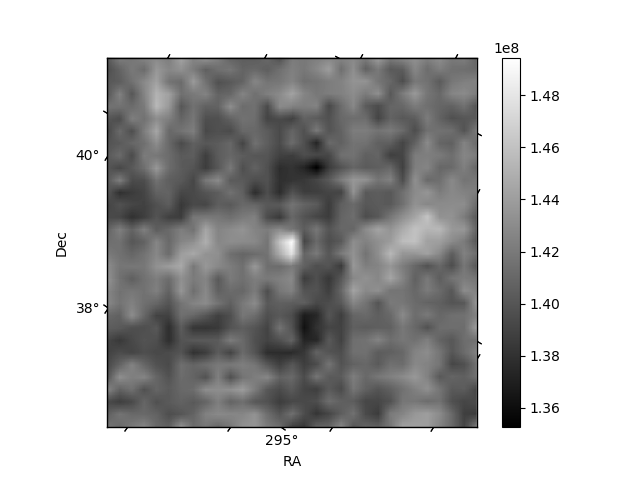
Histogram calculated using DETX and DETY for each event in the final _common_clean file
| Quadrant A | 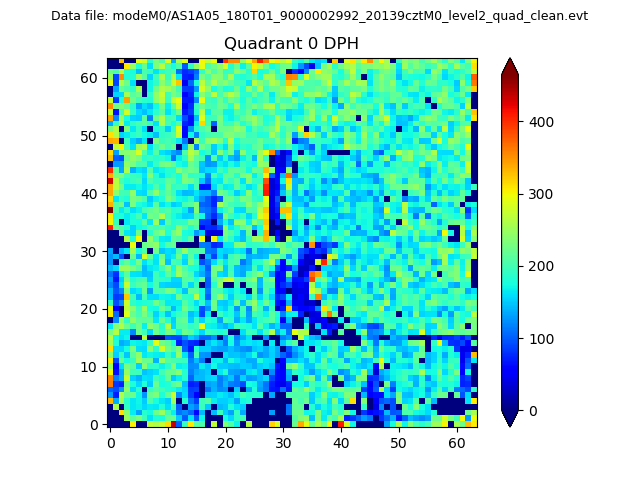 |
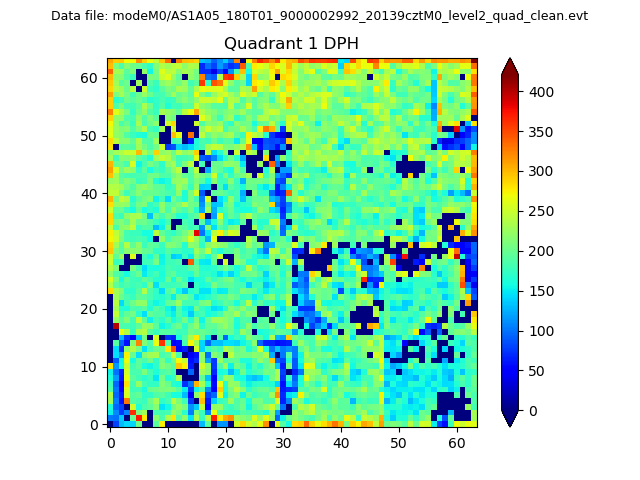 |
Quadrant B |
|---|---|---|---|
| Quadrant D | 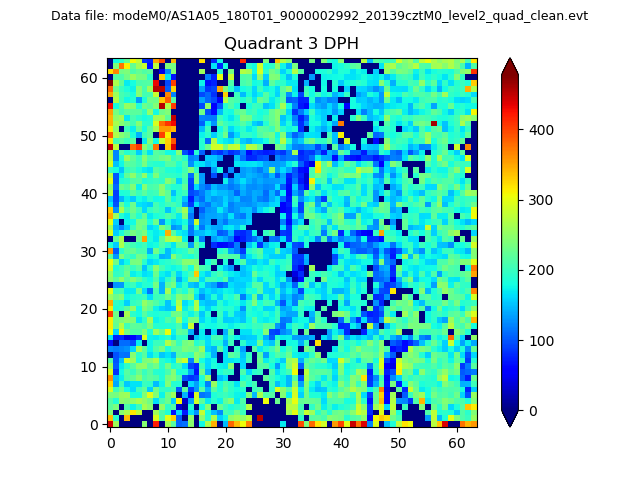 |
 |
Quadrant C |
| Plot type | Count rate plots | Images |
|---|---|---|
| Comparison with Poisson distribution Blue bars denote a histogram of data divided into 1 sec bins. Red curve is a Poisson curve with rate = median count rate of data. |
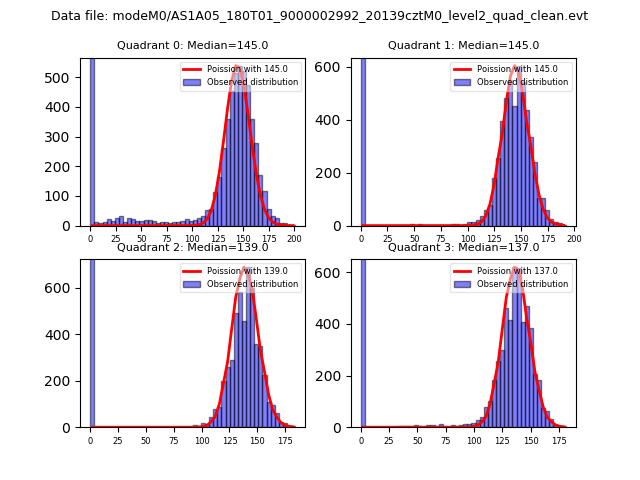 |
 |
| Quadrant-wise count rates Data is divided into 100 sec bins |
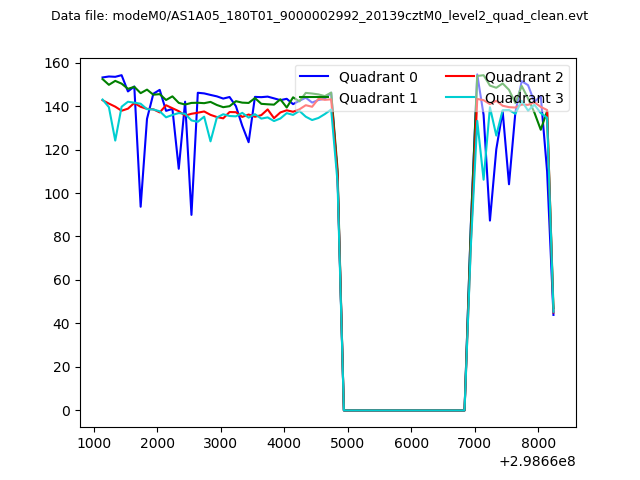 |
|
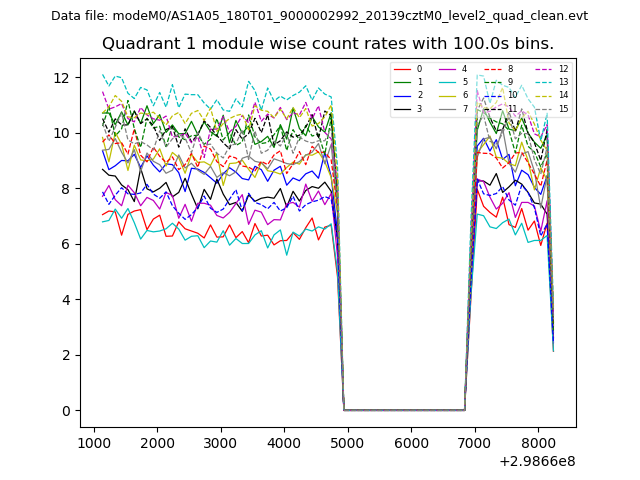
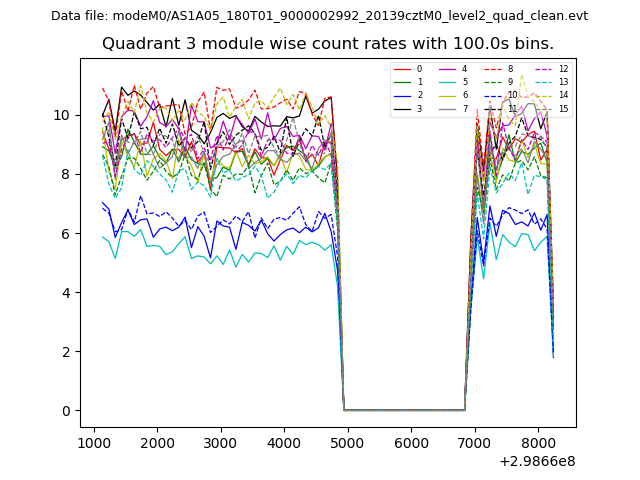
| Module-wise count rates for Quadrant A Data is divided into 100 sec bins |
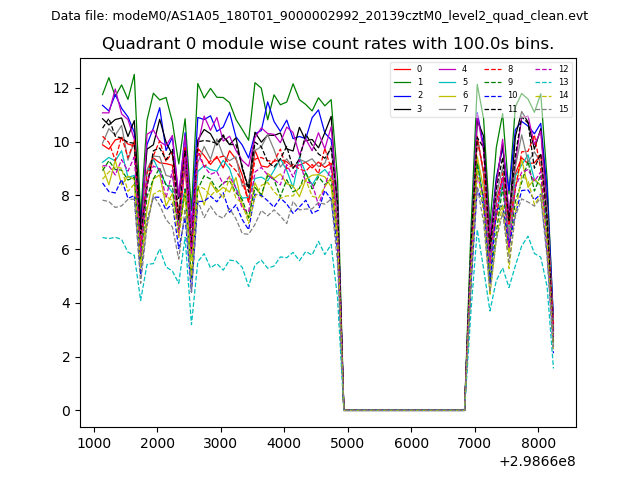 |
 |
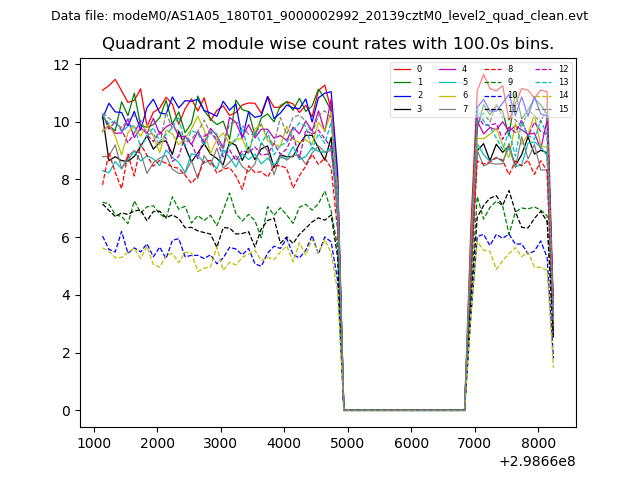
| Module-wise count rates for Quadrant B Data is divided into 100 sec bins |
 |
 |
| Module-wise count rates for Quadrant C Data is divided into 100 sec bins |
 |
 |
| Module-wise count rates for Quadrant D Data is divided into 100 sec bins |
 |
 |
| Parameter | Plot |
|---|---|
| CZT HV Monitor | 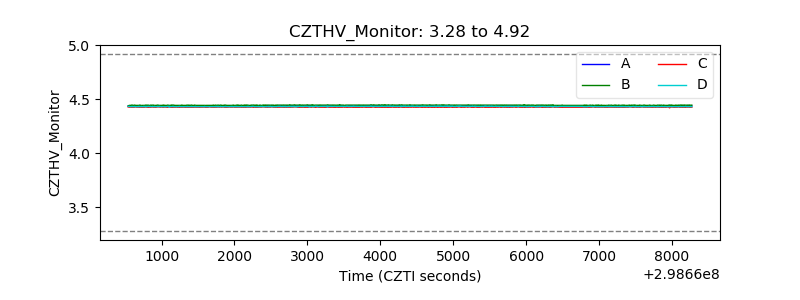 |
| D_VDD | 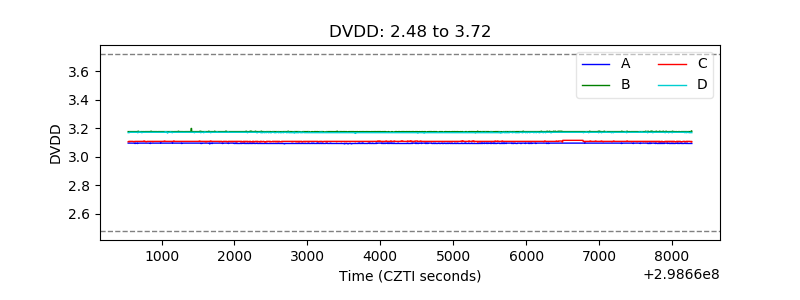 |
| Temperature 1 | 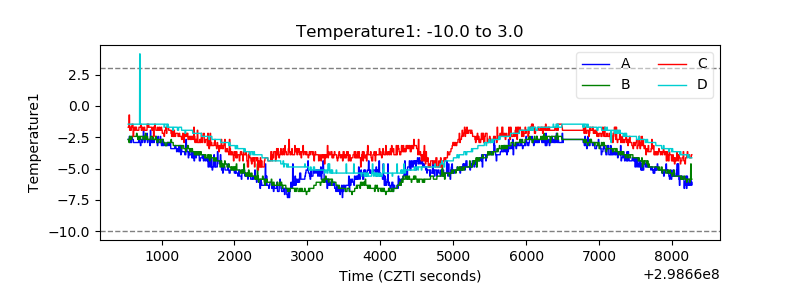 |
| Veto HV Monitor | 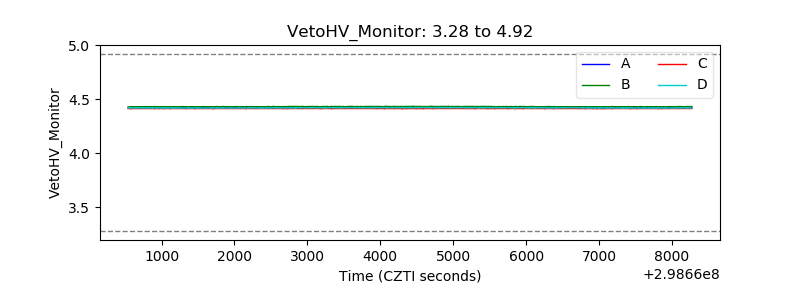 |
| Veto LLD | 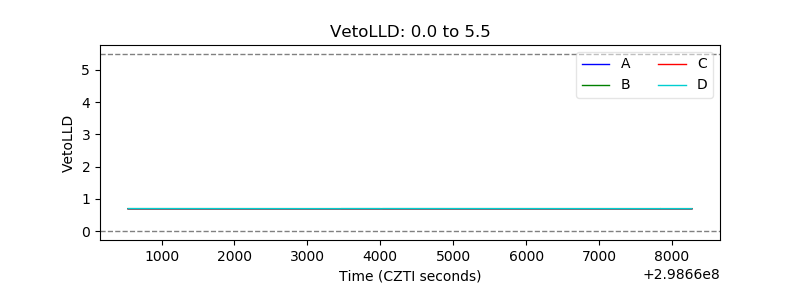 |
| Alpha Counter | 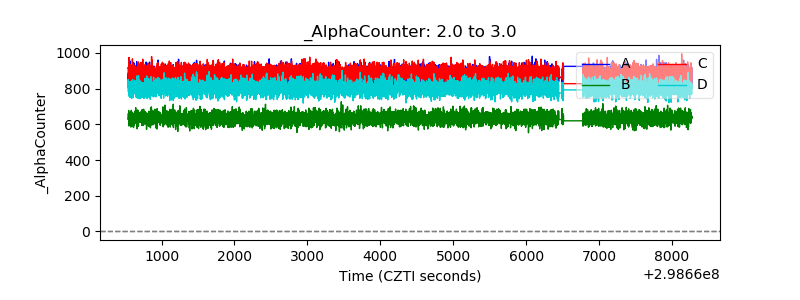 |
| _CPM_Rate | 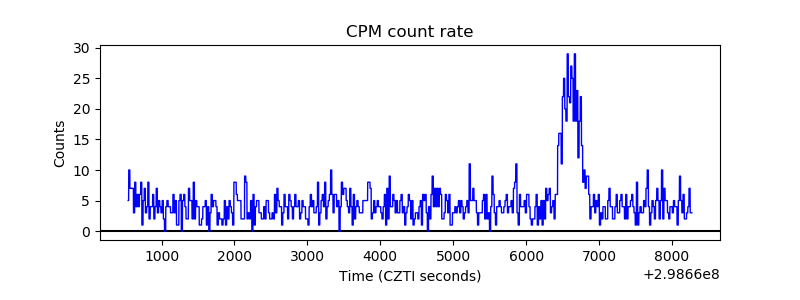 |
| CZT Counter | 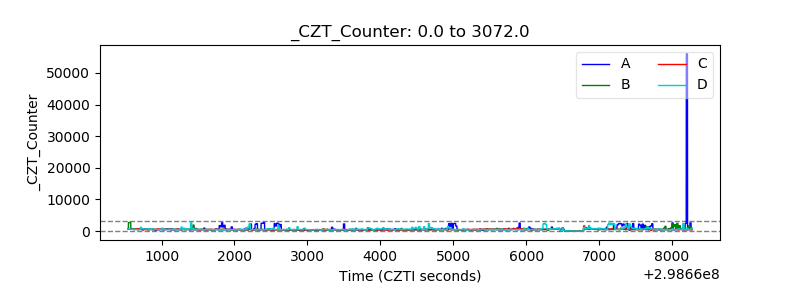 |
| +2.5 Volts monitor |  |
| +5 Volts monitor |  |
| _ROLL_ROT | 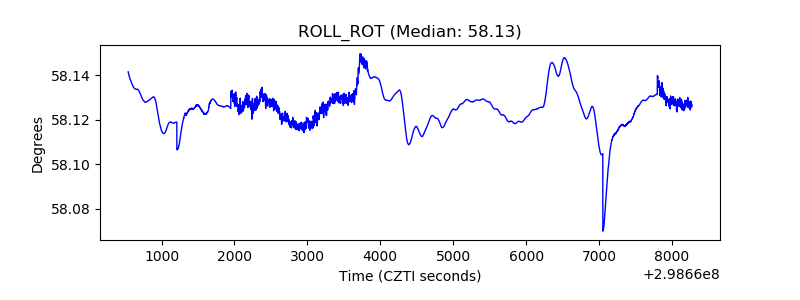 |
| _Roll_DEC | 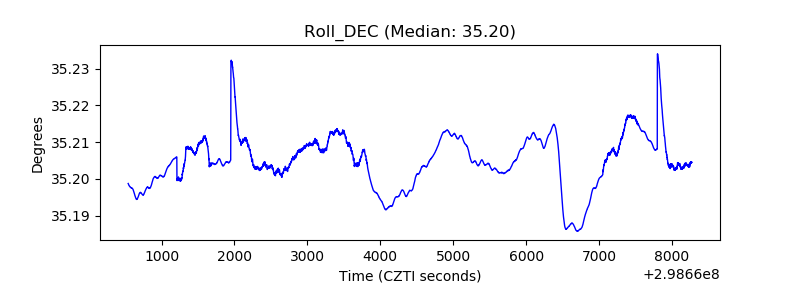 |
| _Roll_RA | 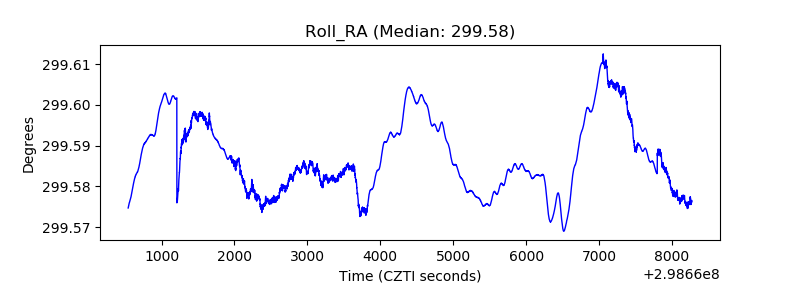 |
| Veto Counter | 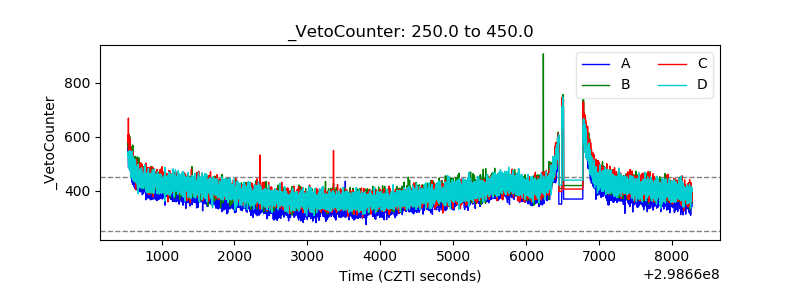 |