| Param | Original file | Final file |
|---|---|---|
| Filename | modeM0/AS1A05_180T01_9000002992_20142cztM0_level2.evt | modeM0/AS1A05_180T01_9000002992_20142cztM0_level2_quad_clean.evt |
| Size (bytes) | 1,441,938,240 | 263,649,600 |
| Size | 1.3 GB | 251.4 MB |
| Events in quadrant A | 11,599,418 | 1,679,845 |
| Events in quadrant B | 9,409,388 | 1,742,602 |
| Events in quadrant C | 9,246,348 | 1,675,249 |
| Events in quadrant D | 12,178,911 | 1,626,639 |
| Mode M9 | |||
|---|---|---|---|
| Quadrant | BADHDUFLAG | Total packets | Discarded packets |
| A | 0 | 18 | 0 |
| B | 0 | 18 | 0 |
| C | 0 | 18 | 0 |
| D | 0 | 18 | 0 |
| Mode M0 | |||
|---|---|---|---|
| Quadrant | BADHDUFLAG | Total packets | Discarded packets |
| A | 0 | 46289 | 3 |
| B | 0 | 39763 | 3 |
| C | 0 | 38765 | 3 |
| D | 0 | 48511 | 3 |
| Mode SS | |||
|---|---|---|---|
| Quadrant | BADHDUFLAG | Total packets | Discarded packets |
| A | 0 | 370 | 0 |
| B | 0 | 370 | 0 |
| C | 0 | 370 | 0 |
| D | 0 | 370 | 0 |
| Quadrant | Total seconds | Saturated seconds | Saturation percentage |
|---|---|---|---|
| A | 18299 | 1201 | 6.563200% |
| B | 18299 | 236 | 1.289688% |
| C | 18300 | 256 | 1.398907% |
| D | 18300 | 835 | 4.562842% |
Noise dominated data is calculated using 1-second bins in cleaned event files. If a bin has >2000 counts, and if more than 50% of those come from <1% of pixels, then it is considered to be noise-dominated and hence unusable.
| Quadrant | # 1 sec bins | Bins with >0 counts | Bins with >2000 counts | High rate bins dominated by noise | Noise dominated (total time) | Noise dominated (detector-on time) | Marked lightcurve |
|---|---|---|---|---|---|---|---|
| A | 20019 | 18302 | 731 | 731 | 3.65% | 3.99% | 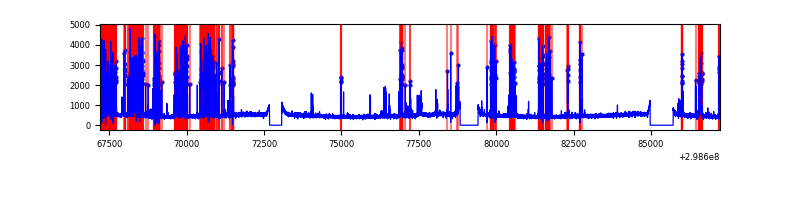 |
| B | 20019 | 18302 | 61 | 61 | 0.30% | 0.33% | 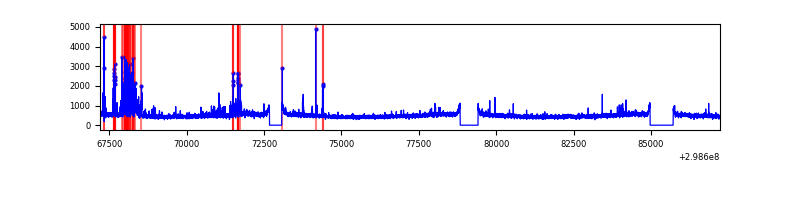 |
| C | 20020 | 18303 | 0 | 0 | 0.00% | 0.00% | 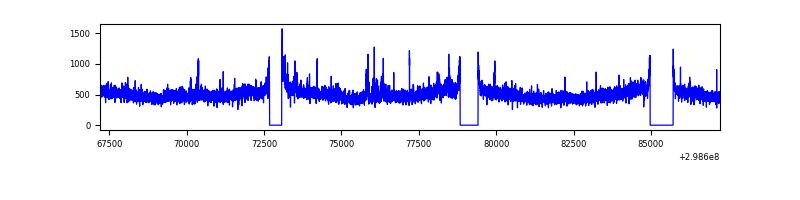 |
| D | 20020 | 18303 | 685 | 685 | 3.42% | 3.74% | 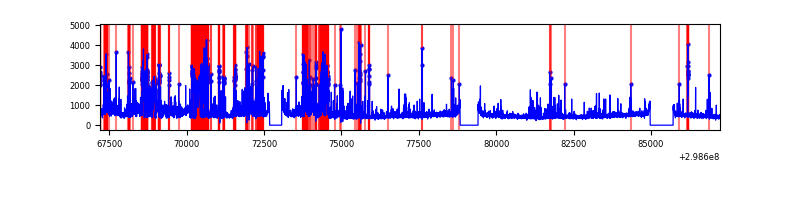 |
Top three noisy pixels from each quadrant. If the there are fewer than three noisy pixels in the level2.evt file, extra rows are filled as -1
| Pixel properties | Quadrant properties | ||||||
|---|---|---|---|---|---|---|---|
| Quadrant | DetID | PixID | Counts | Sigma | Mean | Median | Sigma |
| A | 14 | 238 | 3116357 | 7112.14 | 2183 | 2144 | 437.9 |
| A | 14 | 254 | 79099 | 175.75 | 2183 | 2144 | 437.9 |
| A | 0 | 226 | 18454 | 37.25 | 2183 | 2144 | 437.9 |
| B | 10 | 245 | 430837 | 1012.42 | 2227 | 2172 | 423.4 |
| B | 3 | 64 | 76179 | 174.79 | 2227 | 2172 | 423.4 |
| B | 0 | 183 | 54217 | 122.92 | 2227 | 2172 | 423.4 |
| C | 3 | 233 | 477323 | 948.48 | 2148 | 2165 | 501.0 |
| C | 14 | 238 | 337351 | 669.07 | 2148 | 2165 | 501.0 |
| C | 8 | 208 | 33857 | 63.26 | 2148 | 2165 | 501.0 |
| D | 1 | 52 | 3734314 | 7144.0 | 2153 | 2097 | 522.4 |
| D | 2 | 234 | 78016 | 145.32 | 2153 | 2097 | 522.4 |
| D | 12 | 17 | 57986 | 106.98 | 2153 | 2097 | 522.4 |
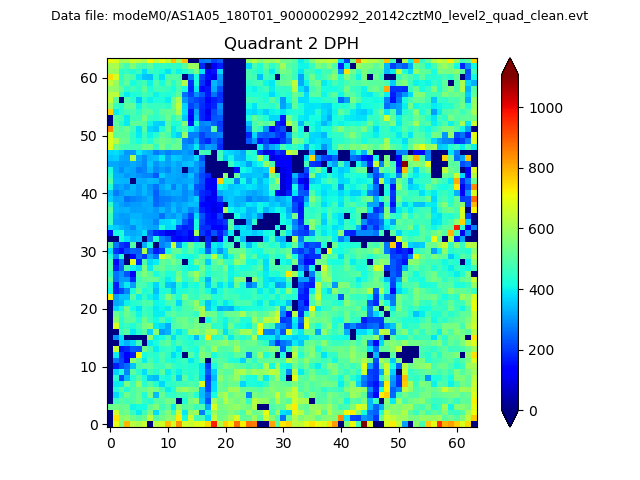
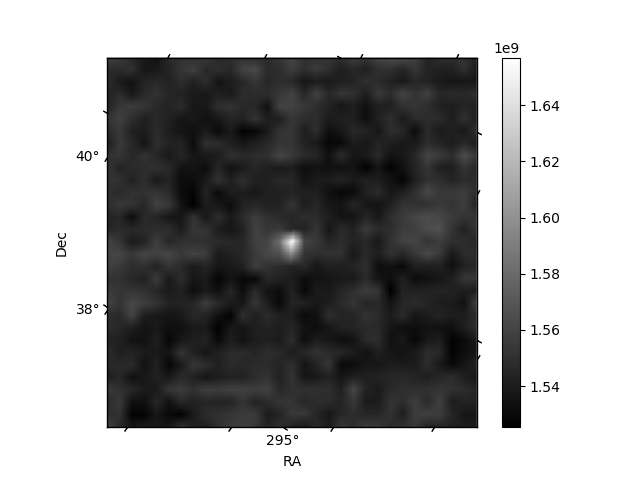
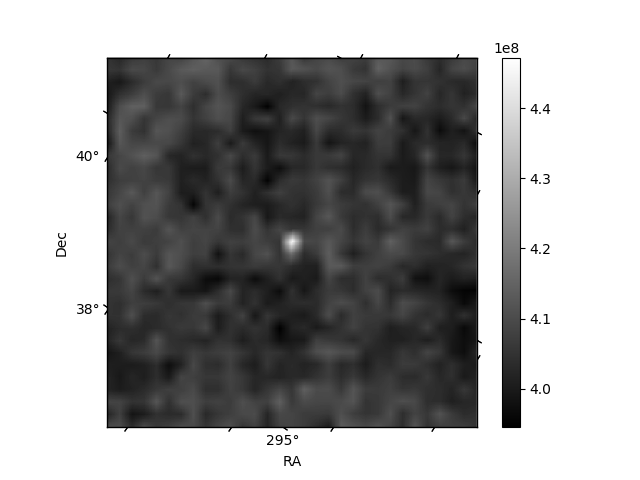
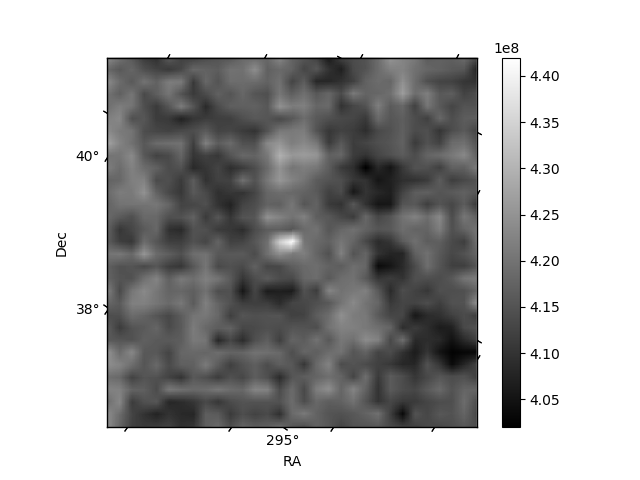
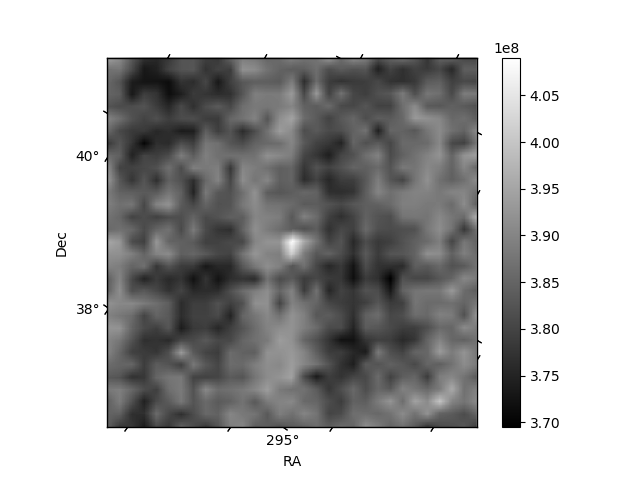
Histogram calculated using DETX and DETY for each event in the final _common_clean file
| Quadrant A | 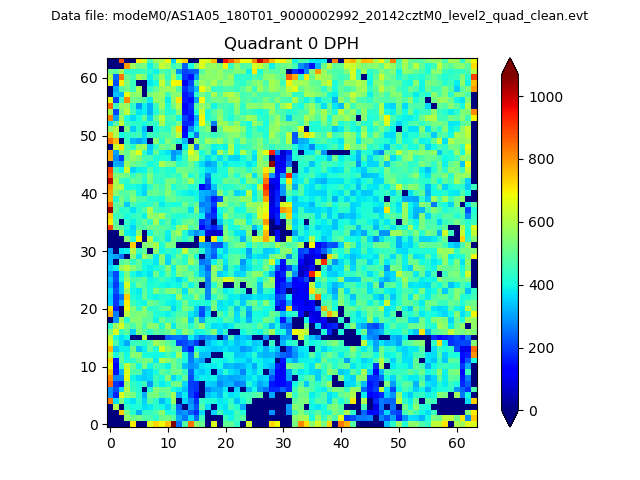 |
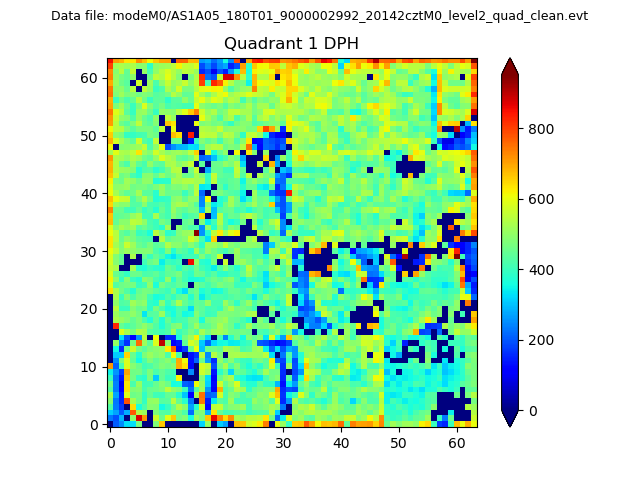 |
Quadrant B |
|---|---|---|---|
| Quadrant D | 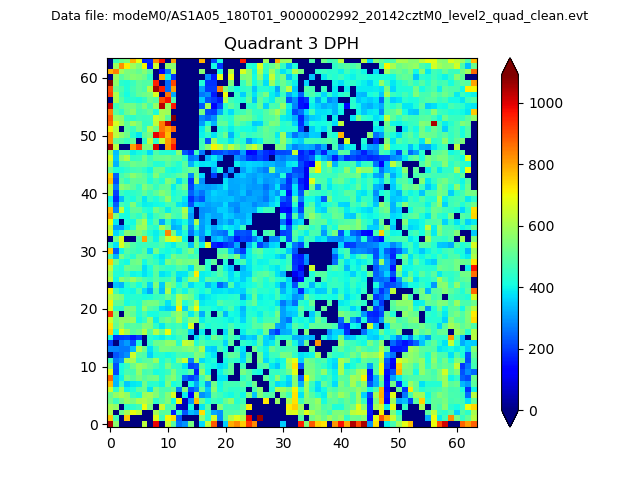 |
 |
Quadrant C |
| Plot type | Count rate plots | Images |
|---|---|---|
| Comparison with Poisson distribution Blue bars denote a histogram of data divided into 1 sec bins. Red curve is a Poisson curve with rate = median count rate of data. |
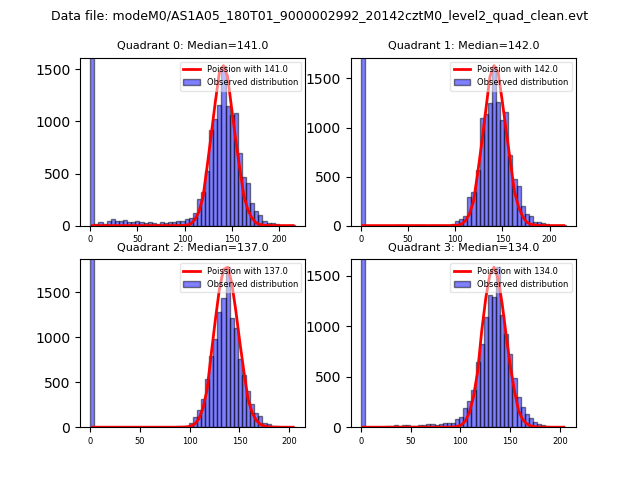 |
 |
| Quadrant-wise count rates Data is divided into 100 sec bins |
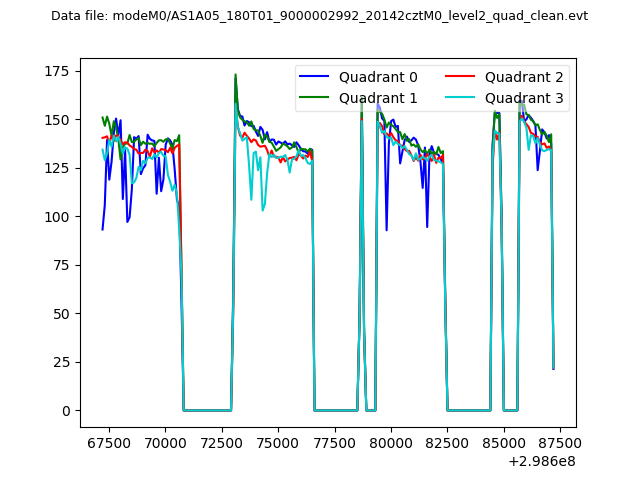 |
|
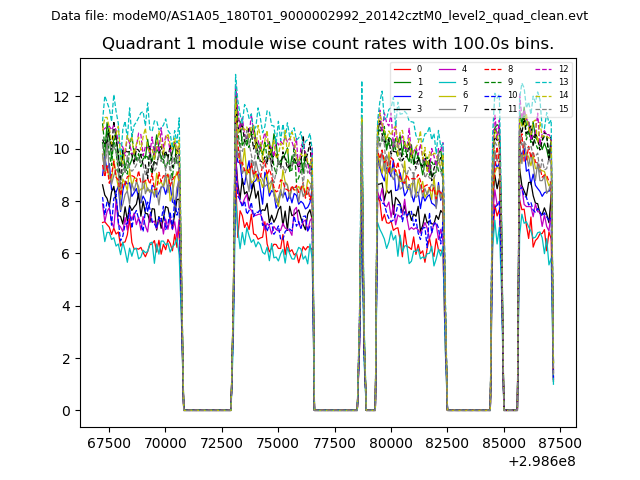
| Module-wise count rates for Quadrant A Data is divided into 100 sec bins |
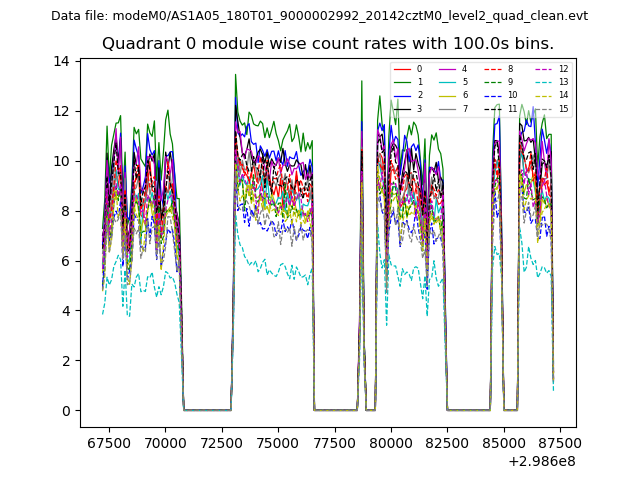 |
 |
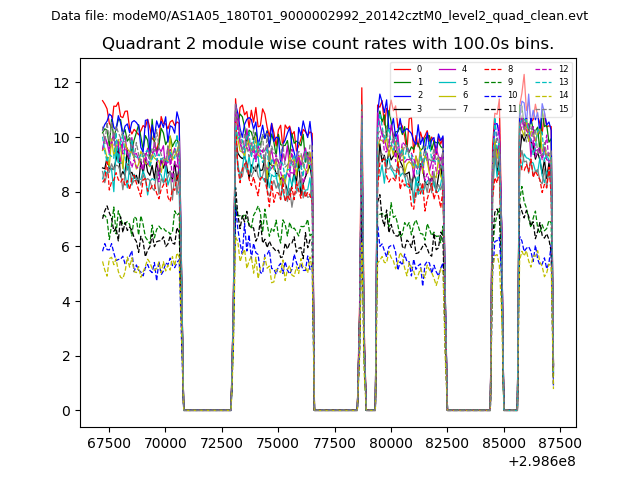
| Module-wise count rates for Quadrant B Data is divided into 100 sec bins |
 |
 |
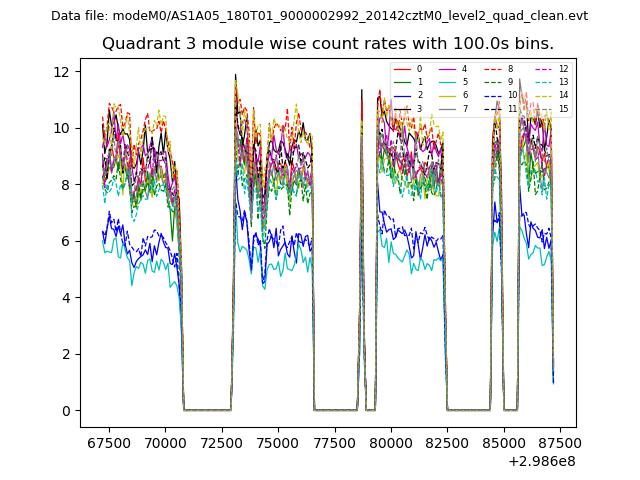
| Module-wise count rates for Quadrant C Data is divided into 100 sec bins |
 |
 |
| Module-wise count rates for Quadrant D Data is divided into 100 sec bins |
 |
 |
| Parameter | Plot |
|---|---|
| CZT HV Monitor | 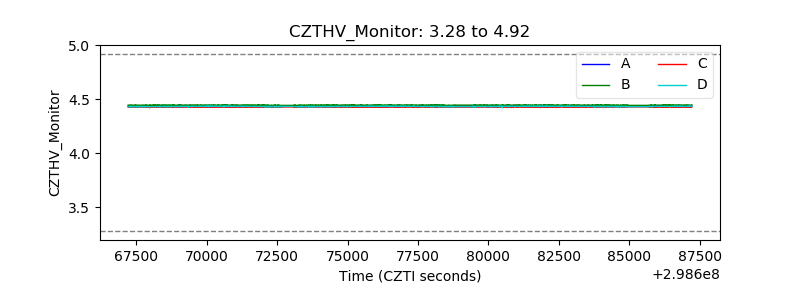 |
| D_VDD | 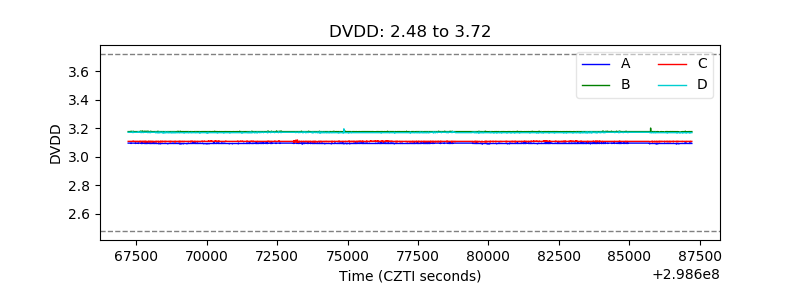 |
| Temperature 1 | 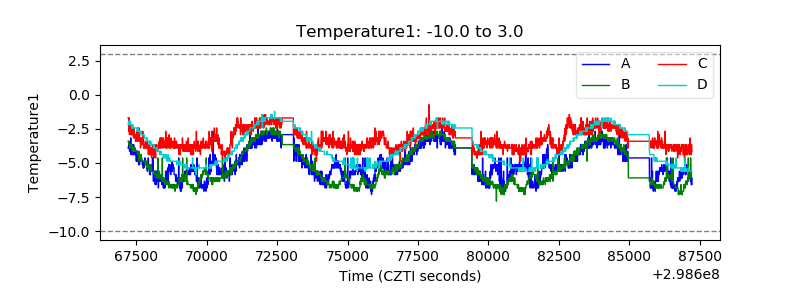 |
| Veto HV Monitor |  |
| Veto LLD | 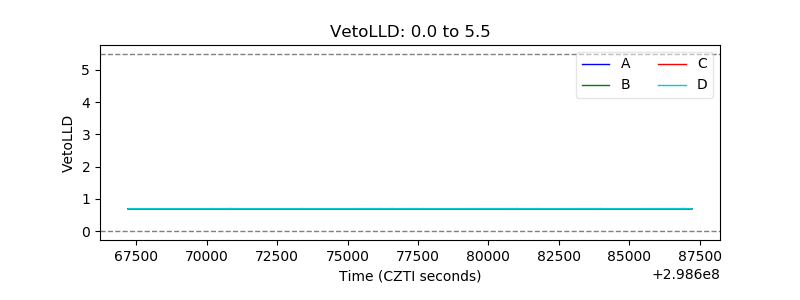 |
| Alpha Counter | 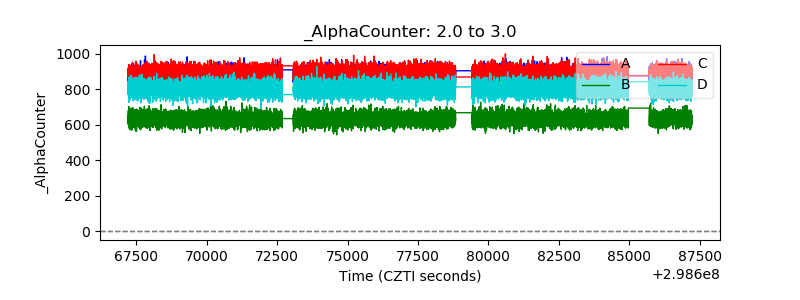 |
| _CPM_Rate | 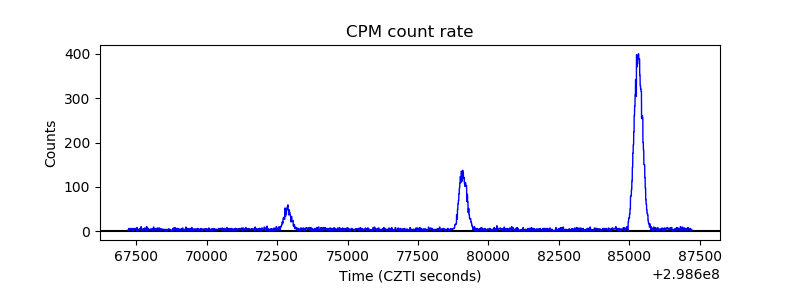 |
| CZT Counter | 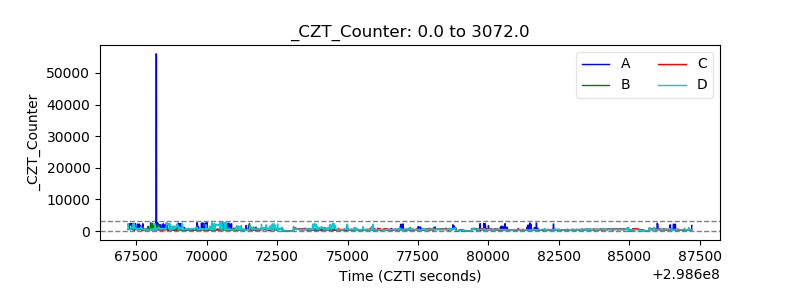 |
| +2.5 Volts monitor |  |
| +5 Volts monitor |  |
| _ROLL_ROT | 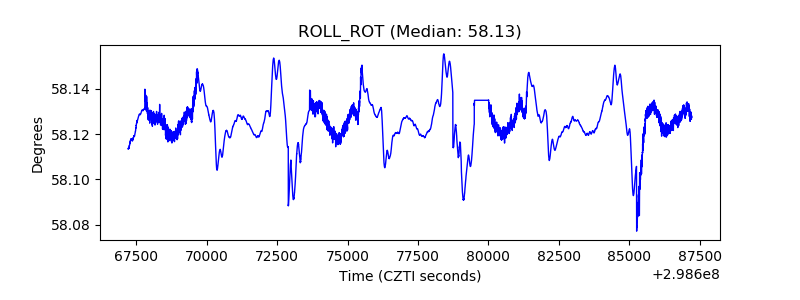 |
| _Roll_DEC | 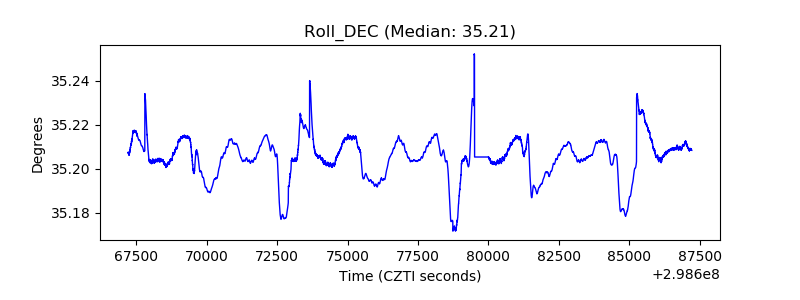 |
| _Roll_RA | 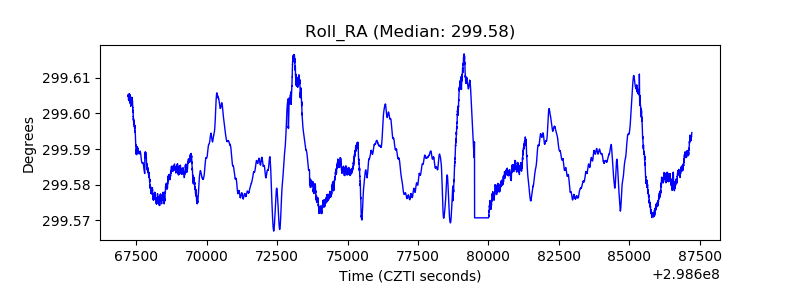 |
| Veto Counter | 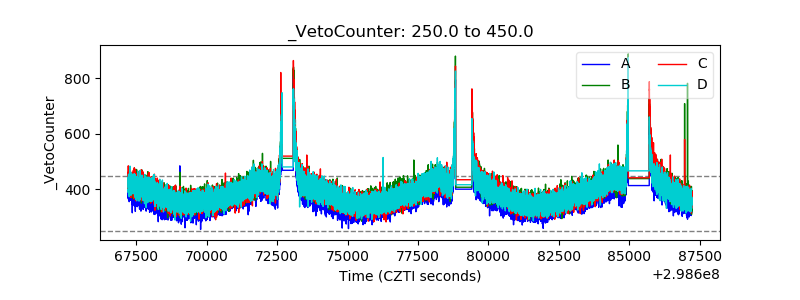 |