| Param | Original file | Final file |
|---|---|---|
| Filename | modeM0/AS1A05_180T01_9000002992_20143cztM0_level2.evt | modeM0/AS1A05_180T01_9000002992_20143cztM0_level2_quad_clean.evt |
| Size (bytes) | 445,069,440 | 99,100,800 |
| Size | 424.5 MB | 94.5 MB |
| Events in quadrant A | 3,309,328 | 650,400 |
| Events in quadrant B | 3,200,947 | 654,921 |
| Events in quadrant C | 3,153,265 | 624,981 |
| Events in quadrant D | 3,372,094 | 616,096 |
| Mode M9 | |||
|---|---|---|---|
| Quadrant | BADHDUFLAG | Total packets | Discarded packets |
| A | 0 | 9 | 0 |
| B | 0 | 9 | 0 |
| C | 0 | 9 | 0 |
| D | 0 | 9 | 0 |
| Mode M0 | |||
|---|---|---|---|
| Quadrant | BADHDUFLAG | Total packets | Discarded packets |
| A | 0 | 14030 | 1 |
| B | 0 | 13714 | 1 |
| C | 0 | 13473 | 1 |
| D | 0 | 14364 | 1 |
| Mode SS | |||
|---|---|---|---|
| Quadrant | BADHDUFLAG | Total packets | Discarded packets |
| A | 0 | 134 | 0 |
| B | 0 | 134 | 0 |
| C | 0 | 134 | 0 |
| D | 0 | 134 | 0 |
| Quadrant | Total seconds | Saturated seconds | Saturation percentage |
|---|---|---|---|
| A | 6516 | 108 | 1.657459% |
| B | 6516 | 33 | 0.506446% |
| C | 6517 | 62 | 0.951358% |
| D | 6517 | 66 | 1.012736% |
Noise dominated data is calculated using 1-second bins in cleaned event files. If a bin has >2000 counts, and if more than 50% of those come from <1% of pixels, then it is considered to be noise-dominated and hence unusable.
| Quadrant | # 1 sec bins | Bins with >0 counts | Bins with >2000 counts | High rate bins dominated by noise | Noise dominated (total time) | Noise dominated (detector-on time) | Marked lightcurve |
|---|---|---|---|---|---|---|---|
| A | 7446 | 6517 | 53 | 53 | 0.71% | 0.81% | 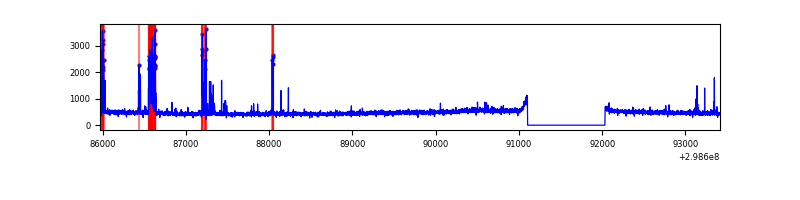 |
| B | 7446 | 6517 | 0 | 0 | 0.00% | 0.00% | 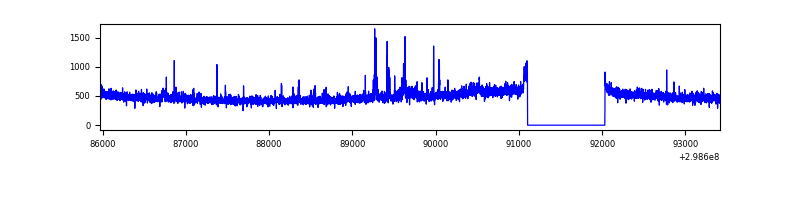 |
| C | 7447 | 6518 | 0 | 0 | 0.00% | 0.00% | 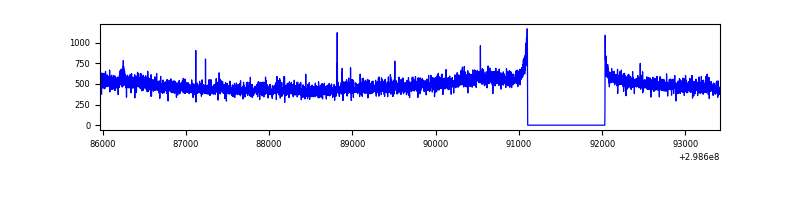 |
| D | 7447 | 6518 | 44 | 44 | 0.59% | 0.68% | 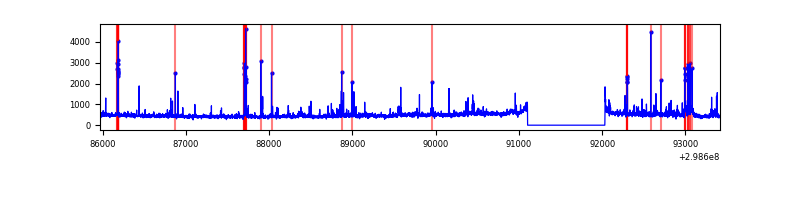 |
Top three noisy pixels from each quadrant. If the there are fewer than three noisy pixels in the level2.evt file, extra rows are filled as -1
| Pixel properties | Quadrant properties | ||||||
|---|---|---|---|---|---|---|---|
| Quadrant | DetID | PixID | Counts | Sigma | Mean | Median | Sigma |
| A | 14 | 238 | 274557 | 1714.51 | 789 | 774 | 159.7 |
| A | 0 | 226 | 6801 | 37.74 | 789 | 774 | 159.7 |
| A | 3 | 137 | 6432 | 35.43 | 789 | 774 | 159.7 |
| B | 10 | 245 | 47839 | 314.35 | 788 | 768 | 149.7 |
| B | 0 | 214 | 32003 | 208.59 | 788 | 768 | 149.7 |
| B | 12 | 111 | 17934 | 114.64 | 788 | 768 | 149.7 |
| C | 14 | 238 | 119159 | 666.65 | 758 | 766 | 177.6 |
| C | 3 | 233 | 43740 | 241.98 | 758 | 766 | 177.6 |
| C | 7 | 220 | 12868 | 68.14 | 758 | 766 | 177.6 |
| D | 1 | 52 | 308588 | 1634.99 | 765 | 744 | 188.3 |
| D | 7 | 238 | 45291 | 236.59 | 765 | 744 | 188.3 |
| D | 10 | 172 | 42153 | 219.93 | 765 | 744 | 188.3 |
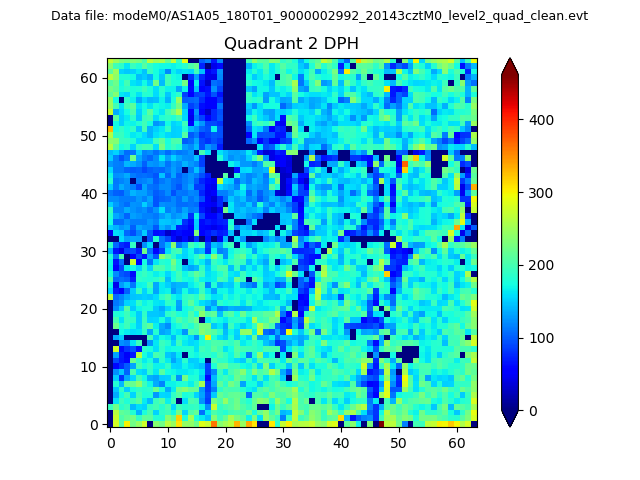
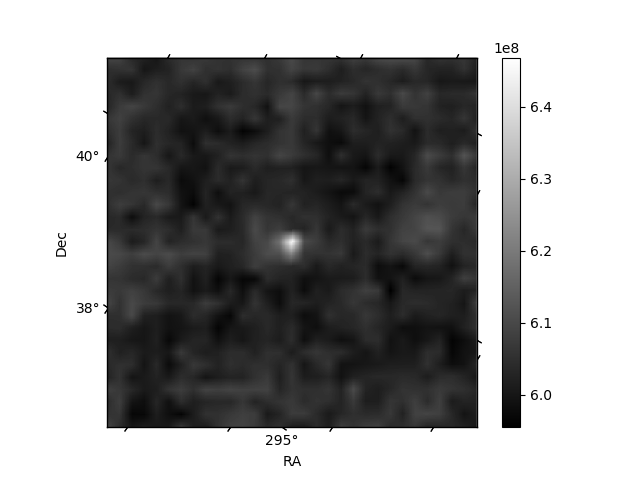
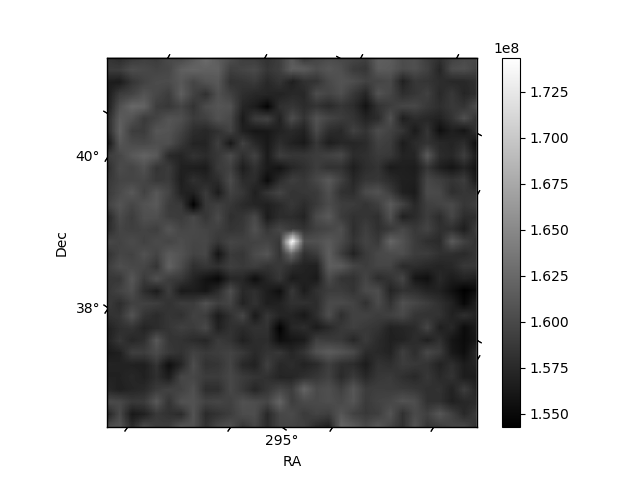
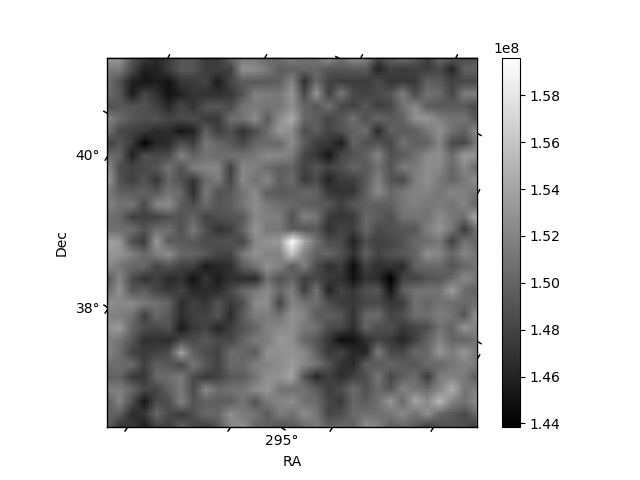
Histogram calculated using DETX and DETY for each event in the final _common_clean file
| Quadrant A | 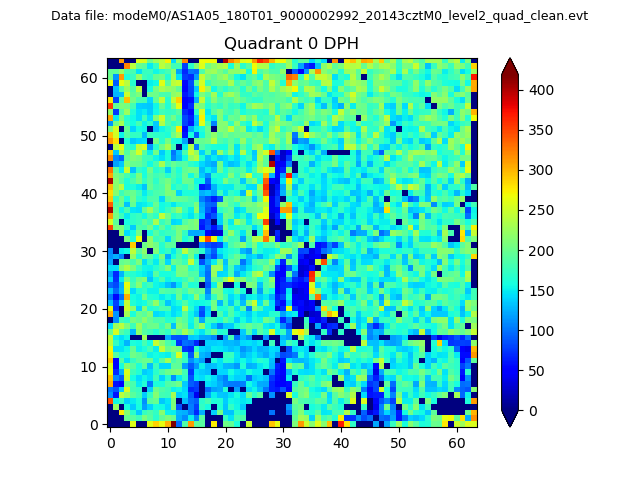 |
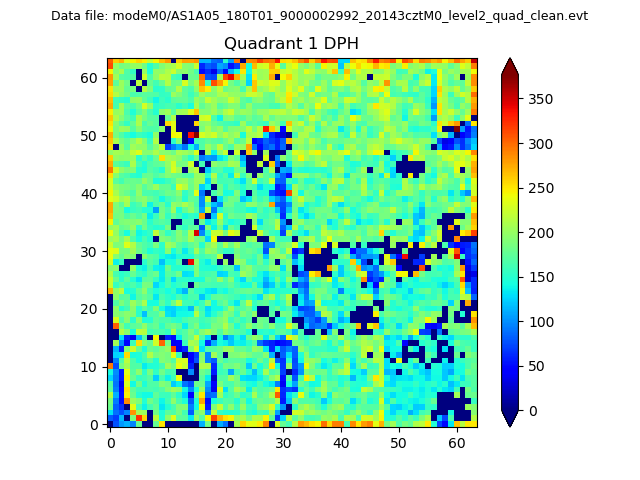 |
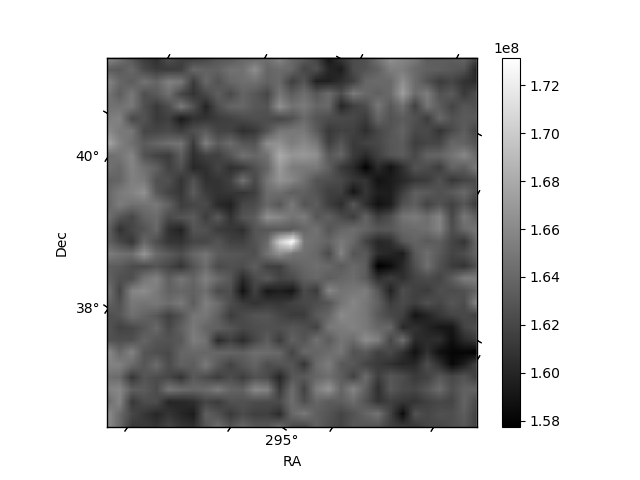
Quadrant B |
|---|---|---|---|
| Quadrant D | 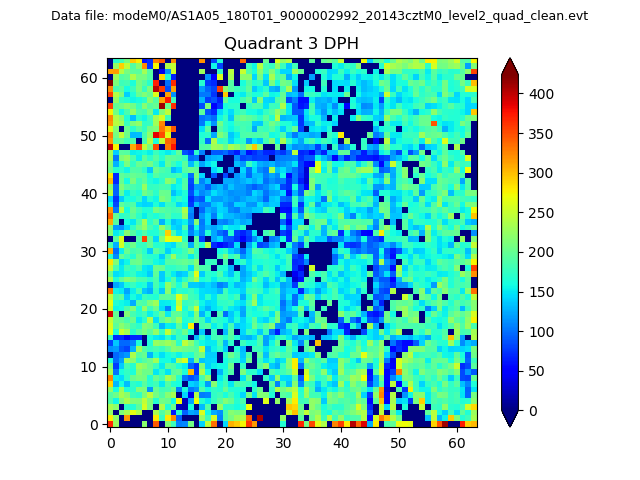 |
 |
Quadrant C |
| Plot type | Count rate plots | Images |
|---|---|---|
| Comparison with Poisson distribution Blue bars denote a histogram of data divided into 1 sec bins. Red curve is a Poisson curve with rate = median count rate of data. |
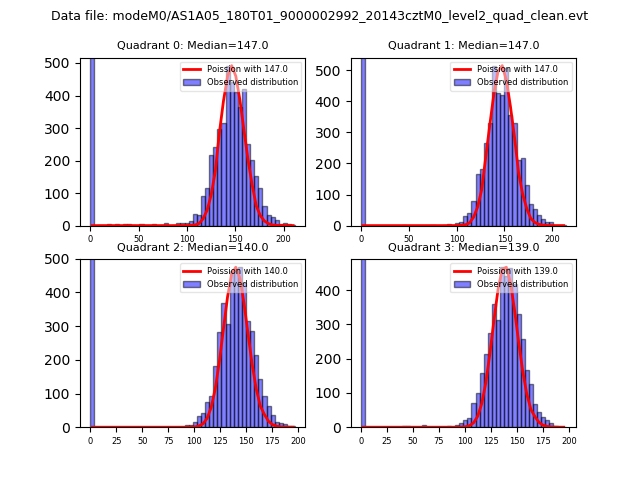 |
 |
| Quadrant-wise count rates Data is divided into 100 sec bins |
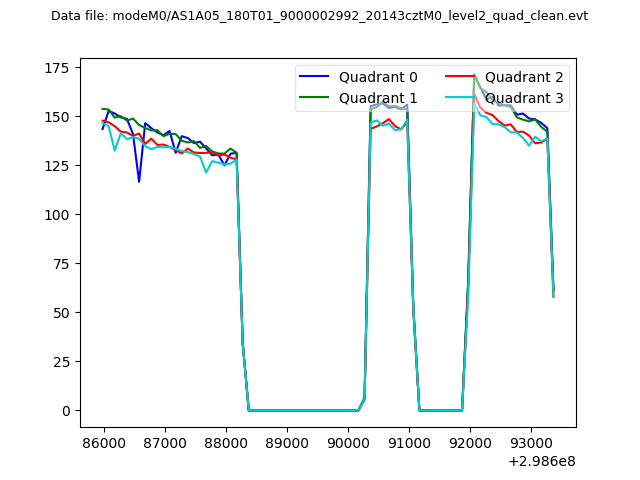 |
|
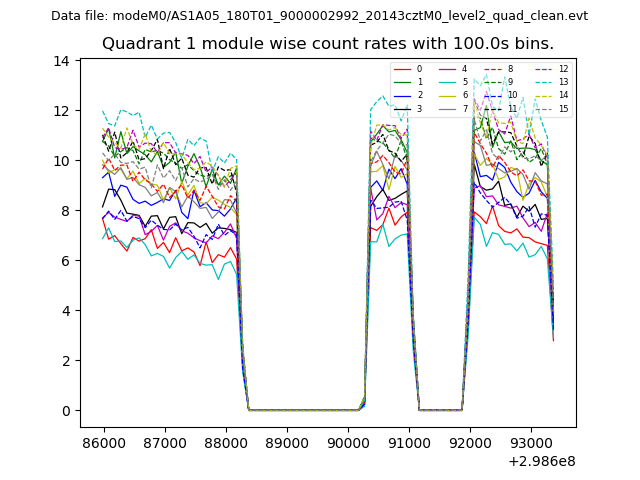
| Module-wise count rates for Quadrant A Data is divided into 100 sec bins |
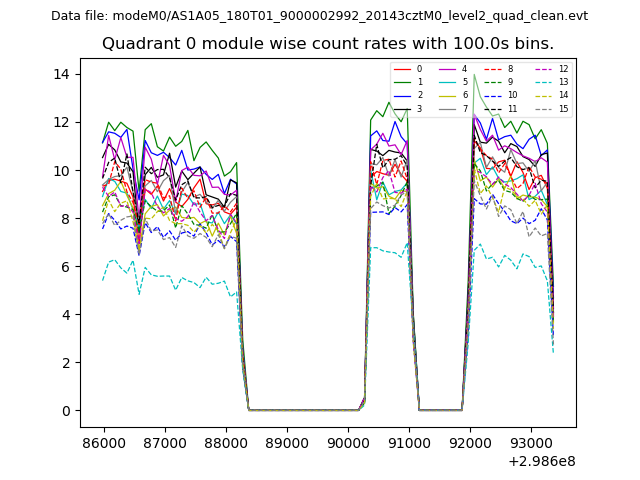 |
 |
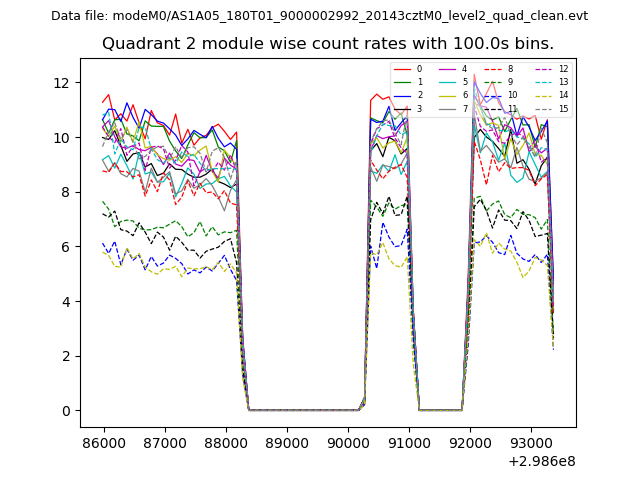
| Module-wise count rates for Quadrant B Data is divided into 100 sec bins |
 |
 |
| Module-wise count rates for Quadrant C Data is divided into 100 sec bins |
 |
 |
| Module-wise count rates for Quadrant D Data is divided into 100 sec bins |
 |
 |
| Parameter | Plot |
|---|---|
| CZT HV Monitor | 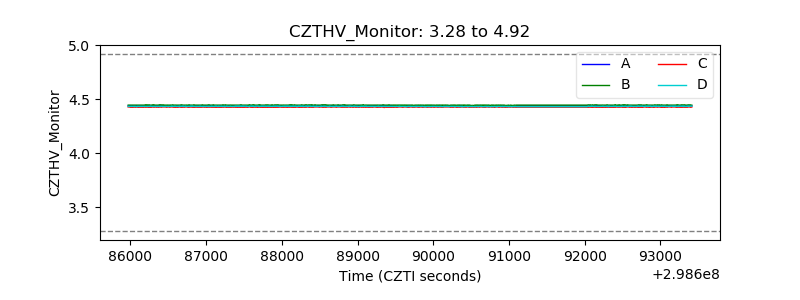 |
| D_VDD | 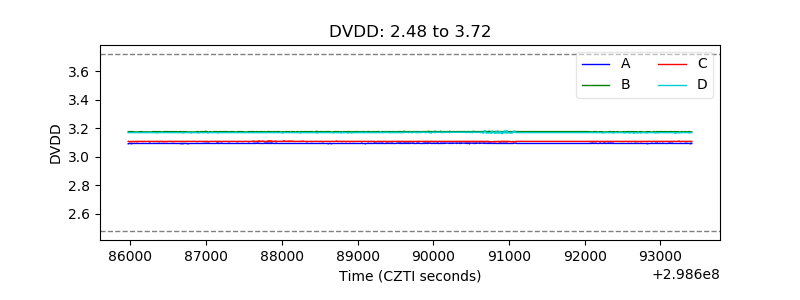 |
| Temperature 1 | 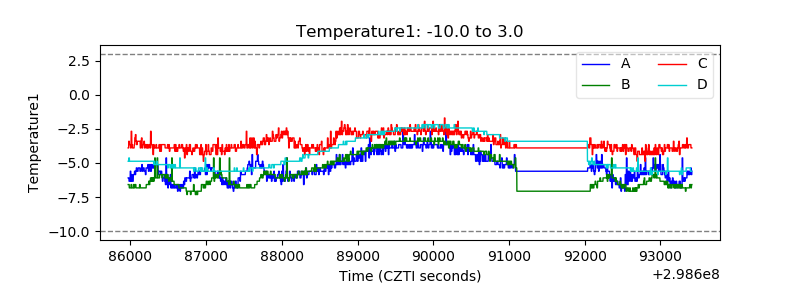 |
| Veto HV Monitor | 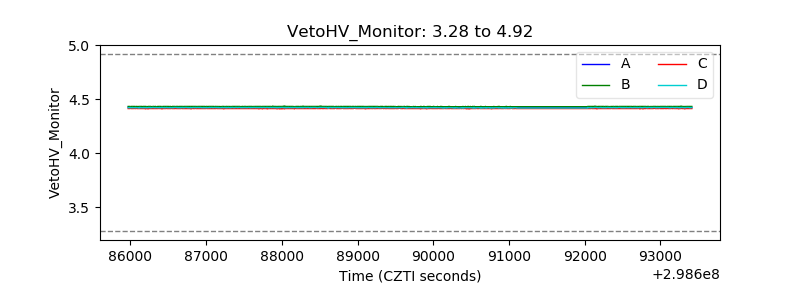 |
| Veto LLD | 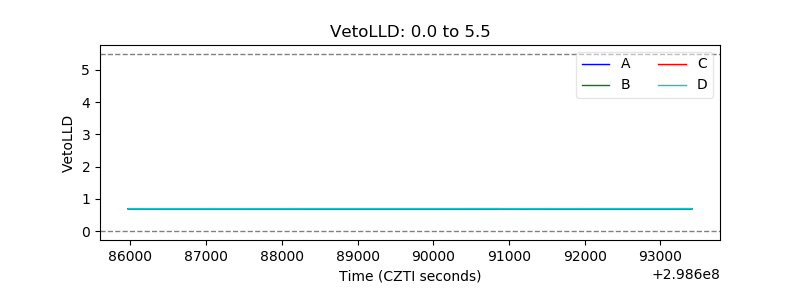 |
| Alpha Counter | 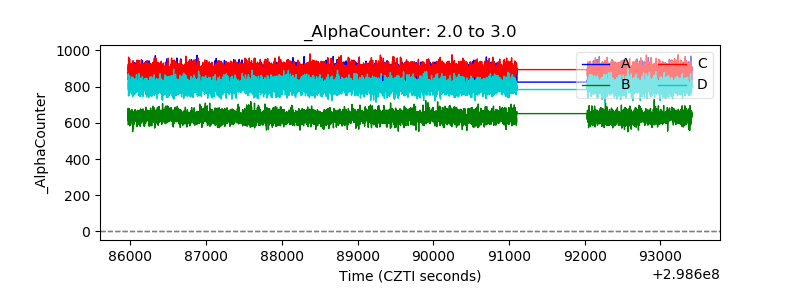 |
| _CPM_Rate | 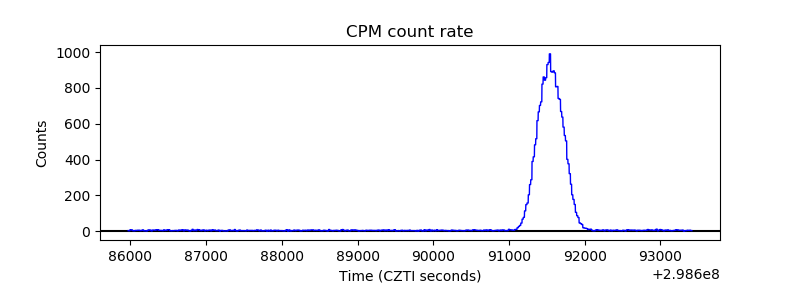 |
| CZT Counter | 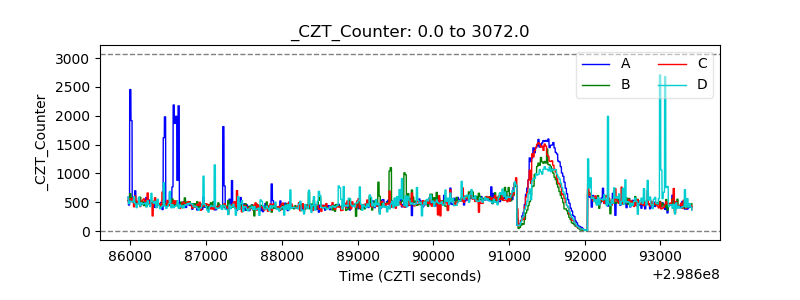 |
| +2.5 Volts monitor |  |
| +5 Volts monitor |  |
| _ROLL_ROT |  |
| _Roll_DEC | 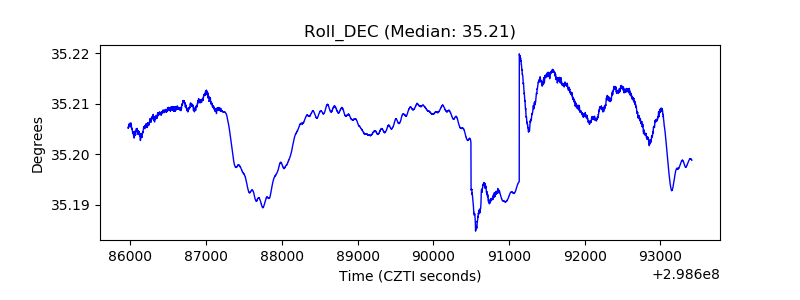 |
| _Roll_RA | 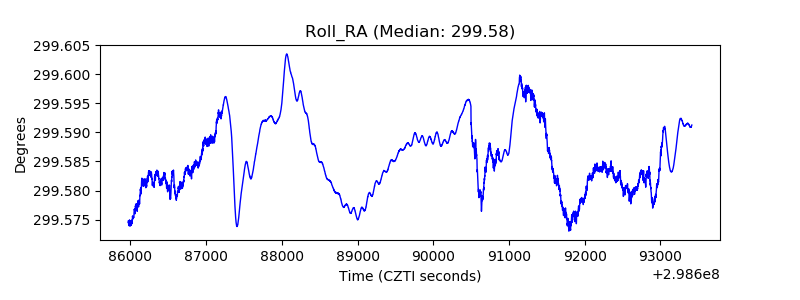 |
| Veto Counter | 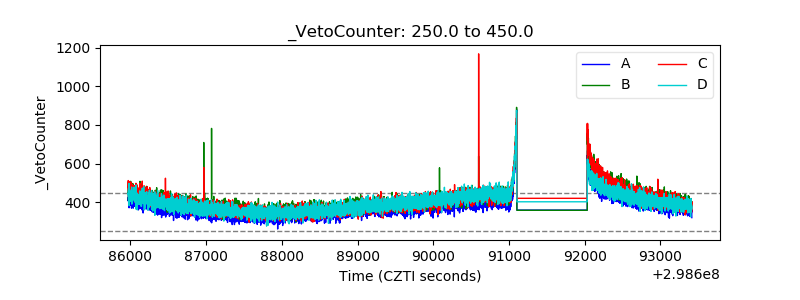 |