| Param | Original file | Final file |
|---|---|---|
| Filename | modeM0/AS1A05_180T01_9000002992_20148cztM0_level2.evt | modeM0/AS1A05_180T01_9000002992_20148cztM0_level2_quad_clean.evt |
| Size (bytes) | 1,693,301,760 | 282,479,040 |
| Size | 1.6 GB | 269.4 MB |
| Events in quadrant A | 12,754,850 | 1,831,121 |
| Events in quadrant B | 10,747,212 | 1,877,137 |
| Events in quadrant C | 11,095,481 | 1,766,629 |
| Events in quadrant D | 15,291,613 | 1,658,807 |
| Mode M9 | |||
|---|---|---|---|
| Quadrant | BADHDUFLAG | Total packets | Discarded packets |
| A | 0 | 48 | 0 |
| B | 0 | 48 | 0 |
| C | 0 | 48 | 0 |
| D | 0 | 48 | 0 |
| Mode M0 | |||
|---|---|---|---|
| Quadrant | BADHDUFLAG | Total packets | Discarded packets |
| A | 0 | 50527 | 4 |
| B | 0 | 44180 | 4 |
| C | 0 | 45302 | 4 |
| D | 0 | 59142 | 4 |
| Mode SS | |||
|---|---|---|---|
| Quadrant | BADHDUFLAG | Total packets | Discarded packets |
| A | 0 | 422 | 0 |
| B | 0 | 422 | 0 |
| C | 0 | 422 | 0 |
| D | 0 | 422 | 0 |
| Quadrant | Total seconds | Saturated seconds | Saturation percentage |
|---|---|---|---|
| A | 20640 | 918 | 4.447674% |
| B | 20641 | 217 | 1.051306% |
| C | 20640 | 285 | 1.380814% |
| D | 20640 | 1884 | 9.127907% |
Noise dominated data is calculated using 1-second bins in cleaned event files. If a bin has >2000 counts, and if more than 50% of those come from <1% of pixels, then it is considered to be noise-dominated and hence unusable.
| Quadrant | # 1 sec bins | Bins with >0 counts | Bins with >2000 counts | High rate bins dominated by noise | Noise dominated (total time) | Noise dominated (detector-on time) | Marked lightcurve |
|---|---|---|---|---|---|---|---|
| A | 25511 | 20644 | 462 | 462 | 1.81% | 2.24% | 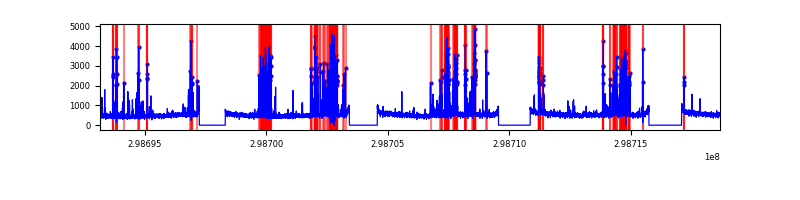 |
| B | 25512 | 20645 | 9 | 9 | 0.04% | 0.04% | 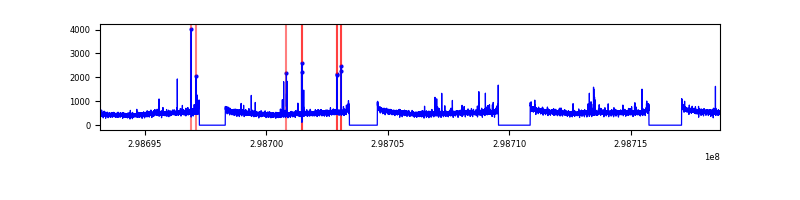 |
| C | 25511 | 20644 | 17 | 17 | 0.07% | 0.08% |  |
| D | 25511 | 20643 | 696 | 696 | 2.73% | 3.37% | 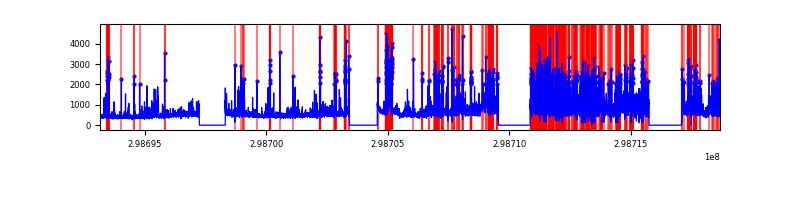 |
Top three noisy pixels from each quadrant. If the there are fewer than three noisy pixels in the level2.evt file, extra rows are filled as -1
| Pixel properties | Quadrant properties | ||||||
|---|---|---|---|---|---|---|---|
| Quadrant | DetID | PixID | Counts | Sigma | Mean | Median | Sigma |
| A | 14 | 238 | 2334116 | 4349.59 | 2702 | 2664 | 536.0 |
| A | 0 | 226 | 23326 | 38.55 | 2702 | 2664 | 536.0 |
| A | 3 | 137 | 21116 | 34.42 | 2702 | 2664 | 536.0 |
| B | 4 | 80 | 101070 | 195.86 | 2701 | 2647 | 502.5 |
| B | 12 | 111 | 59633 | 113.4 | 2701 | 2647 | 502.5 |
| B | 11 | 111 | 53297 | 100.79 | 2701 | 2647 | 502.5 |
| C | 3 | 233 | 628058 | 1061.89 | 2567 | 2596 | 589.0 |
| C | 14 | 238 | 415059 | 700.27 | 2567 | 2596 | 589.0 |
| C | 0 | 207 | 43036 | 68.66 | 2567 | 2596 | 589.0 |
| D | 1 | 52 | 4413274 | 7307.78 | 2523 | 2455 | 603.6 |
| D | 11 | 176 | 659967 | 1089.36 | 2523 | 2455 | 603.6 |
| D | 1 | 20 | 198643 | 325.04 | 2523 | 2455 | 603.6 |
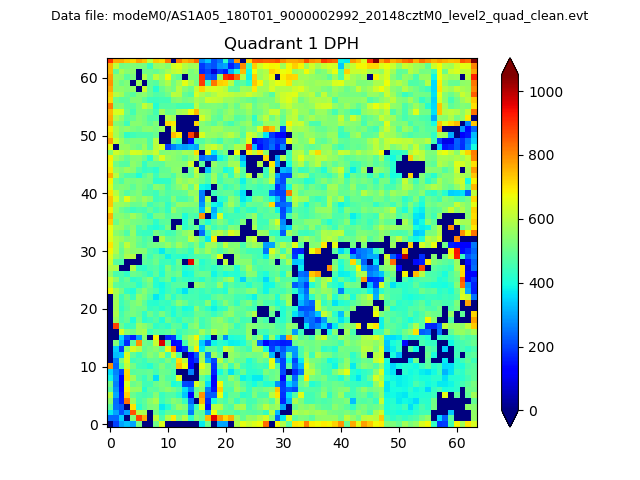
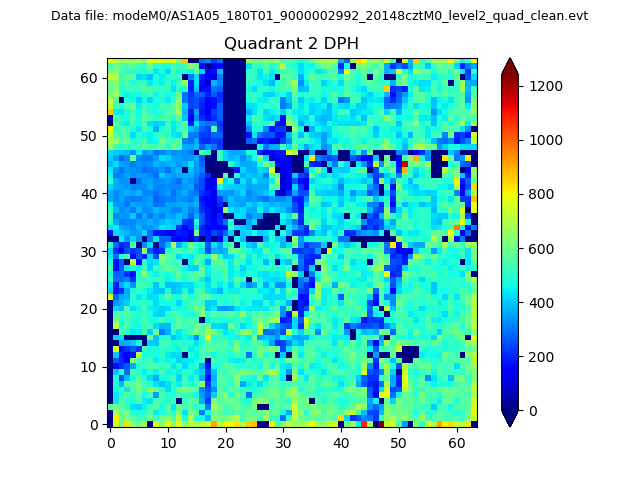
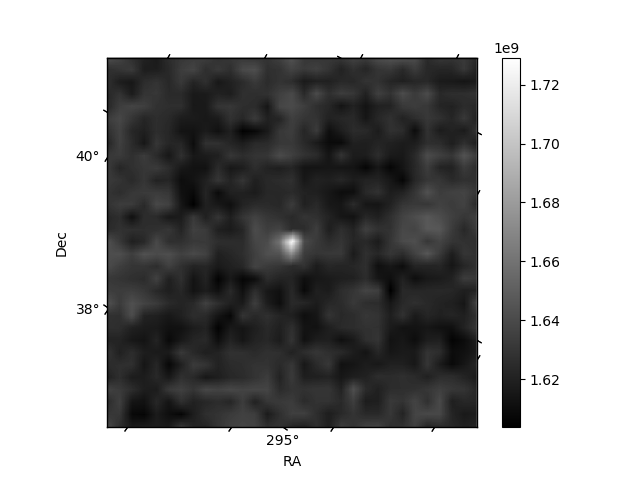
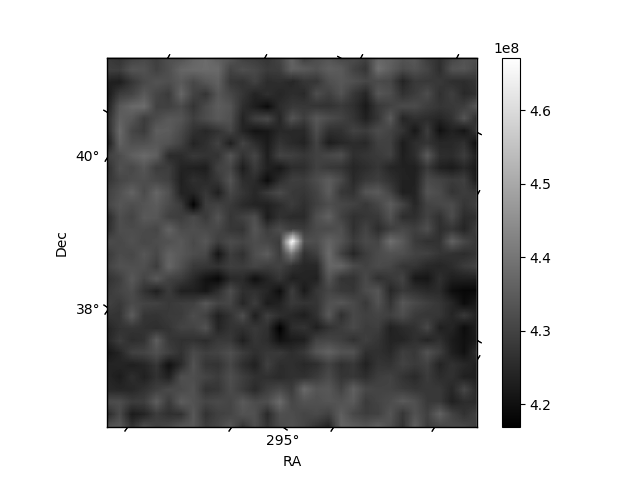
Histogram calculated using DETX and DETY for each event in the final _common_clean file
| Quadrant A | 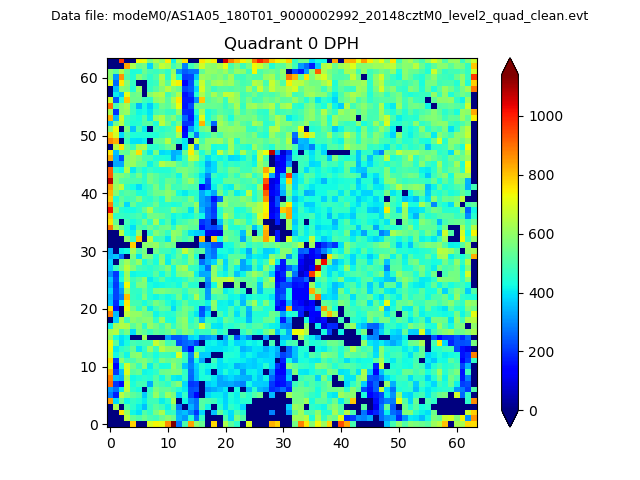 |
 |
Quadrant B |
|---|---|---|---|
| Quadrant D | 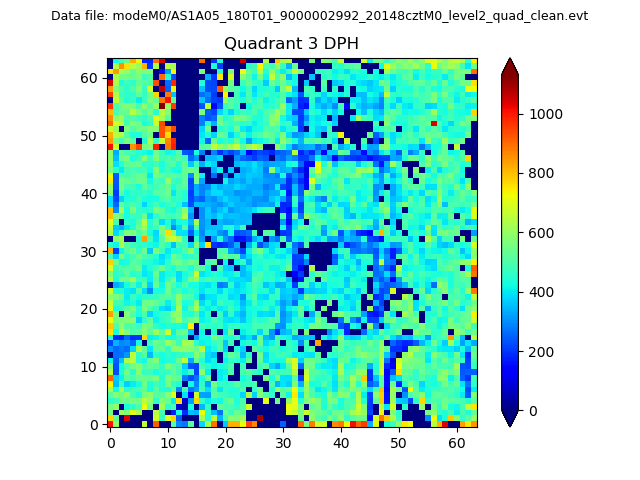 |
 |
Quadrant C |
| Plot type | Count rate plots | Images |
|---|---|---|
| Comparison with Poisson distribution Blue bars denote a histogram of data divided into 1 sec bins. Red curve is a Poisson curve with rate = median count rate of data. |
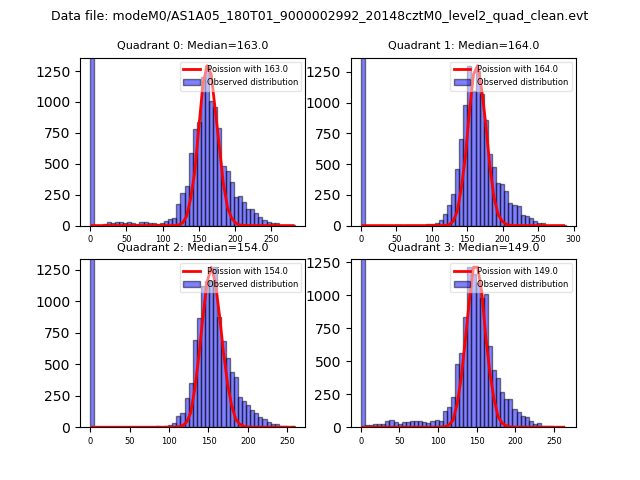 |
 |
| Quadrant-wise count rates Data is divided into 100 sec bins |
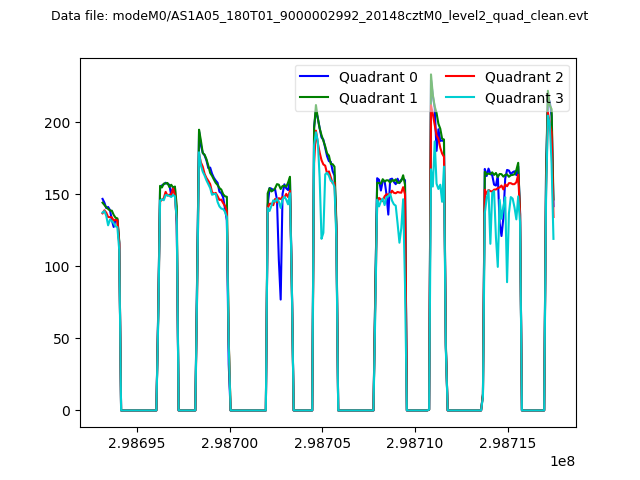 |
|
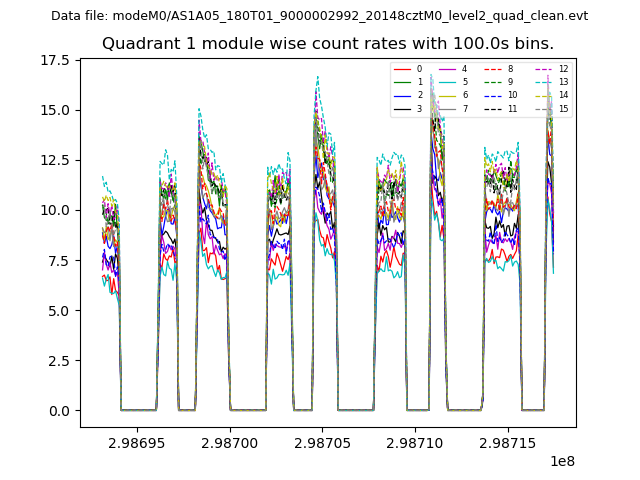
| Module-wise count rates for Quadrant A Data is divided into 100 sec bins |
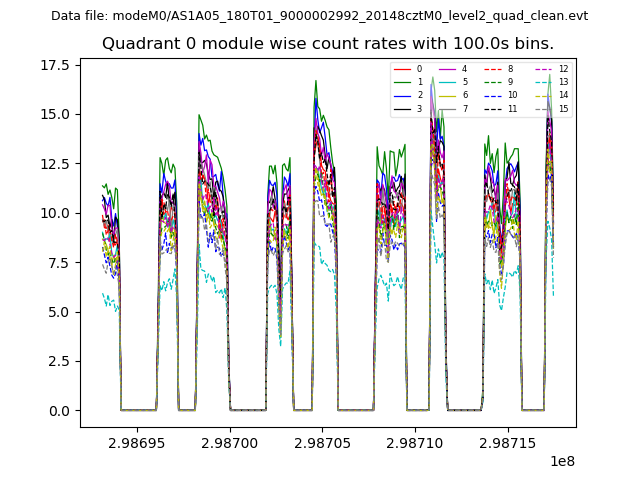 |
 |
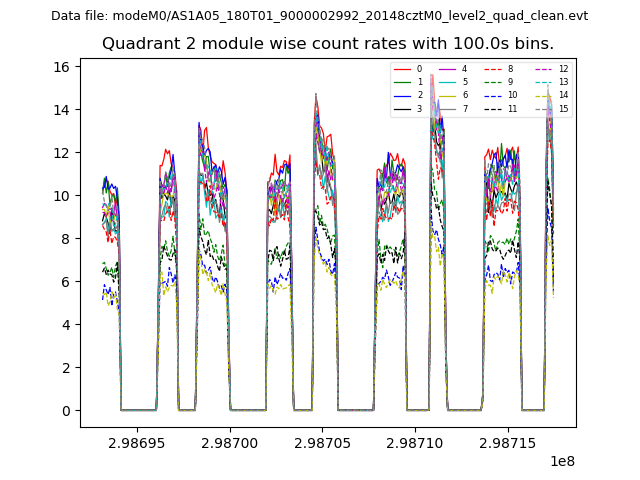
| Module-wise count rates for Quadrant B Data is divided into 100 sec bins |
 |
 |
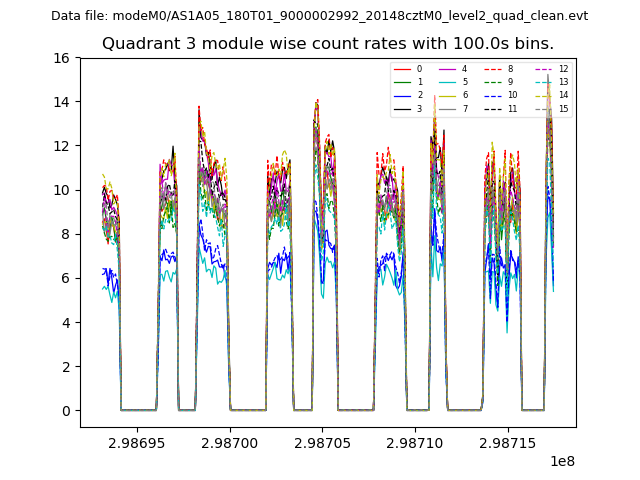
| Module-wise count rates for Quadrant C Data is divided into 100 sec bins |
 |
 |
| Module-wise count rates for Quadrant D Data is divided into 100 sec bins |
 |
 |
| Parameter | Plot |
|---|---|
| CZT HV Monitor | 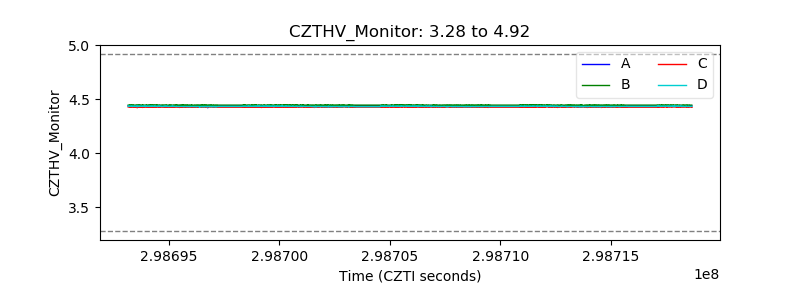 |
| D_VDD | 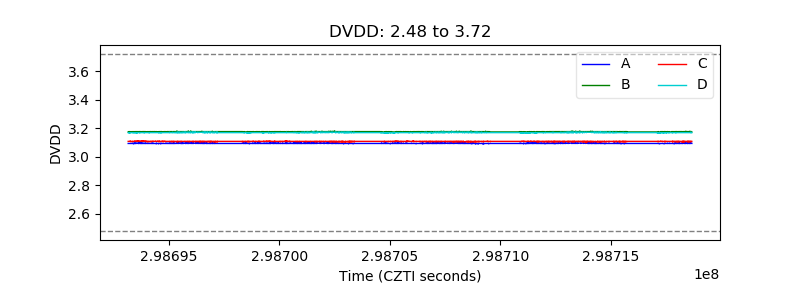 |
| Temperature 1 | 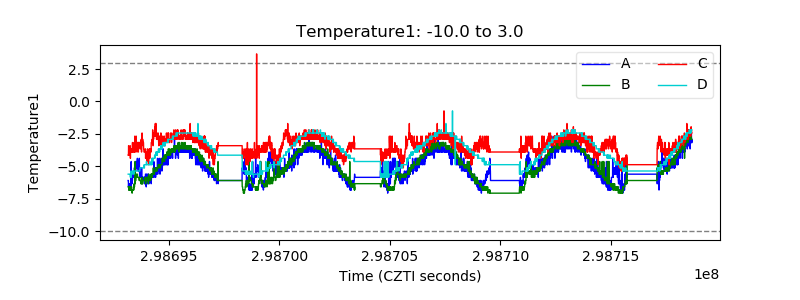 |
| Veto HV Monitor | 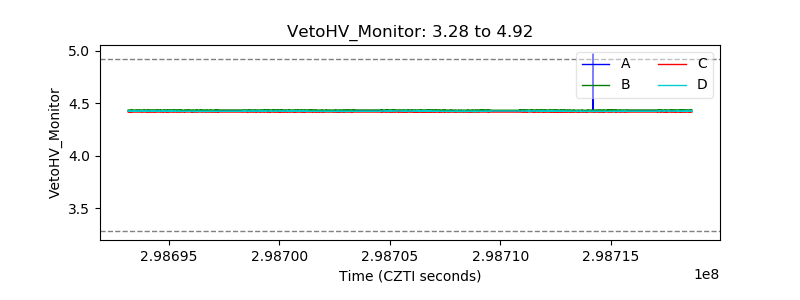 |
| Veto LLD | 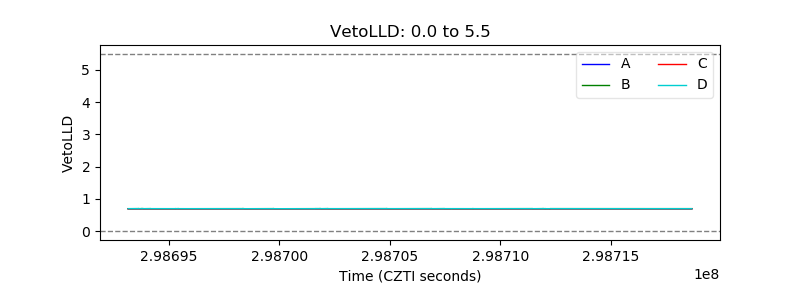 |
| Alpha Counter | 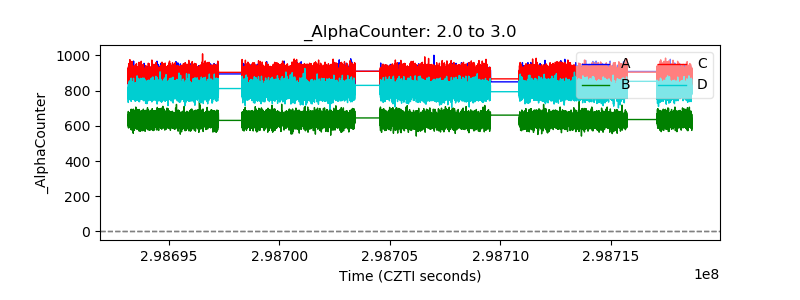 |
| _CPM_Rate | 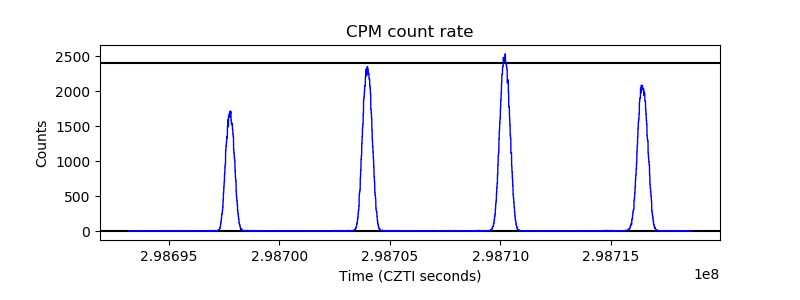 |
| CZT Counter | 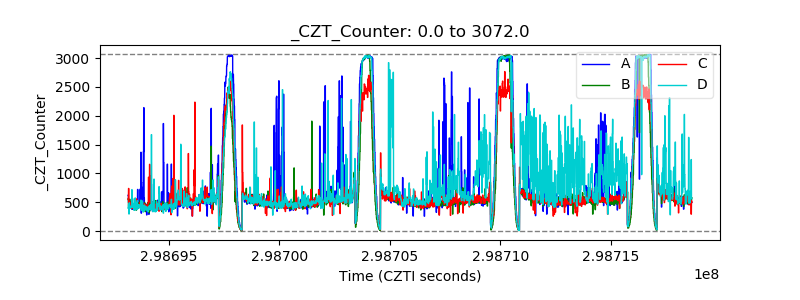 |
| +2.5 Volts monitor | 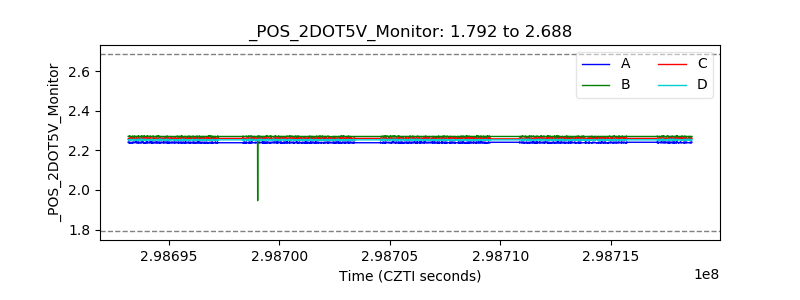 |
| +5 Volts monitor |  |
| _ROLL_ROT | 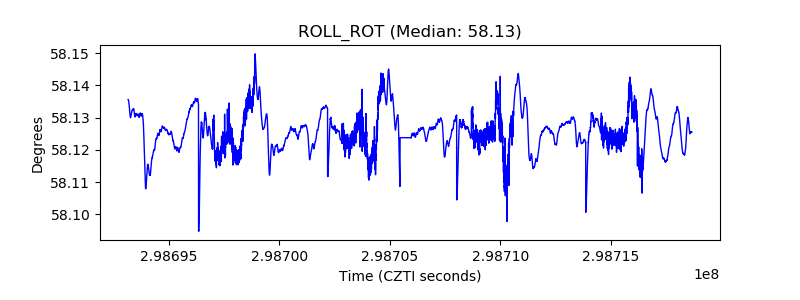 |
| _Roll_DEC | 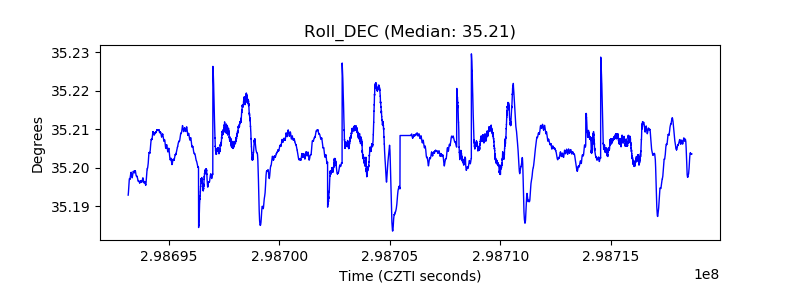 |
| _Roll_RA | 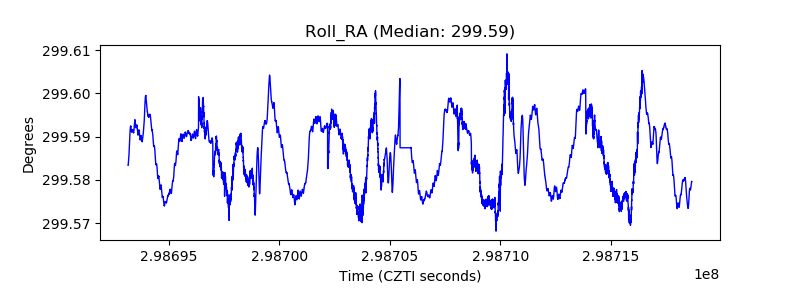 |
| Veto Counter | 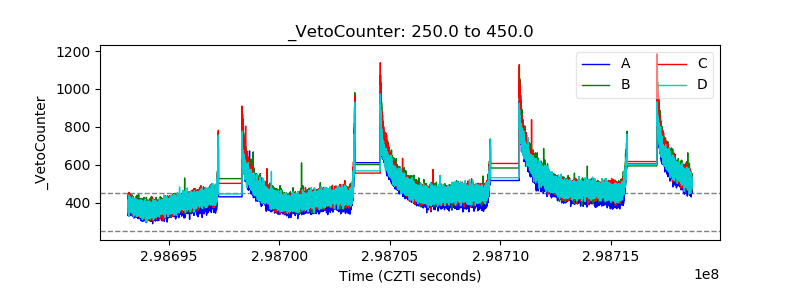 |