| Param | Original file | Final file |
|---|---|---|
| Filename | modeM0/AS1A05_180T01_9000002992_20149cztM0_level2.evt | modeM0/AS1A05_180T01_9000002992_20149cztM0_level2_quad_clean.evt |
| Size (bytes) | 527,944,320 | 79,341,120 |
| Size | 503.5 MB | 75.7 MB |
| Events in quadrant A | 3,579,947 | 509,037 |
| Events in quadrant B | 3,545,732 | 506,799 |
| Events in quadrant C | 3,524,302 | 478,177 |
| Events in quadrant D | 4,908,811 | 465,943 |
| Mode M9 | |||
|---|---|---|---|
| Quadrant | BADHDUFLAG | Total packets | Discarded packets |
| A | 0 | 14 | 0 |
| B | 0 | 15 | 0 |
| C | 0 | 15 | 0 |
| D | 0 | 15 | 0 |
| Mode M0 | |||
|---|---|---|---|
| Quadrant | BADHDUFLAG | Total packets | Discarded packets |
| A | 0 | 14296 | 2 |
| B | 0 | 14157 | 2 |
| C | 0 | 14045 | 2 |
| D | 0 | 18654 | 2 |
| Mode SS | |||
|---|---|---|---|
| Quadrant | BADHDUFLAG | Total packets | Discarded packets |
| A | 0 | 130 | 0 |
| B | 0 | 130 | 0 |
| C | 0 | 130 | 0 |
| D | 0 | 130 | 0 |
| Quadrant | Total seconds | Saturated seconds | Saturation percentage |
|---|---|---|---|
| A | 6337 | 131 | 2.067224% |
| B | 6337 | 141 | 2.225028% |
| C | 6337 | 155 | 2.445952% |
| D | 6337 | 401 | 6.327915% |
Noise dominated data is calculated using 1-second bins in cleaned event files. If a bin has >2000 counts, and if more than 50% of those come from <1% of pixels, then it is considered to be noise-dominated and hence unusable.
| Quadrant | # 1 sec bins | Bins with >0 counts | Bins with >2000 counts | High rate bins dominated by noise | Noise dominated (total time) | Noise dominated (detector-on time) | Marked lightcurve |
|---|---|---|---|---|---|---|---|
| A | 7652 | 6338 | 5 | 5 | 0.07% | 0.08% | 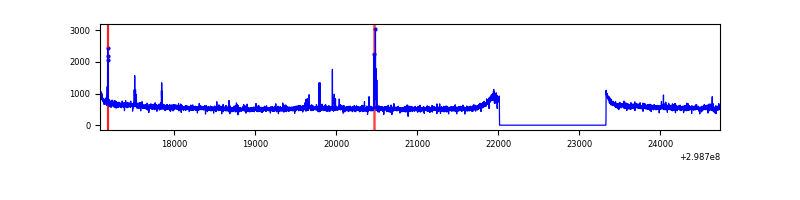 |
| B | 7652 | 6338 | 1 | 1 | 0.01% | 0.02% | 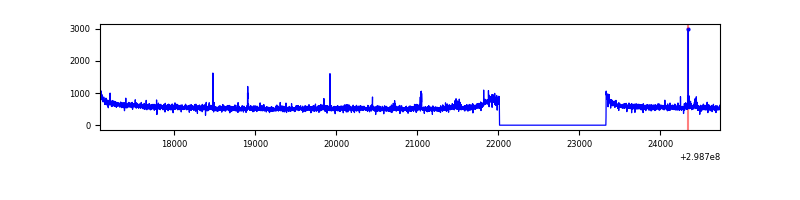 |
| C | 7652 | 6338 | 0 | 0 | 0.00% | 0.00% | 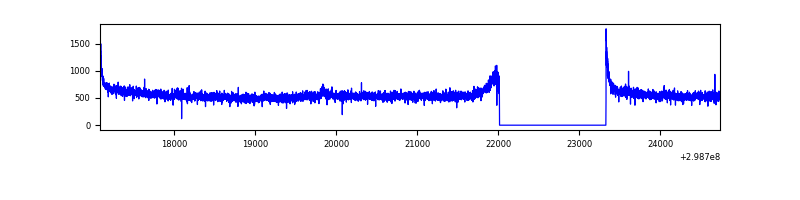 |
| D | 7652 | 6338 | 241 | 241 | 3.15% | 3.80% | 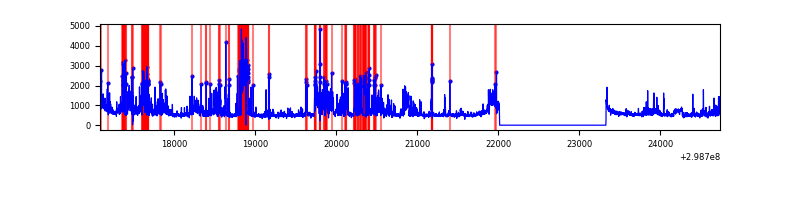 |
Top three noisy pixels from each quadrant. If the there are fewer than three noisy pixels in the level2.evt file, extra rows are filled as -1
| Pixel properties | Quadrant properties | ||||||
|---|---|---|---|---|---|---|---|
| Quadrant | DetID | PixID | Counts | Sigma | Mean | Median | Sigma |
| A | 14 | 238 | 62710 | 346.61 | 910 | 896 | 178.3 |
| A | 11 | 29 | 11003 | 56.67 | 910 | 896 | 178.3 |
| A | 0 | 226 | 7916 | 39.36 | 910 | 896 | 178.3 |
| B | 0 | 198 | 20519 | 118.53 | 891 | 875 | 165.7 |
| B | 12 | 111 | 19035 | 109.58 | 891 | 875 | 165.7 |
| B | 11 | 111 | 17125 | 98.05 | 891 | 875 | 165.7 |
| C | 14 | 238 | 137941 | 705.58 | 845 | 855 | 194.3 |
| C | 3 | 233 | 90199 | 459.86 | 845 | 855 | 194.3 |
| C | 13 | 61 | 5917 | 26.05 | 845 | 855 | 194.3 |
| D | 1 | 52 | 878525 | 4290.79 | 854 | 833 | 204.6 |
| D | 11 | 176 | 721576 | 3523.51 | 854 | 833 | 204.6 |
| D | 7 | 96 | 47368 | 227.5 | 854 | 833 | 204.6 |
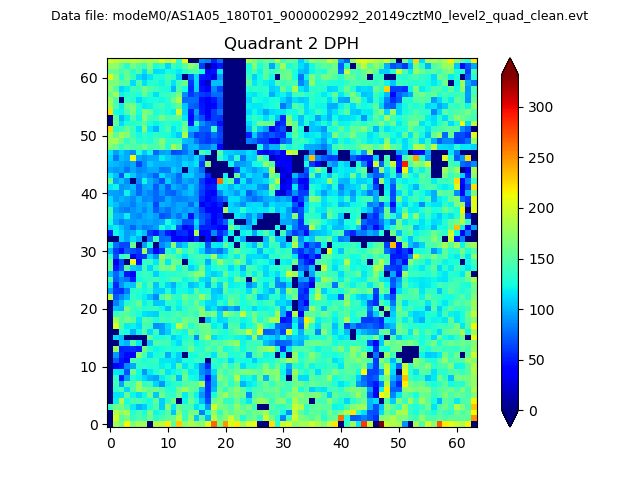
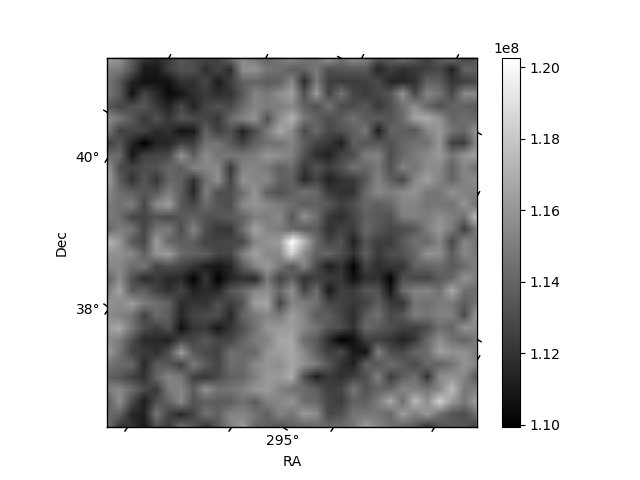
Histogram calculated using DETX and DETY for each event in the final _common_clean file
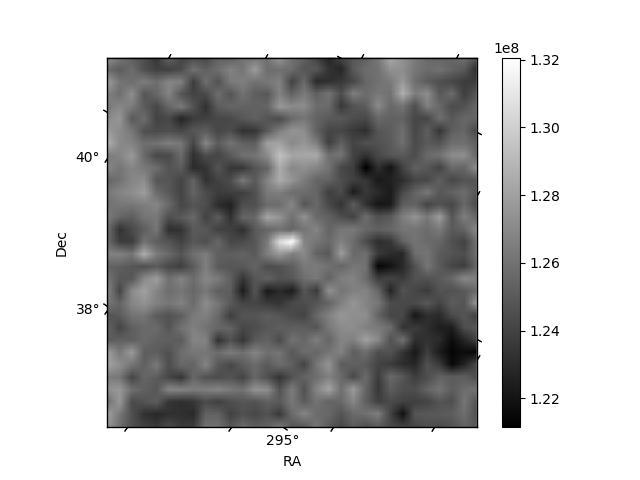
| Quadrant A | 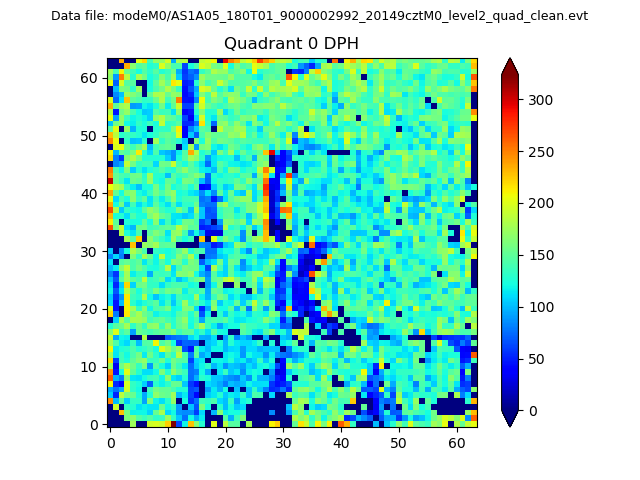 |
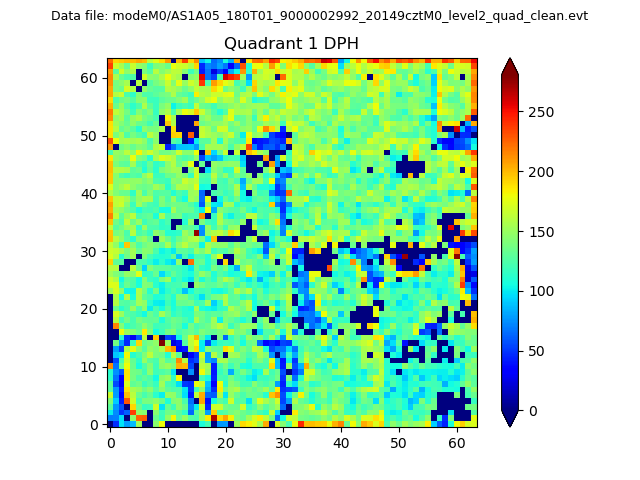 |
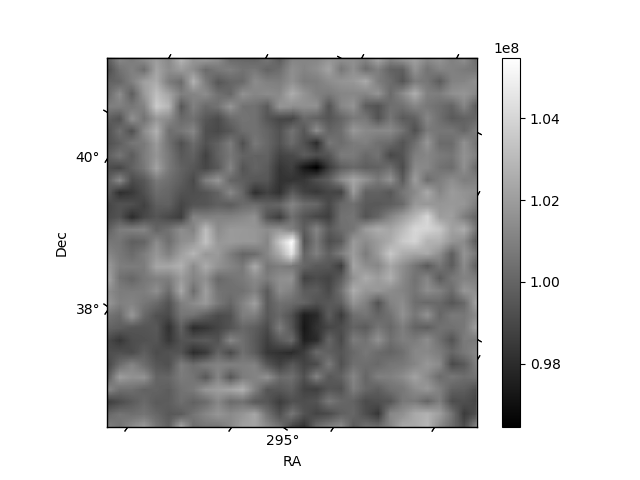
Quadrant B |
|---|---|---|---|
| Quadrant D | 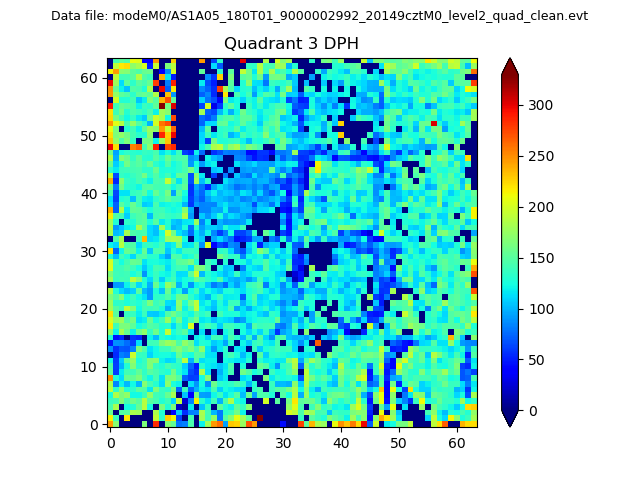 |
 |
Quadrant C |
| Plot type | Count rate plots | Images |
|---|---|---|
| Comparison with Poisson distribution Blue bars denote a histogram of data divided into 1 sec bins. Red curve is a Poisson curve with rate = median count rate of data. |
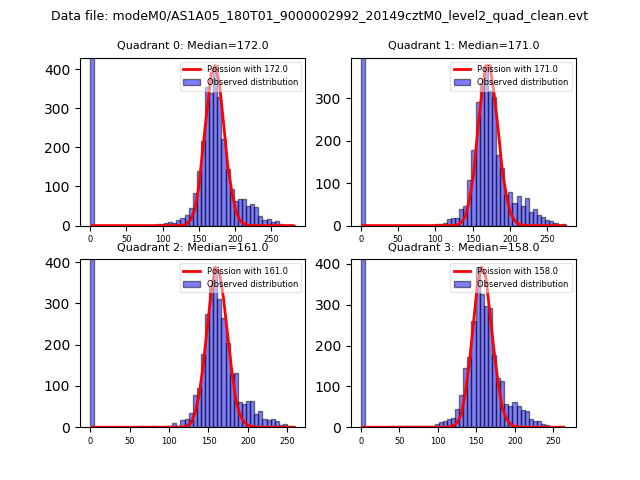 |
 |
| Quadrant-wise count rates Data is divided into 100 sec bins |
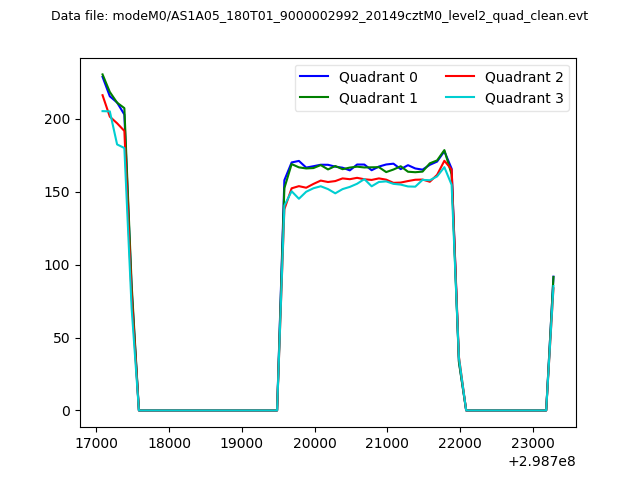 |
|
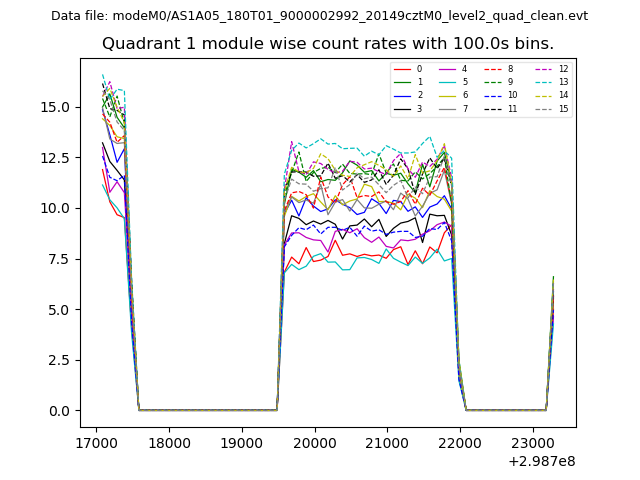
| Module-wise count rates for Quadrant A Data is divided into 100 sec bins |
 |
 |
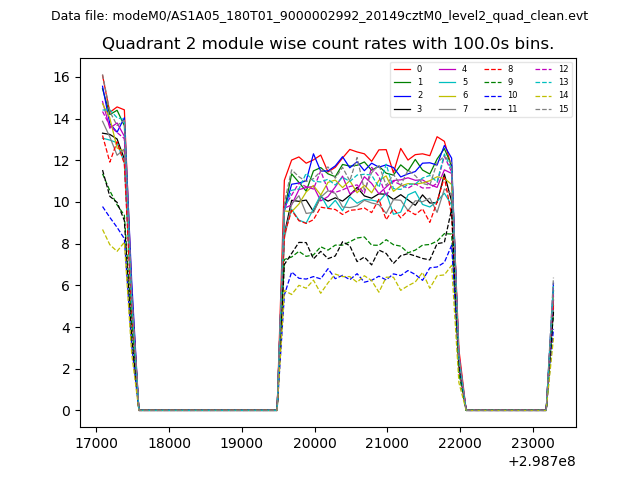
| Module-wise count rates for Quadrant B Data is divided into 100 sec bins |
 |
 |
| Module-wise count rates for Quadrant C Data is divided into 100 sec bins |
 |
 |
| Module-wise count rates for Quadrant D Data is divided into 100 sec bins |
 |
 |
| Parameter | Plot |
|---|---|
| CZT HV Monitor | 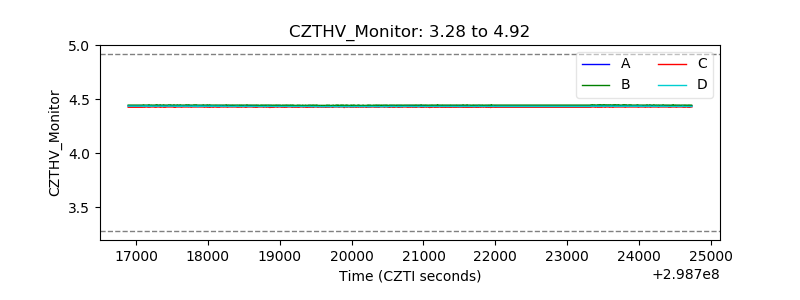 |
| D_VDD | 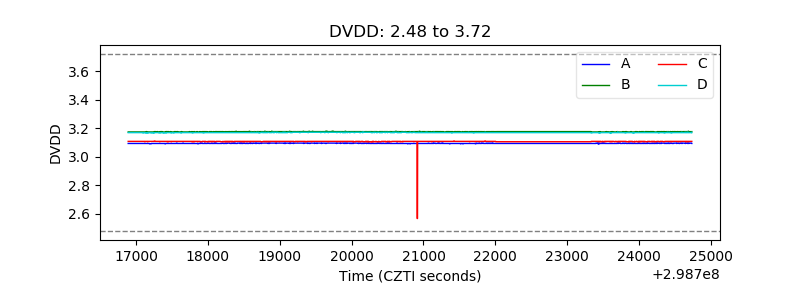 |
| Temperature 1 | 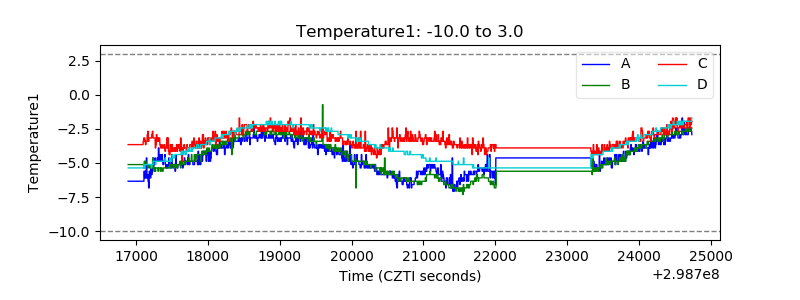 |
| Veto HV Monitor | 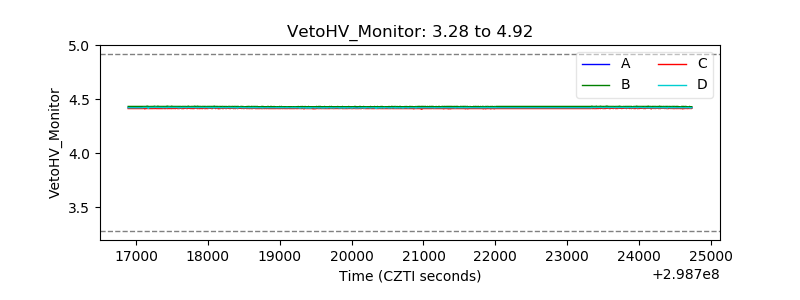 |
| Veto LLD | 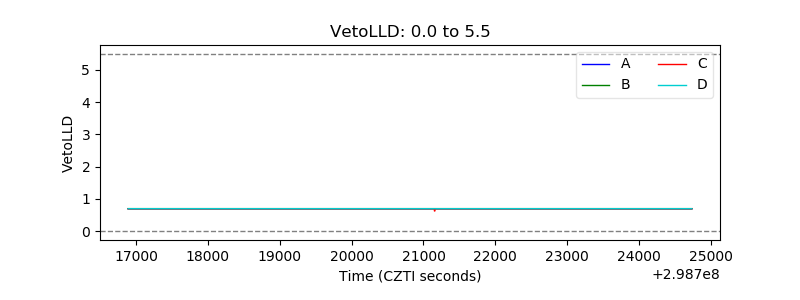 |
| Alpha Counter | 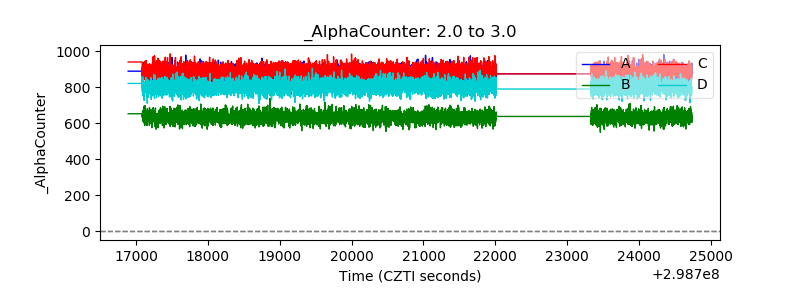 |
| _CPM_Rate | 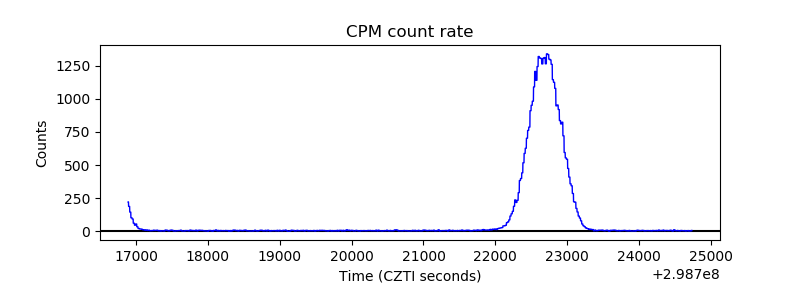 |
| CZT Counter | 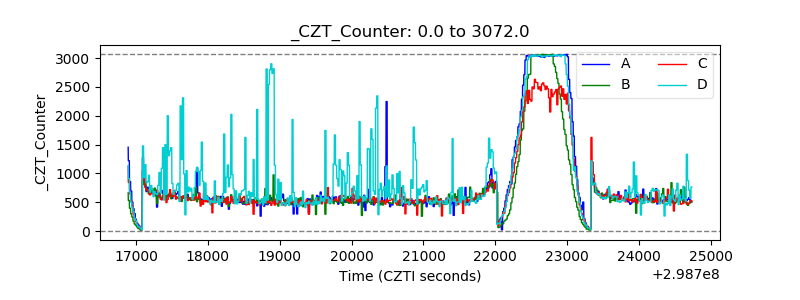 |
| +2.5 Volts monitor |  |
| +5 Volts monitor |  |
| _ROLL_ROT | 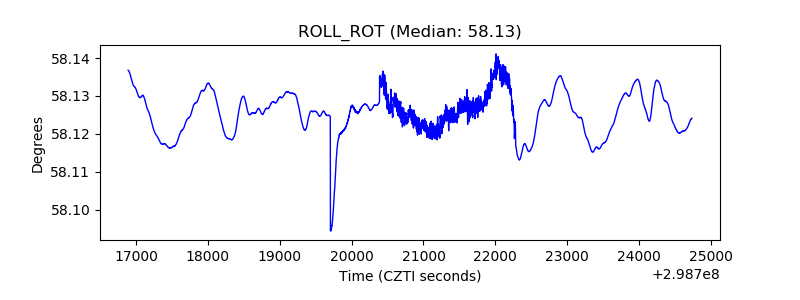 |
| _Roll_DEC | 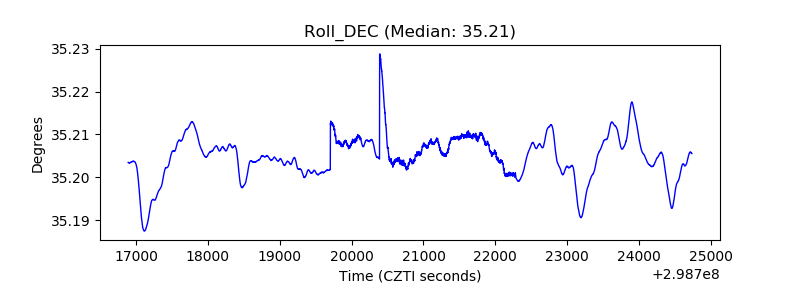 |
| _Roll_RA | 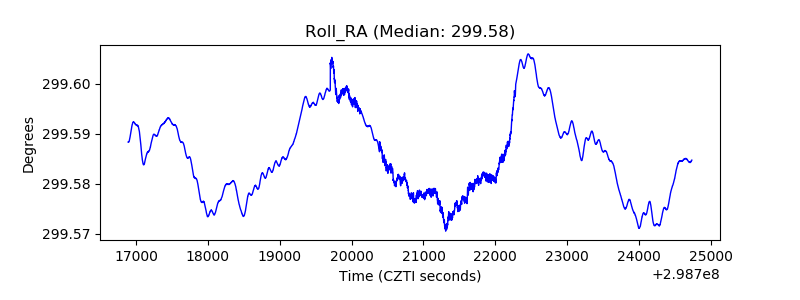 |
| Veto Counter | 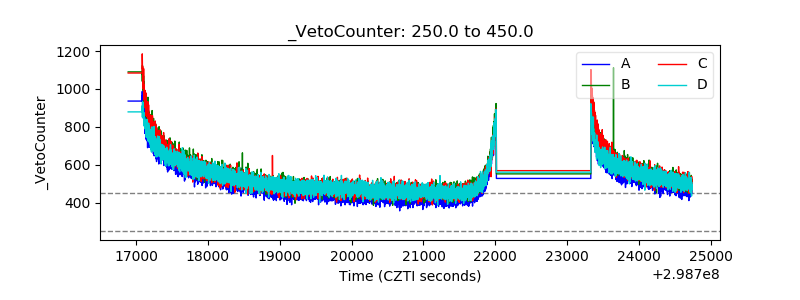 |