| Param | Original file | Final file |
|---|---|---|
| Filename | modeM0/AS1A05_180T01_9000002992_20151cztM0_level2.evt | modeM0/AS1A05_180T01_9000002992_20151cztM0_level2_quad_clean.evt |
| Size (bytes) | 529,790,400 | 90,642,240 |
| Size | 505.2 MB | 86.4 MB |
| Events in quadrant A | 3,643,077 | 589,414 |
| Events in quadrant B | 3,615,009 | 586,322 |
| Events in quadrant C | 3,675,555 | 559,999 |
| Events in quadrant D | 4,652,169 | 537,847 |
| Mode M9 | |||
|---|---|---|---|
| Quadrant | BADHDUFLAG | Total packets | Discarded packets |
| A | 0 | 14 | 0 |
| B | 0 | 15 | 0 |
| C | 0 | 15 | 0 |
| D | 0 | 15 | 0 |
| Mode M0 | |||
|---|---|---|---|
| Quadrant | BADHDUFLAG | Total packets | Discarded packets |
| A | 0 | 14627 | 2 |
| B | 0 | 14646 | 2 |
| C | 0 | 14613 | 2 |
| D | 0 | 18062 | 2 |
| Mode SS | |||
|---|---|---|---|
| Quadrant | BADHDUFLAG | Total packets | Discarded packets |
| A | 0 | 138 | 0 |
| B | 0 | 138 | 0 |
| C | 0 | 138 | 0 |
| D | 0 | 138 | 0 |
| Quadrant | Total seconds | Saturated seconds | Saturation percentage |
|---|---|---|---|
| A | 6758 | 162 | 2.397159% |
| B | 6758 | 127 | 1.879254% |
| C | 6758 | 158 | 2.337970% |
| D | 6758 | 582 | 8.612015% |
Noise dominated data is calculated using 1-second bins in cleaned event files. If a bin has >2000 counts, and if more than 50% of those come from <1% of pixels, then it is considered to be noise-dominated and hence unusable.
| Quadrant | # 1 sec bins | Bins with >0 counts | Bins with >2000 counts | High rate bins dominated by noise | Noise dominated (total time) | Noise dominated (detector-on time) | Marked lightcurve |
|---|---|---|---|---|---|---|---|
| A | 7663 | 6759 | 29 | 29 | 0.38% | 0.43% | 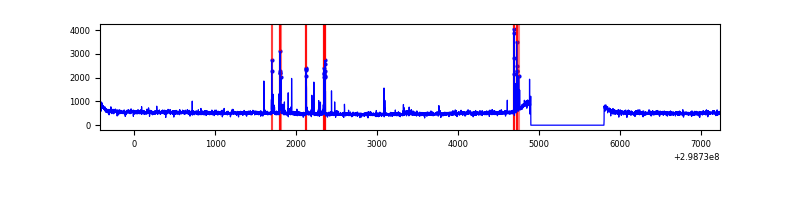 |
| B | 7663 | 6759 | 9 | 9 | 0.12% | 0.13% | 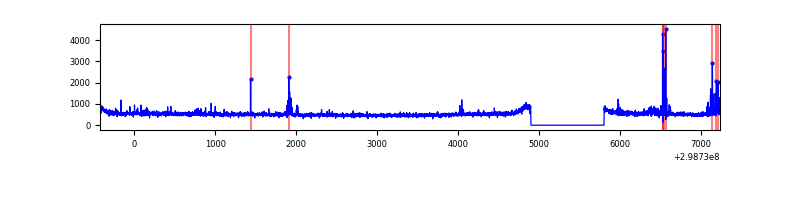 |
| C | 7663 | 6759 | 0 | 0 | 0.00% | 0.00% | 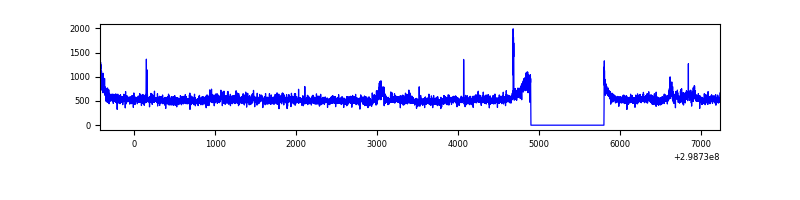 |
| D | 7663 | 6759 | 233 | 233 | 3.04% | 3.45% | 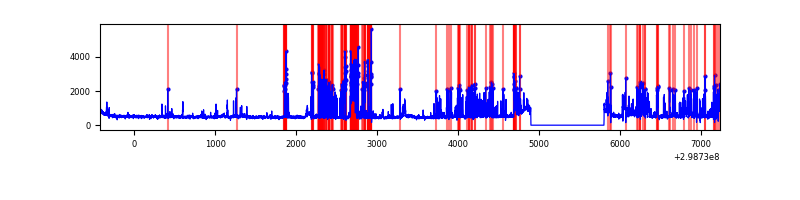 |
Top three noisy pixels from each quadrant. If the there are fewer than three noisy pixels in the level2.evt file, extra rows are filled as -1
| Pixel properties | Quadrant properties | ||||||
|---|---|---|---|---|---|---|---|
| Quadrant | DetID | PixID | Counts | Sigma | Mean | Median | Sigma |
| A | 14 | 238 | 157760 | 878.37 | 895 | 882 | 178.6 |
| A | 11 | 29 | 22159 | 119.13 | 895 | 882 | 178.6 |
| A | 10 | 253 | 14555 | 76.56 | 895 | 882 | 178.6 |
| B | 4 | 80 | 49093 | 285.34 | 882 | 864 | 169.0 |
| B | 7 | 220 | 40479 | 234.38 | 882 | 864 | 169.0 |
| B | 0 | 183 | 28336 | 162.54 | 882 | 864 | 169.0 |
| C | 3 | 233 | 240756 | 1225.74 | 846 | 855 | 195.7 |
| C | 14 | 238 | 135039 | 685.59 | 846 | 855 | 195.7 |
| C | 13 | 61 | 5707 | 24.79 | 846 | 855 | 195.7 |
| D | 1 | 52 | 1168293 | 5737.21 | 842 | 820 | 203.5 |
| D | 12 | 238 | 159145 | 778.04 | 842 | 820 | 203.5 |
| D | 11 | 176 | 77580 | 377.22 | 842 | 820 | 203.5 |
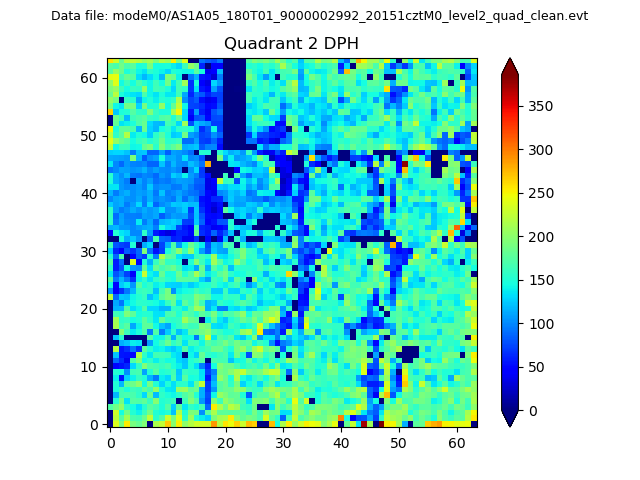
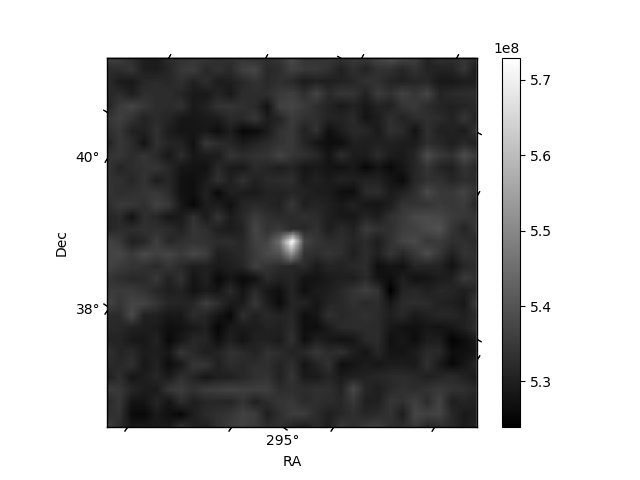
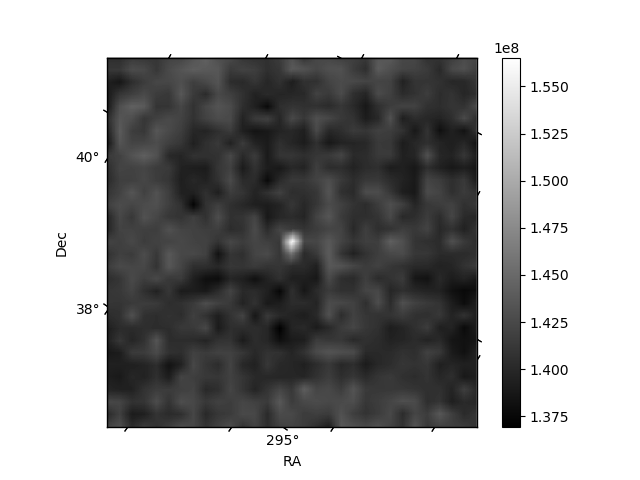
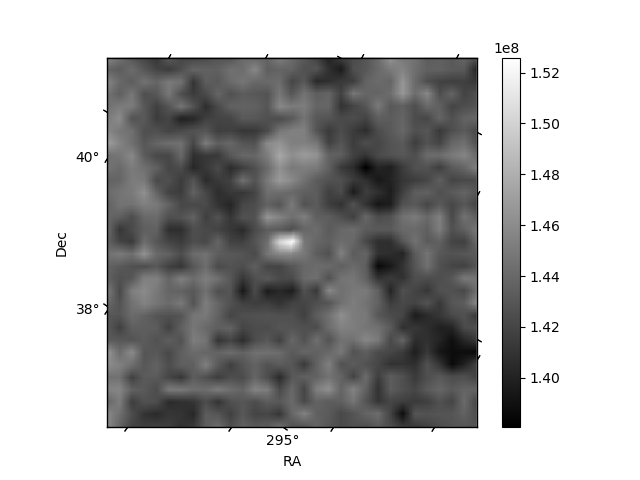
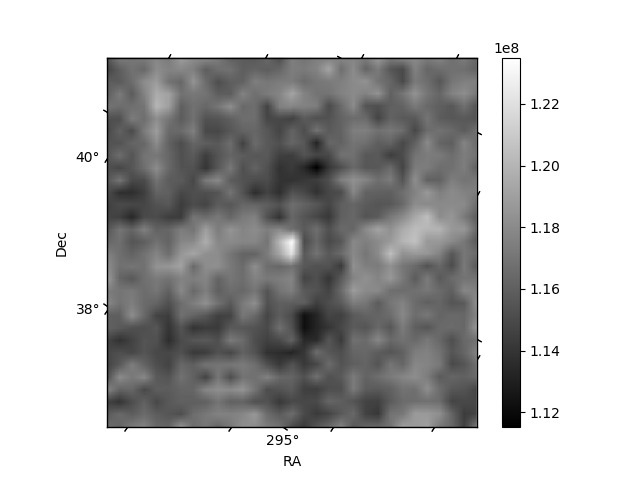
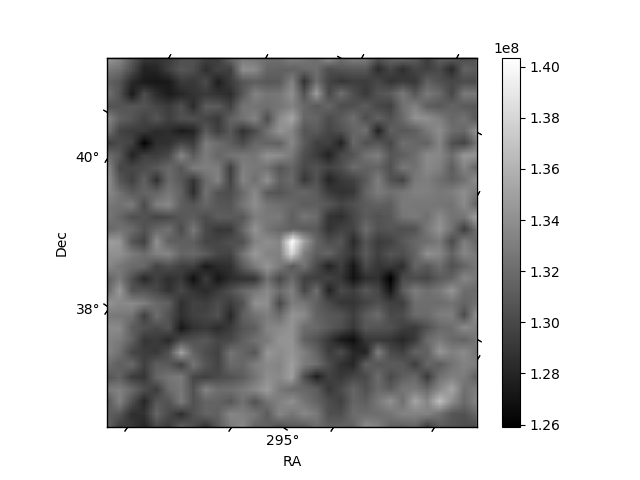
Histogram calculated using DETX and DETY for each event in the final _common_clean file
| Quadrant A | 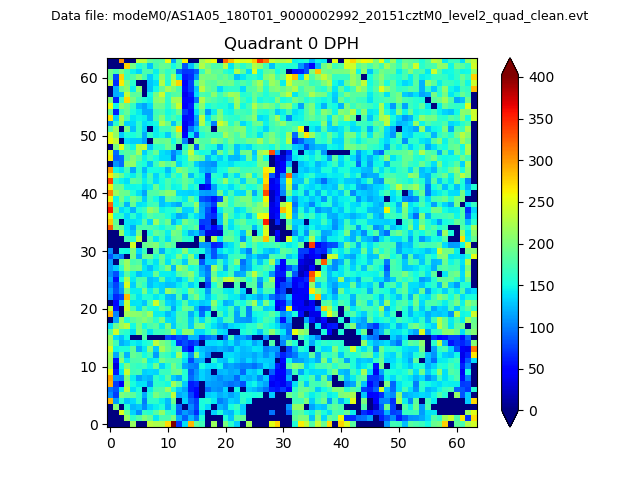 |
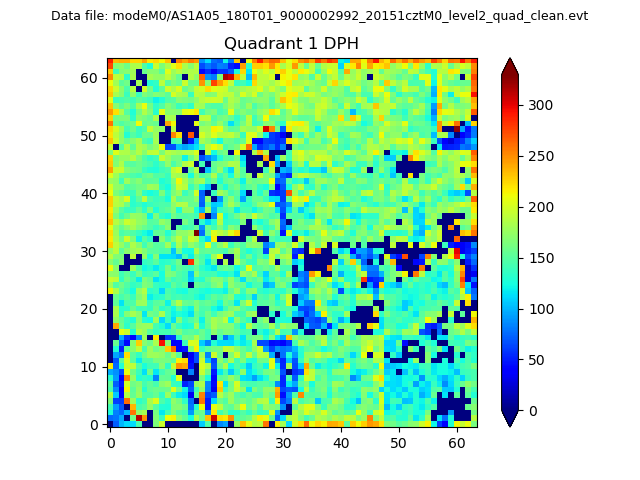 |
Quadrant B |
|---|---|---|---|
| Quadrant D | 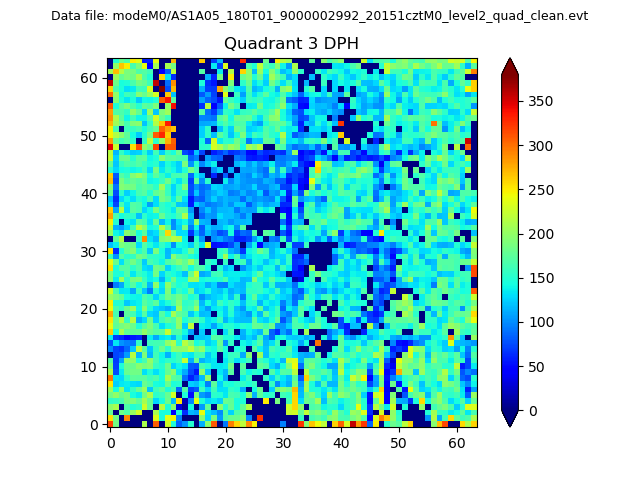 |
 |
Quadrant C |
| Plot type | Count rate plots | Images |
|---|---|---|
| Comparison with Poisson distribution Blue bars denote a histogram of data divided into 1 sec bins. Red curve is a Poisson curve with rate = median count rate of data. |
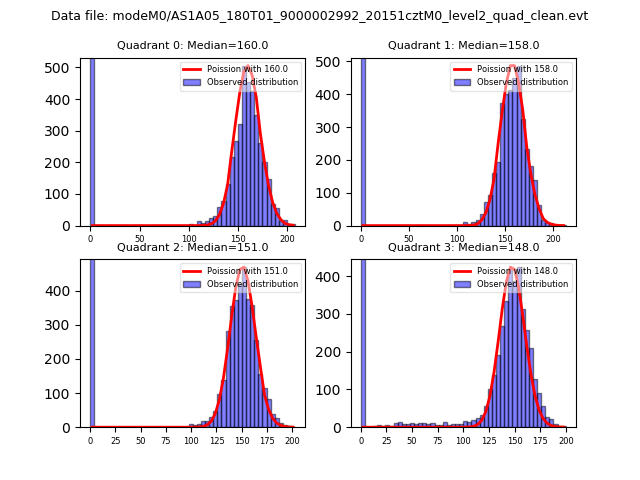 |
 |
| Quadrant-wise count rates Data is divided into 100 sec bins |
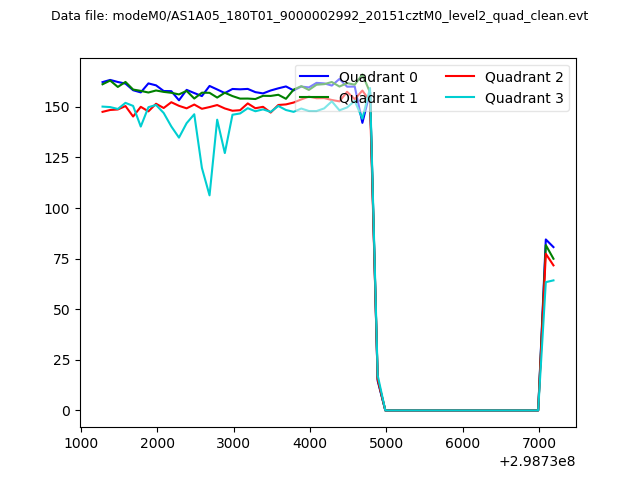 |
|
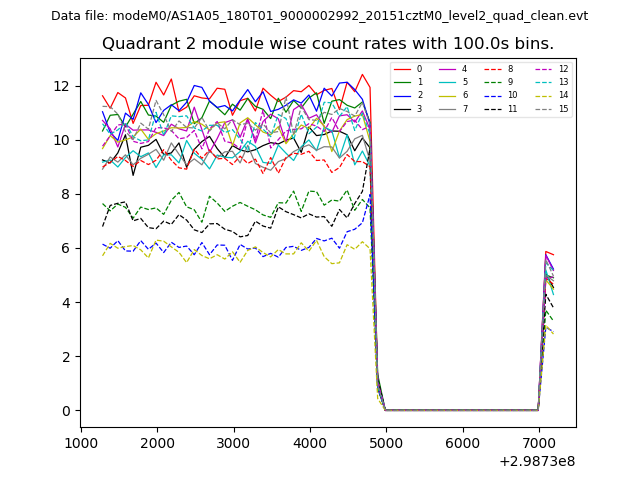
| Module-wise count rates for Quadrant A Data is divided into 100 sec bins |
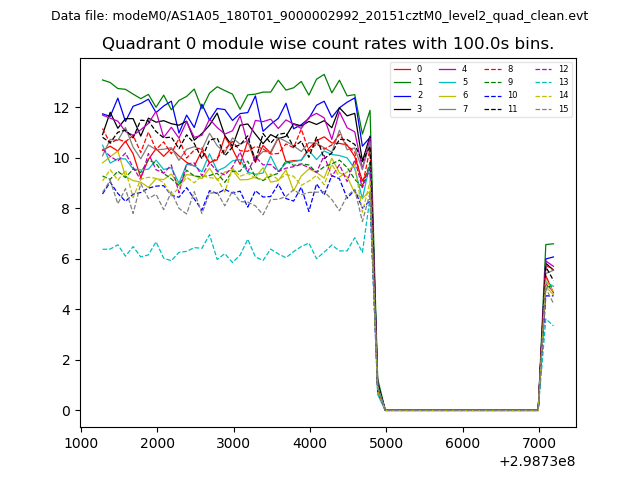 |
 |
| Module-wise count rates for Quadrant B Data is divided into 100 sec bins |
 |
 |
| Module-wise count rates for Quadrant C Data is divided into 100 sec bins |
 |
 |
| Module-wise count rates for Quadrant D Data is divided into 100 sec bins |
 |
 |
| Parameter | Plot |
|---|---|
| CZT HV Monitor |  |
| D_VDD | 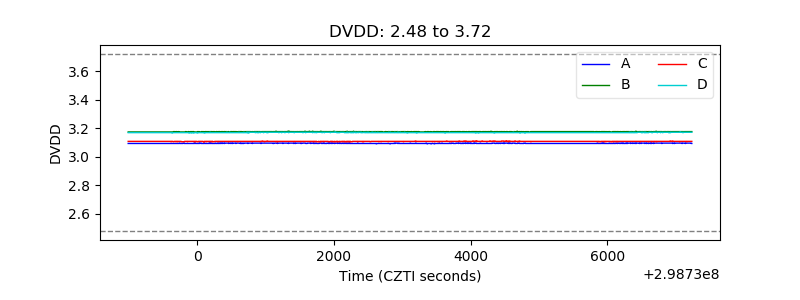 |
| Temperature 1 | 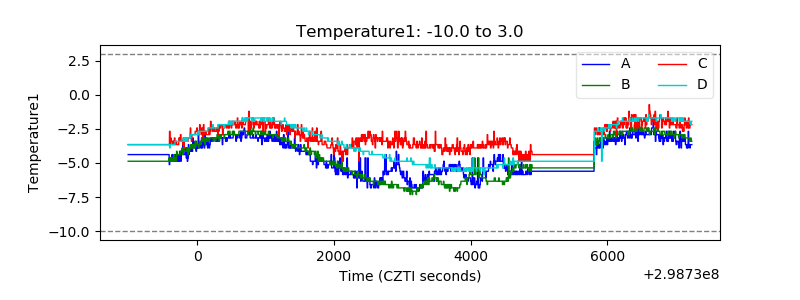 |
| Veto HV Monitor | 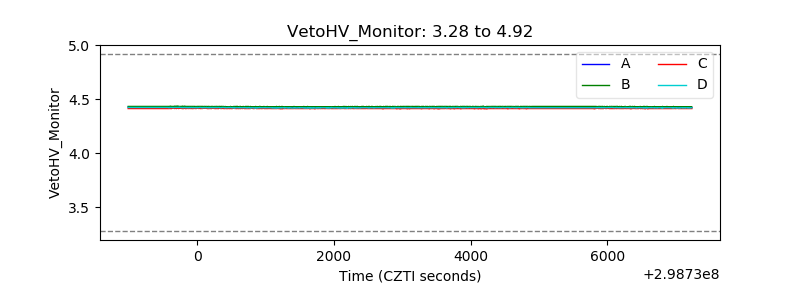 |
| Veto LLD |  |
| Alpha Counter | 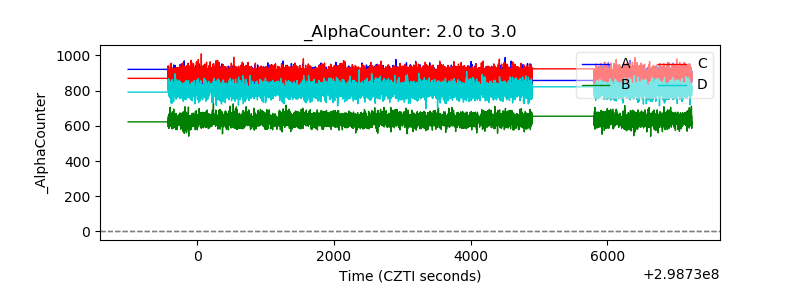 |
| _CPM_Rate | 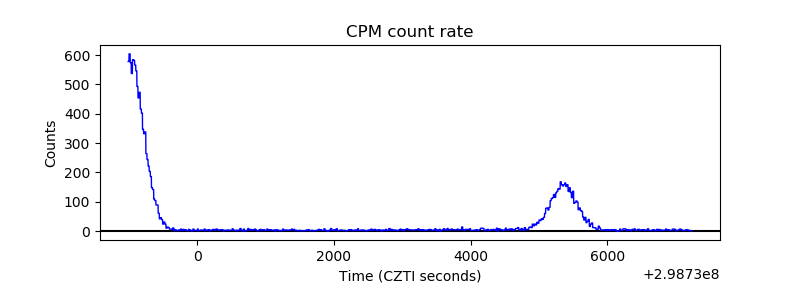 |
| CZT Counter | 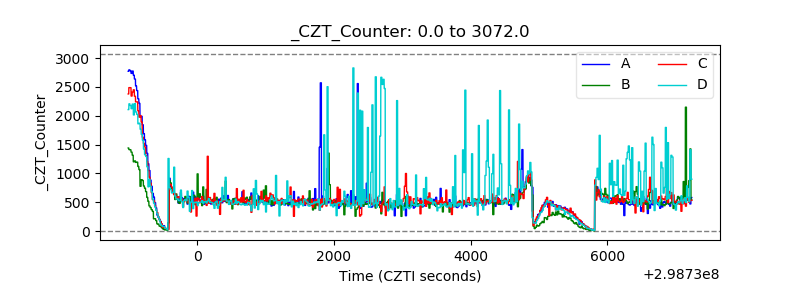 |
| +2.5 Volts monitor |  |
| +5 Volts monitor |  |
| _ROLL_ROT |  |
| _Roll_DEC | 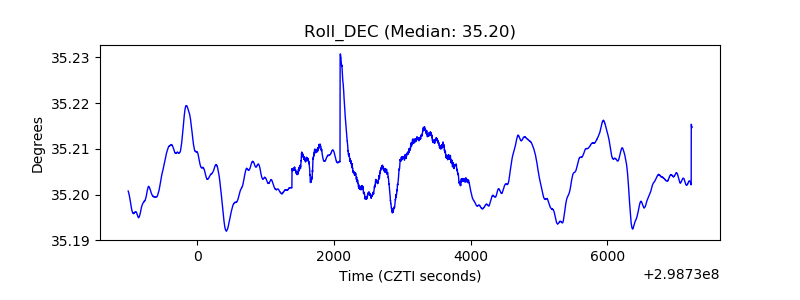 |
| _Roll_RA | 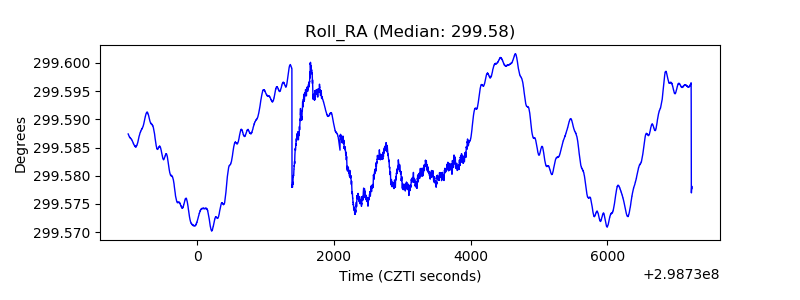 |
| Veto Counter |  |