| Param | Original file | Final file |
|---|---|---|
| Filename | modeM0/AS1A05_180T01_9000002992_20152cztM0_level2.evt | modeM0/AS1A05_180T01_9000002992_20152cztM0_level2_quad_clean.evt |
| Size (bytes) | 611,386,560 | 97,430,400 |
| Size | 583.1 MB | 92.9 MB |
| Events in quadrant A | 3,799,330 | 650,245 |
| Events in quadrant B | 3,890,596 | 642,820 |
| Events in quadrant C | 3,797,416 | 615,676 |
| Events in quadrant D | 6,537,209 | 537,540 |
| Mode M9 | |||
|---|---|---|---|
| Quadrant | BADHDUFLAG | Total packets | Discarded packets |
| A | 0 | 14 | 0 |
| B | 0 | 14 | 0 |
| C | 0 | 14 | 0 |
| D | 0 | 14 | 0 |
| Mode M0 | |||
|---|---|---|---|
| Quadrant | BADHDUFLAG | Total packets | Discarded packets |
| A | 0 | 15646 | 2 |
| B | 0 | 15990 | 2 |
| C | 0 | 15454 | 2 |
| D | 0 | 24191 | 2 |
| Mode SS | |||
|---|---|---|---|
| Quadrant | BADHDUFLAG | Total packets | Discarded packets |
| A | 0 | 150 | 0 |
| B | 0 | 150 | 0 |
| C | 0 | 150 | 0 |
| D | 0 | 150 | 0 |
| Quadrant | Total seconds | Saturated seconds | Saturation percentage |
|---|---|---|---|
| A | 7231 | 253 | 3.498825% |
| B | 7232 | 276 | 3.816372% |
| C | 7232 | 262 | 3.622788% |
| D | 7232 | 1790 | 24.751106% |
Noise dominated data is calculated using 1-second bins in cleaned event files. If a bin has >2000 counts, and if more than 50% of those come from <1% of pixels, then it is considered to be noise-dominated and hence unusable.
| Quadrant | # 1 sec bins | Bins with >0 counts | Bins with >2000 counts | High rate bins dominated by noise | Noise dominated (total time) | Noise dominated (detector-on time) | Marked lightcurve |
|---|---|---|---|---|---|---|---|
| A | 8636 | 7233 | 28 | 28 | 0.32% | 0.39% | 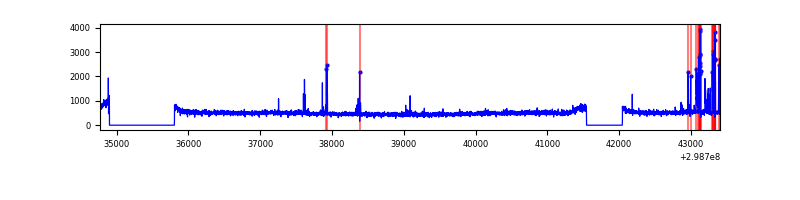 |
| B | 8637 | 7234 | 38 | 38 | 0.44% | 0.53% | 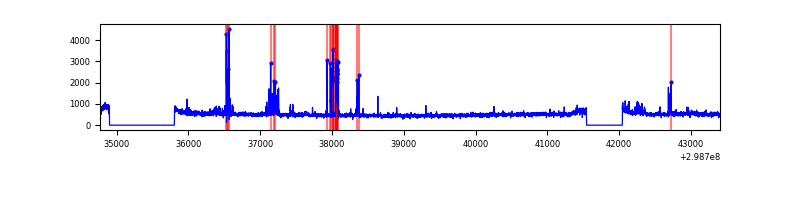 |
| C | 8637 | 7234 | 0 | 0 | 0.00% | 0.00% | 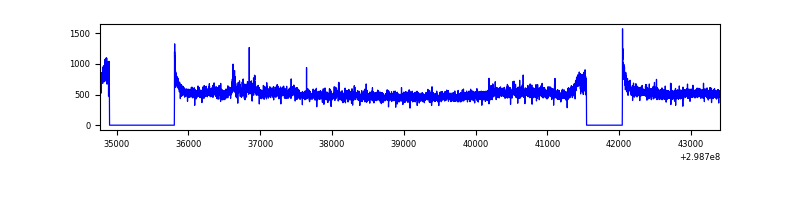 |
| D | 8637 | 7234 | 385 | 385 | 4.46% | 5.32% |  |
Top three noisy pixels from each quadrant. If the there are fewer than three noisy pixels in the level2.evt file, extra rows are filled as -1
| Pixel properties | Quadrant properties | ||||||
|---|---|---|---|---|---|---|---|
| Quadrant | DetID | PixID | Counts | Sigma | Mean | Median | Sigma |
| A | 14 | 238 | 196592 | 1039.32 | 936 | 920 | 188.3 |
| A | 0 | 226 | 7859 | 36.86 | 936 | 920 | 188.3 |
| A | 3 | 137 | 7659 | 35.79 | 936 | 920 | 188.3 |
| B | 4 | 80 | 142532 | 797.49 | 923 | 901 | 177.6 |
| B | 7 | 220 | 53327 | 295.2 | 923 | 901 | 177.6 |
| B | 0 | 183 | 35901 | 197.08 | 923 | 901 | 177.6 |
| C | 3 | 233 | 199170 | 960.23 | 886 | 893 | 206.5 |
| C | 14 | 238 | 141679 | 681.81 | 886 | 893 | 206.5 |
| C | 13 | 61 | 5997 | 24.72 | 886 | 893 | 206.5 |
| D | 1 | 52 | 3273508 | 16586.49 | 813 | 789 | 197.3 |
| D | 7 | 96 | 50862 | 253.78 | 813 | 789 | 197.3 |
| D | 7 | 238 | 33404 | 165.3 | 813 | 789 | 197.3 |
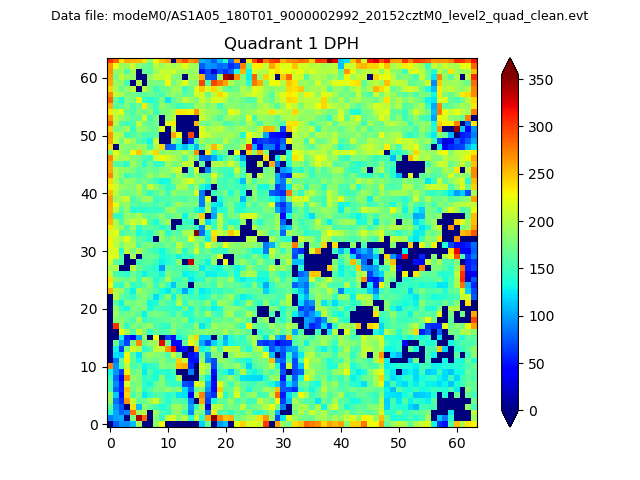
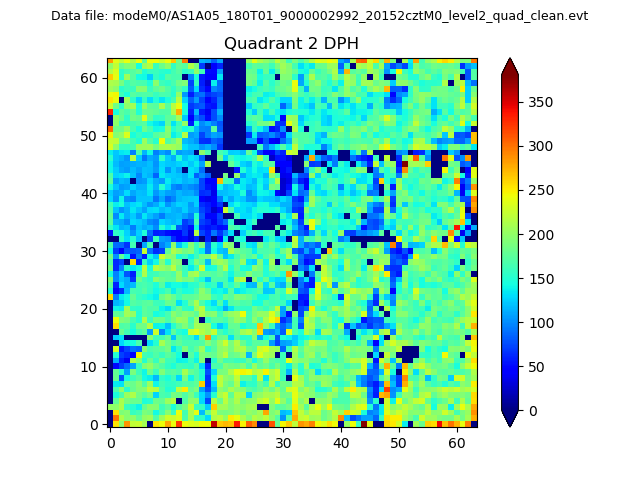
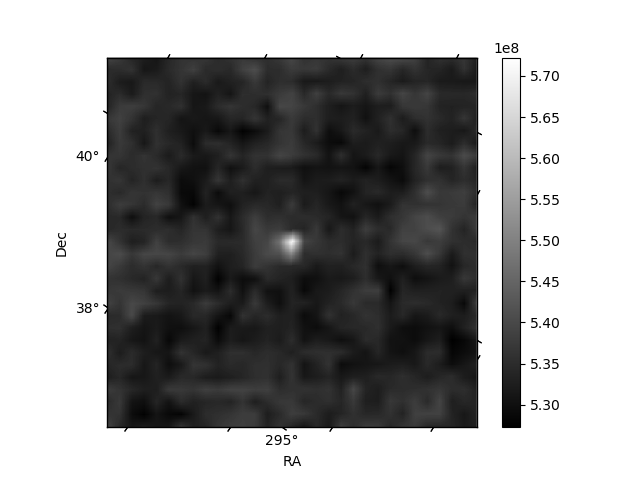
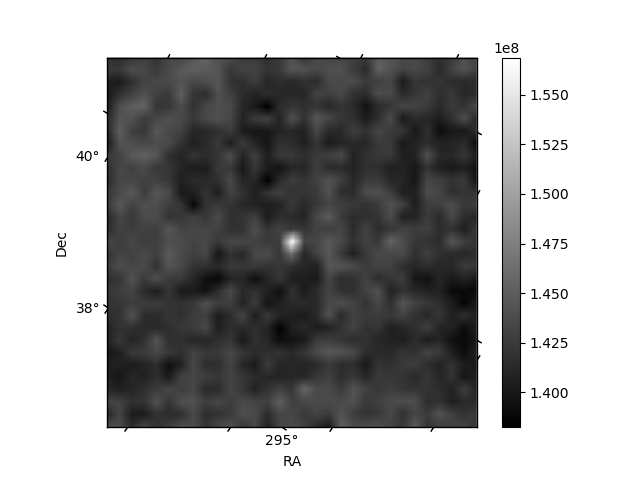
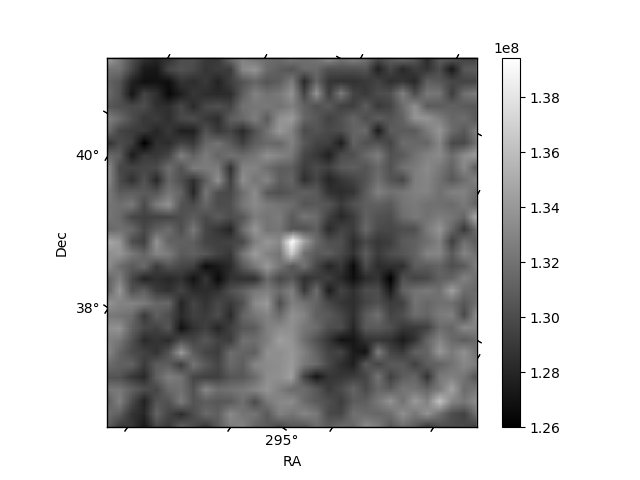
Histogram calculated using DETX and DETY for each event in the final _common_clean file
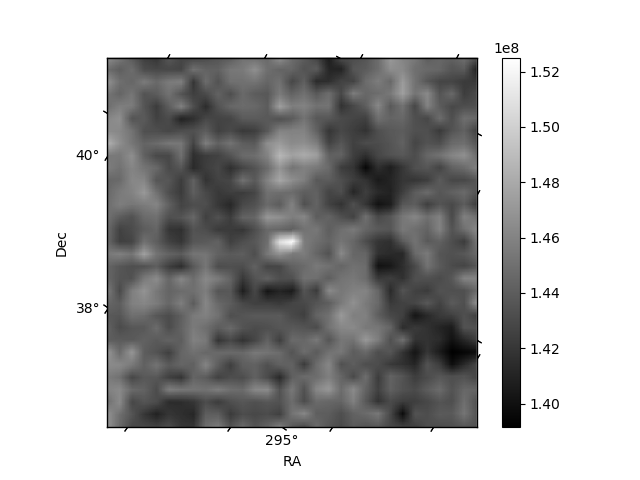
| Quadrant A | 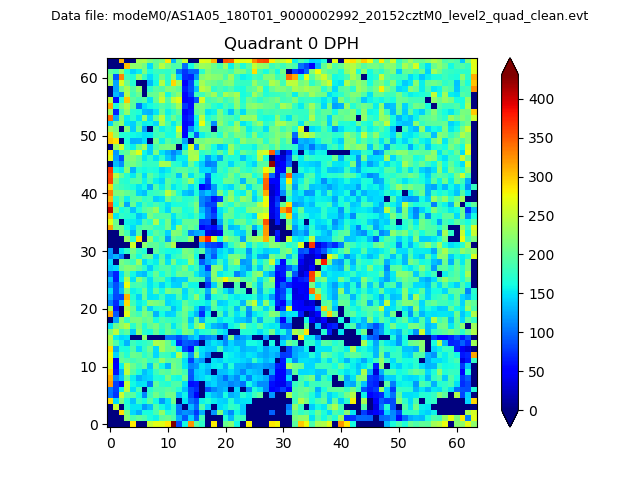 |
 |
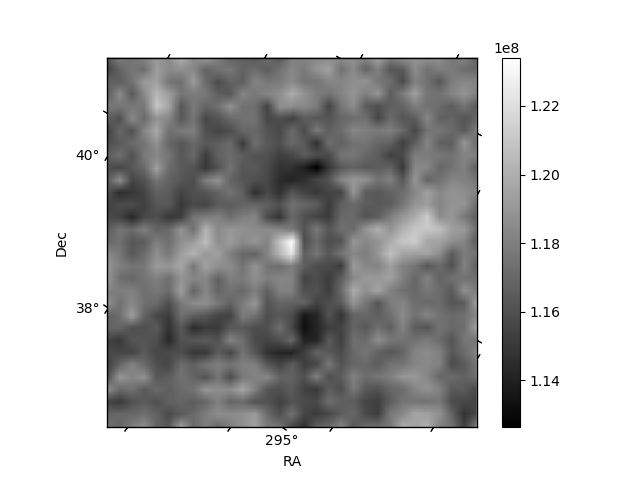
Quadrant B |
|---|---|---|---|
| Quadrant D | 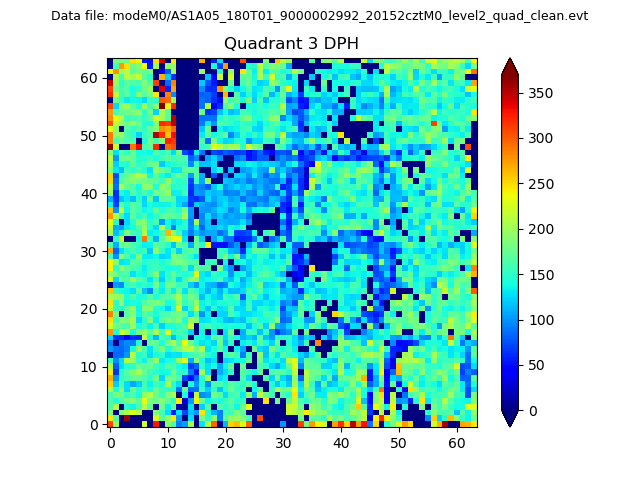 |
 |
Quadrant C |
| Plot type | Count rate plots | Images |
|---|---|---|
| Comparison with Poisson distribution Blue bars denote a histogram of data divided into 1 sec bins. Red curve is a Poisson curve with rate = median count rate of data. |
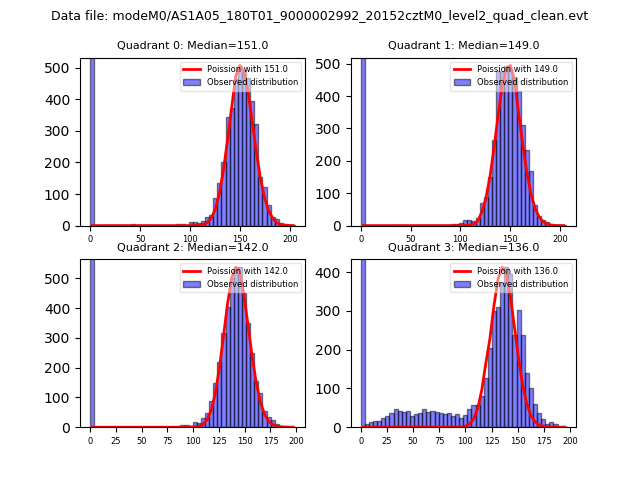 |
 |
| Quadrant-wise count rates Data is divided into 100 sec bins |
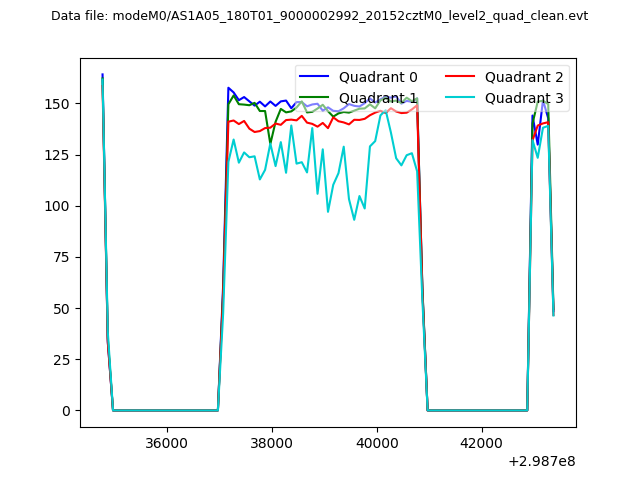 |
|
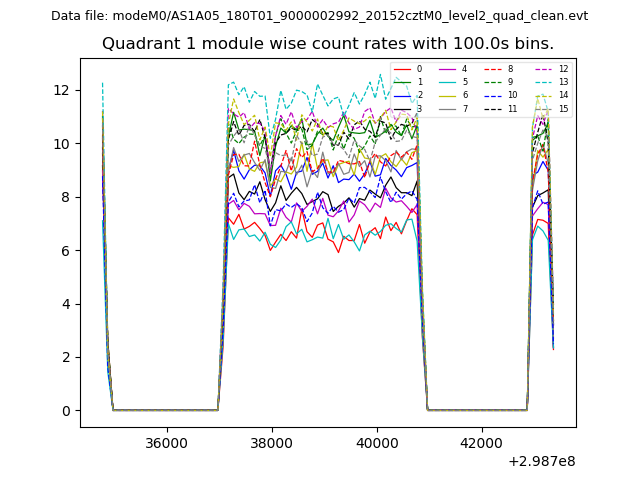
| Module-wise count rates for Quadrant A Data is divided into 100 sec bins |
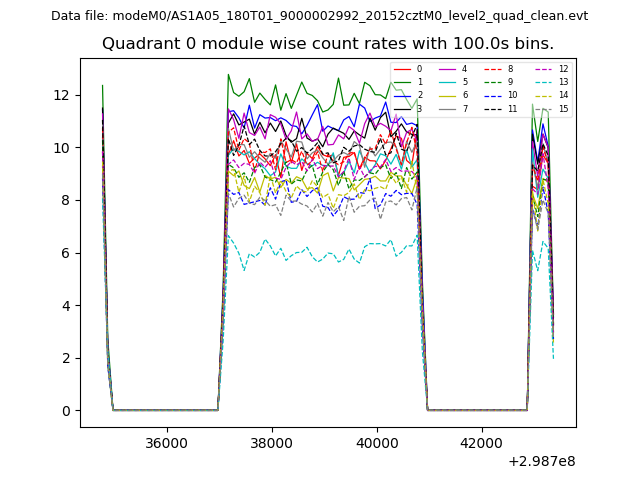 |
 |
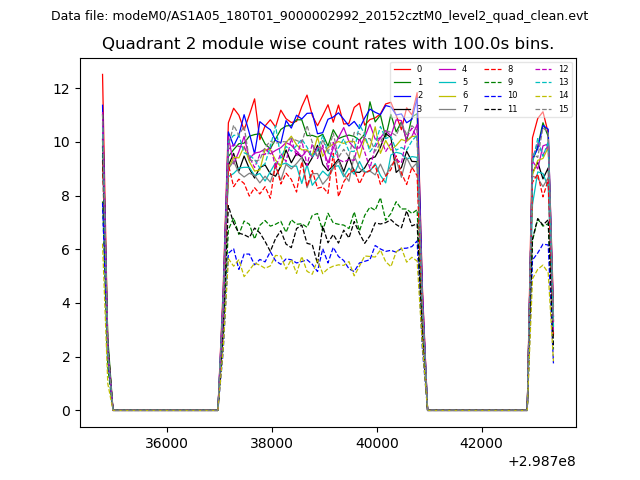
| Module-wise count rates for Quadrant B Data is divided into 100 sec bins |
 |
 |
| Module-wise count rates for Quadrant C Data is divided into 100 sec bins |
 |
 |
| Module-wise count rates for Quadrant D Data is divided into 100 sec bins |
 |
 |
| Parameter | Plot |
|---|---|
| CZT HV Monitor | 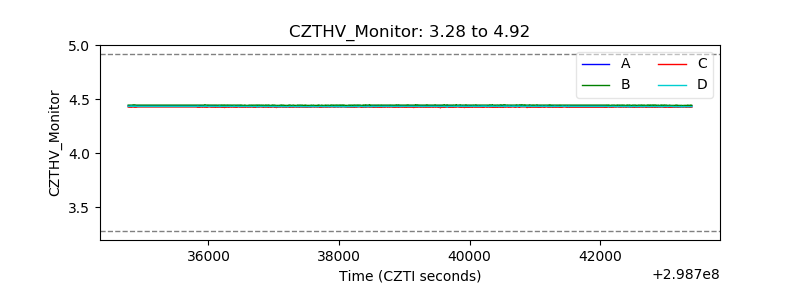 |
| D_VDD |  |
| Temperature 1 | 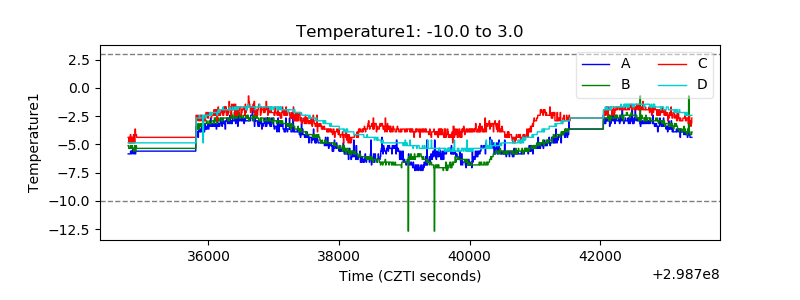 |
| Veto HV Monitor | 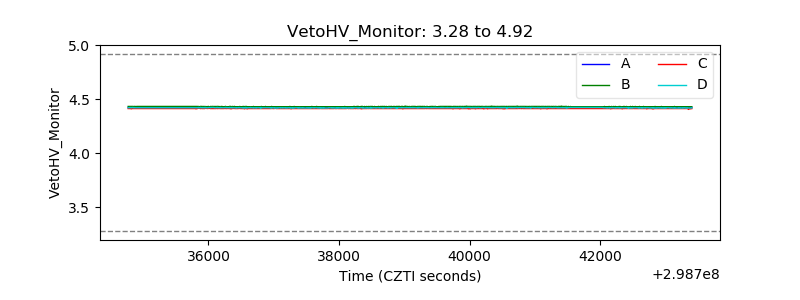 |
| Veto LLD | 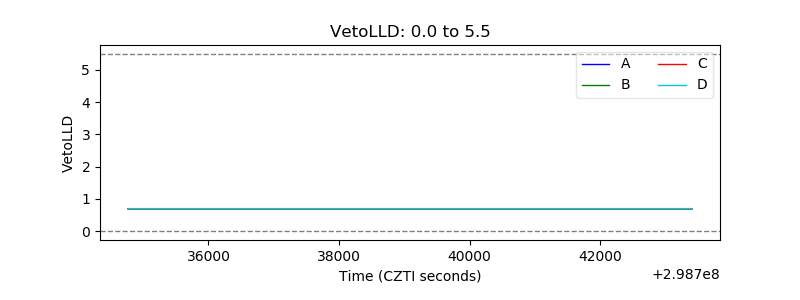 |
| Alpha Counter | 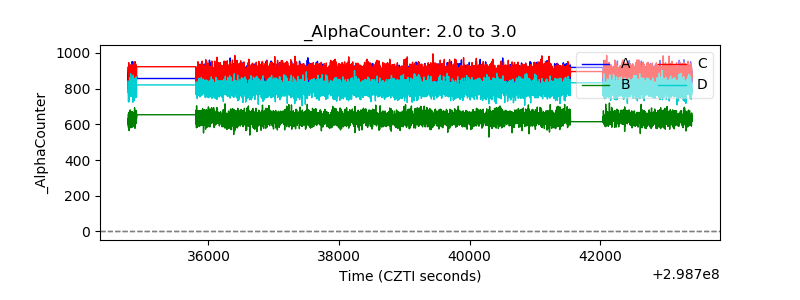 |
| _CPM_Rate | 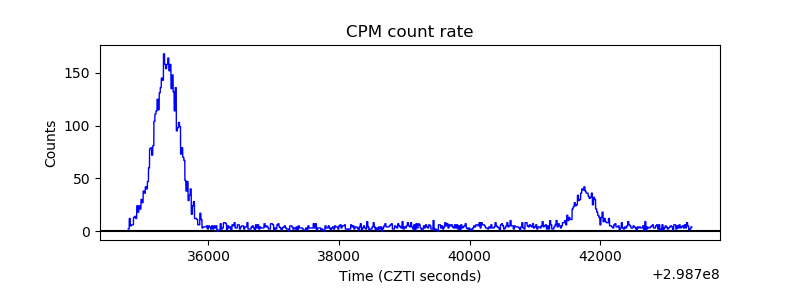 |
| CZT Counter | 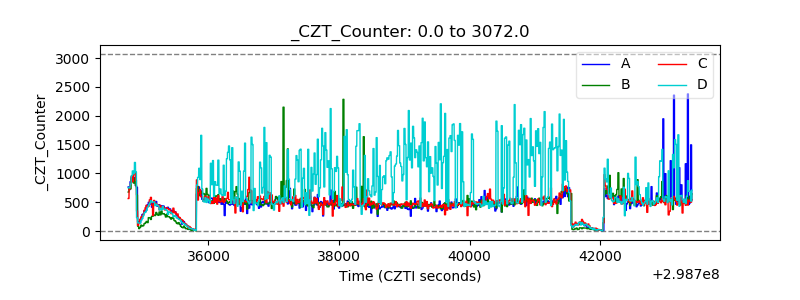 |
| +2.5 Volts monitor |  |
| +5 Volts monitor |  |
| _ROLL_ROT | 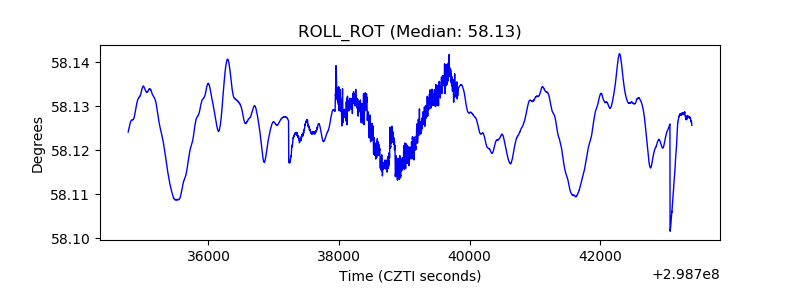 |
| _Roll_DEC | 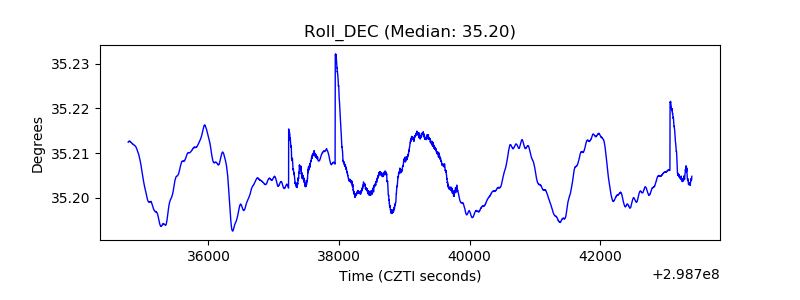 |
| _Roll_RA | 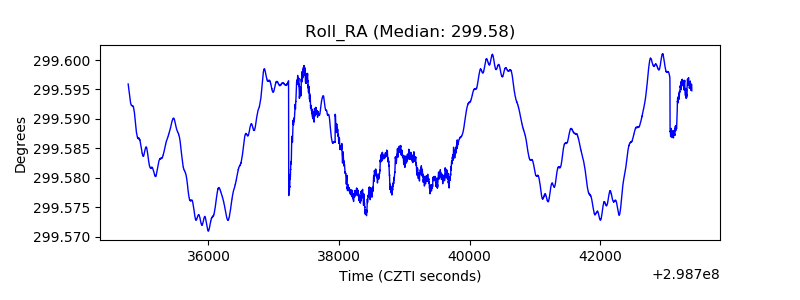 |
| Veto Counter | 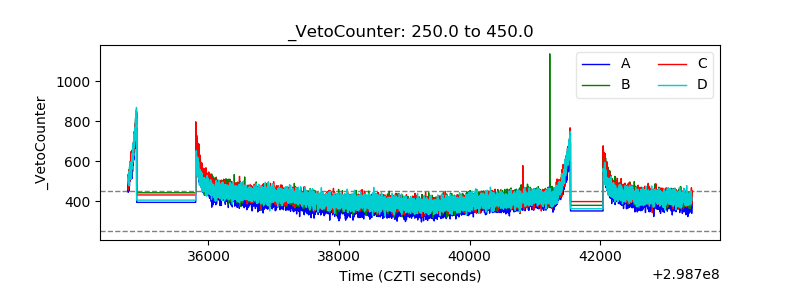 |