| Param | Original file | Final file |
|---|---|---|
| Filename | modeM0/AS1A05_180T01_9000002992_20161cztM0_level2.evt | modeM0/AS1A05_180T01_9000002992_20161cztM0_level2_quad_clean.evt |
| Size (bytes) | 3,306,124,800 | 644,794,560 |
| Size | 3.1 GB | 614.9 MB |
| Events in quadrant A | 21,504,703 | 4,274,735 |
| Events in quadrant B | 22,199,506 | 4,251,033 |
| Events in quadrant C | 23,695,633 | 4,064,407 |
| Events in quadrant D | 29,746,190 | 3,907,182 |
| Mode M9 | |||
|---|---|---|---|
| Quadrant | BADHDUFLAG | Total packets | Discarded packets |
| A | 0 | 63 | 0 |
| B | 0 | 63 | 0 |
| C | 0 | 63 | 0 |
| D | 0 | 63 | 0 |
| Mode M0 | |||
|---|---|---|---|
| Quadrant | BADHDUFLAG | Total packets | Discarded packets |
| A | 0 | 91984 | 8 |
| B | 0 | 93787 | 8 |
| C | 0 | 98319 | 10 |
| D | 0 | 118288 | 8 |
| Mode SS | |||
|---|---|---|---|
| Quadrant | BADHDUFLAG | Total packets | Discarded packets |
| A | 0 | 898 | 0 |
| B | 0 | 898 | 0 |
| C | 0 | 898 | 0 |
| D | 0 | 898 | 0 |
| Quadrant | Total seconds | Saturated seconds | Saturation percentage |
|---|---|---|---|
| A | 44199 | 255 | 0.576936% |
| B | 44200 | 413 | 0.934389% |
| C | 44199 | 519 | 1.174235% |
| D | 44199 | 3084 | 6.977533% |
Noise dominated data is calculated using 1-second bins in cleaned event files. If a bin has >2000 counts, and if more than 50% of those come from <1% of pixels, then it is considered to be noise-dominated and hence unusable.
| Quadrant | # 1 sec bins | Bins with >0 counts | Bins with >2000 counts | High rate bins dominated by noise | Noise dominated (total time) | Noise dominated (detector-on time) | Marked lightcurve |
|---|---|---|---|---|---|---|---|
| A | 50404 | 44207 | 61 | 61 | 0.12% | 0.14% | 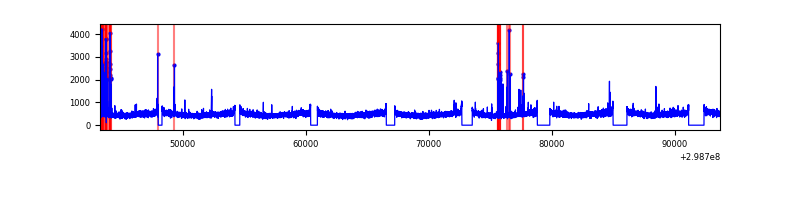 |
| B | 50405 | 44208 | 91 | 91 | 0.18% | 0.21% | 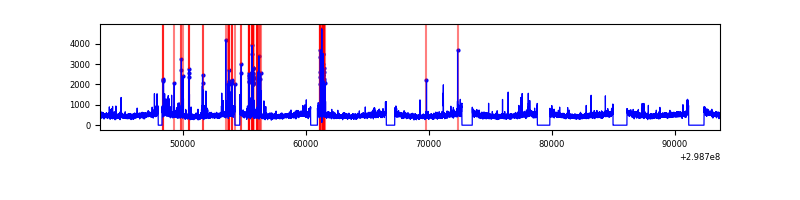 |
| C | 50404 | 44207 | 3 | 3 | 0.01% | 0.01% |  |
| D | 50404 | 44207 | 1176 | 1176 | 2.33% | 2.66% | 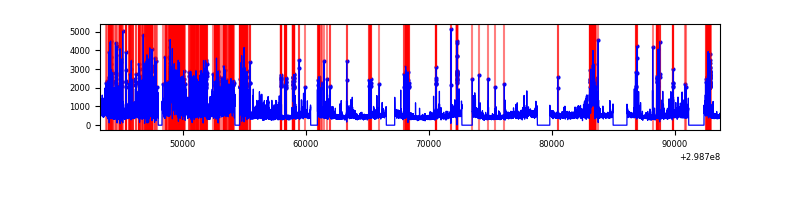 |
Top three noisy pixels from each quadrant. If the there are fewer than three noisy pixels in the level2.evt file, extra rows are filled as -1
| Pixel properties | Quadrant properties | ||||||
|---|---|---|---|---|---|---|---|
| Quadrant | DetID | PixID | Counts | Sigma | Mean | Median | Sigma |
| A | 14 | 238 | 335159 | 300.17 | 5495 | 5404 | 1098.6 |
| A | 9 | 143 | 55638 | 45.73 | 5495 | 5404 | 1098.6 |
| A | 0 | 226 | 46520 | 37.43 | 5495 | 5404 | 1098.6 |
| B | 4 | 80 | 435749 | 416.17 | 5444 | 5315 | 1034.3 |
| B | 12 | 111 | 124469 | 115.21 | 5444 | 5315 | 1034.3 |
| B | 0 | 198 | 116795 | 107.79 | 5444 | 5315 | 1034.3 |
| C | 3 | 233 | 2490312 | 2064.96 | 5213 | 5267 | 1203.4 |
| C | 14 | 238 | 821400 | 678.17 | 5213 | 5267 | 1203.4 |
| C | 8 | 208 | 52066 | 38.89 | 5213 | 5267 | 1203.4 |
| D | 1 | 52 | 8199824 | 6575.3 | 5162 | 5030 | 1246.3 |
| D | 9 | 1 | 957387 | 764.15 | 5162 | 5030 | 1246.3 |
| D | 1 | 20 | 243414 | 191.27 | 5162 | 5030 | 1246.3 |
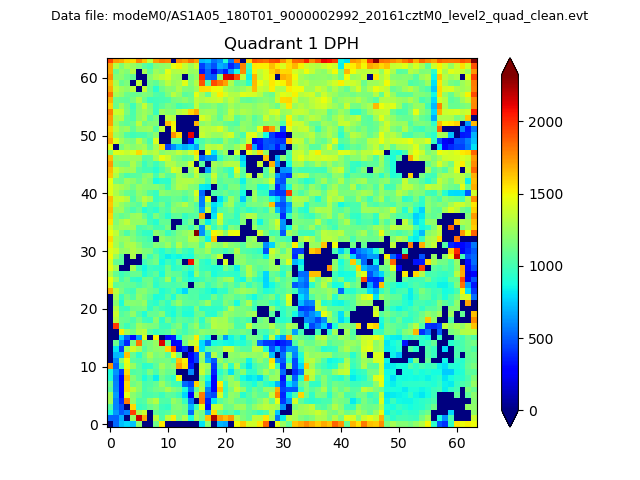
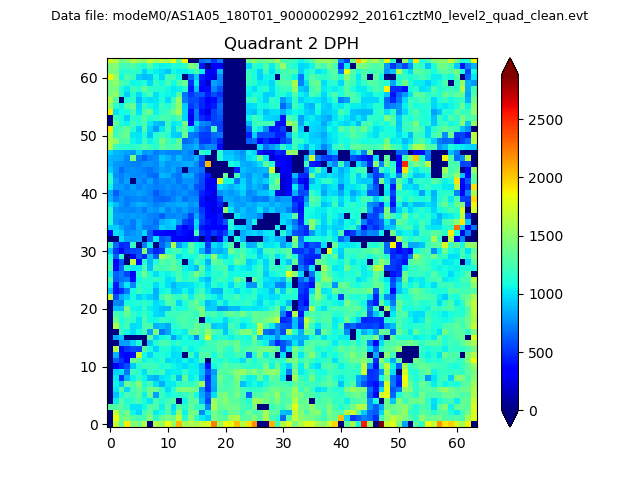
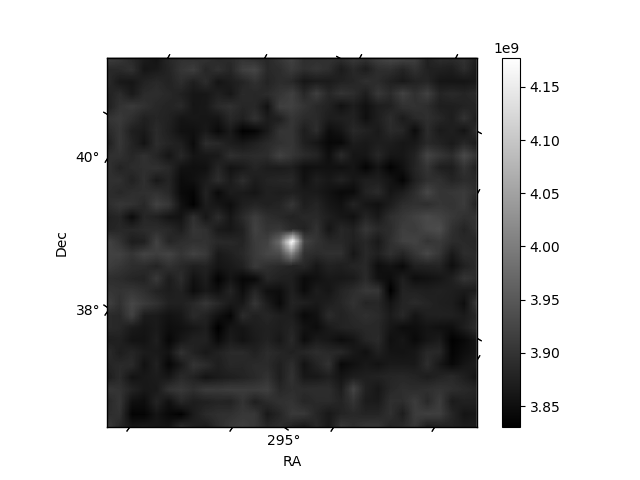
Histogram calculated using DETX and DETY for each event in the final _common_clean file
| Quadrant A | 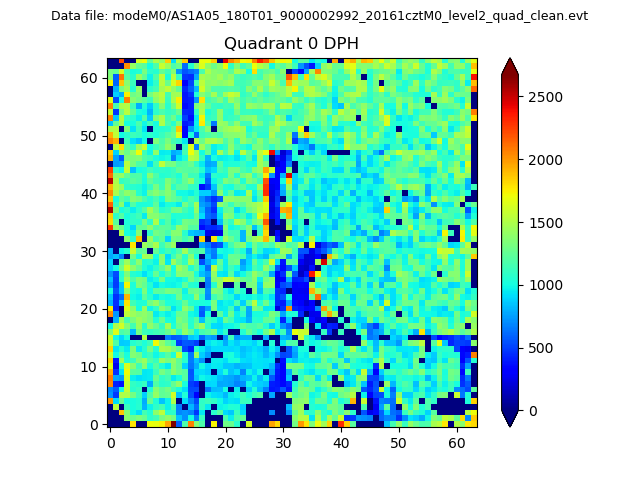 |
 |
Quadrant B |
|---|---|---|---|
| Quadrant D | 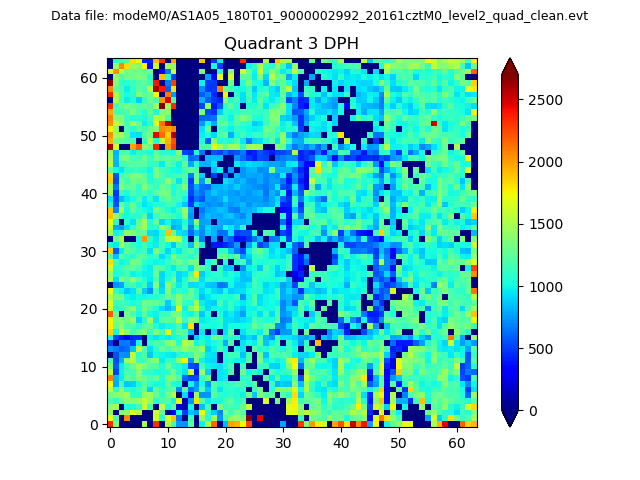 |
 |
Quadrant C |
| Plot type | Count rate plots | Images |
|---|---|---|
| Comparison with Poisson distribution Blue bars denote a histogram of data divided into 1 sec bins. Red curve is a Poisson curve with rate = median count rate of data. |
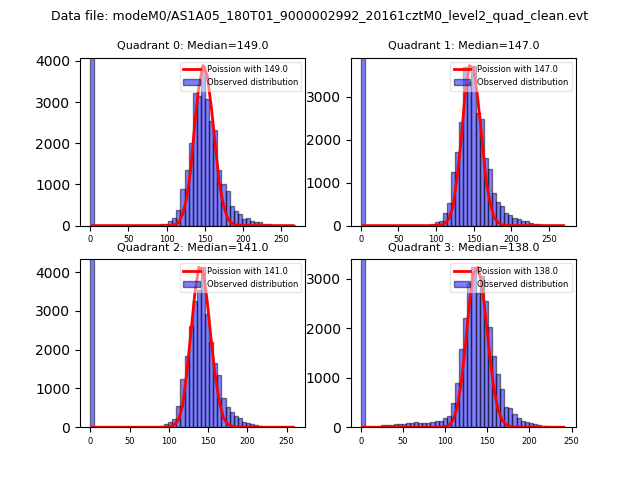 |
 |
| Quadrant-wise count rates Data is divided into 100 sec bins |
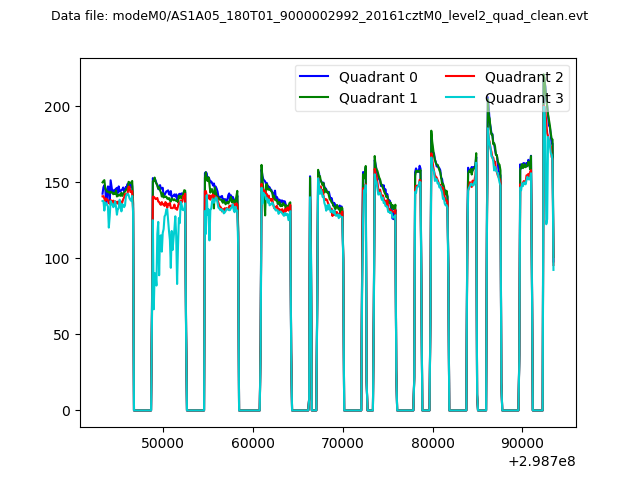 |
|
| Module-wise count rates for Quadrant A Data is divided into 100 sec bins |
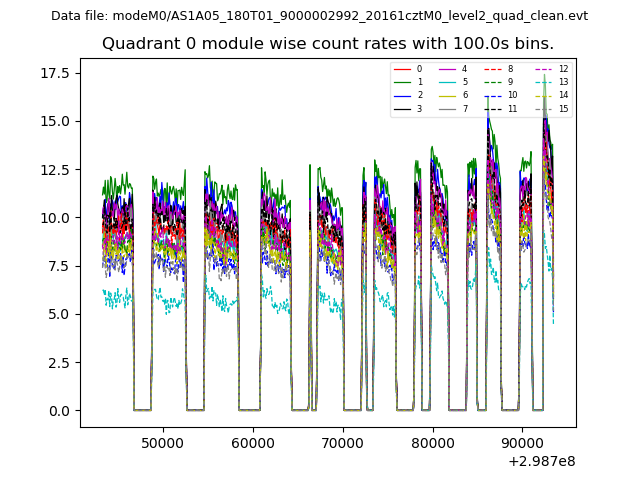 |
 |
| Module-wise count rates for Quadrant B Data is divided into 100 sec bins |
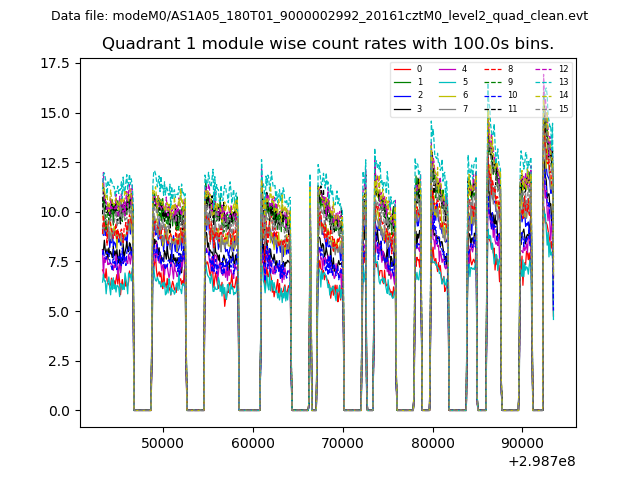 |
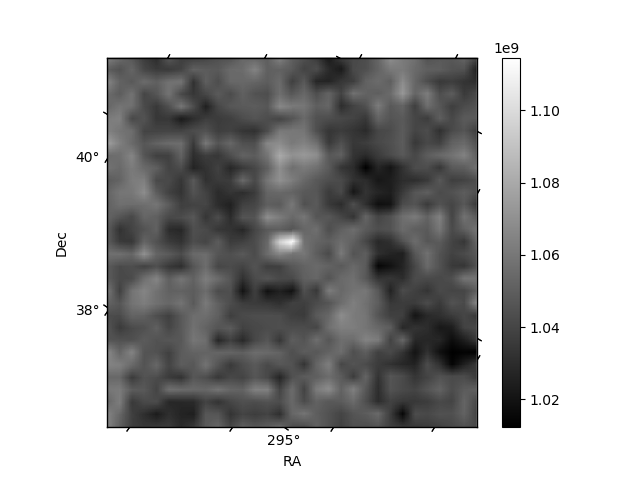 |
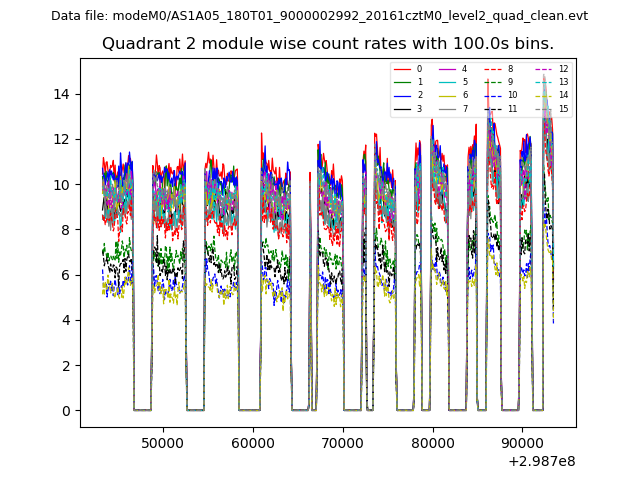
| Module-wise count rates for Quadrant C Data is divided into 100 sec bins |
 |
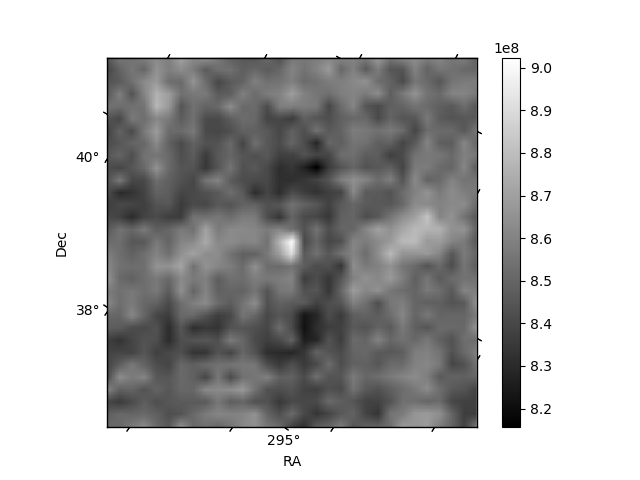 |
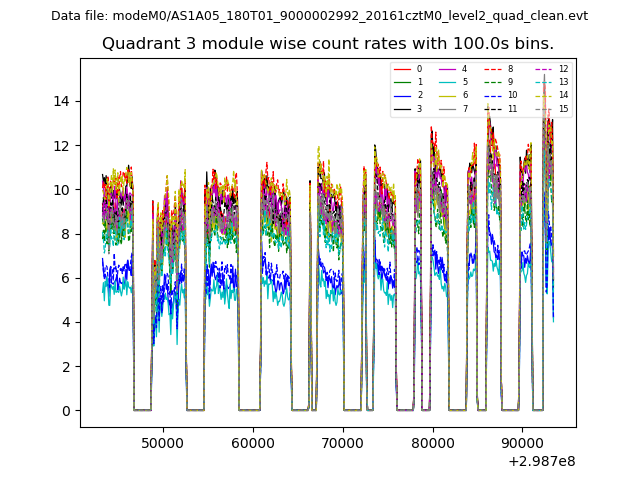
| Module-wise count rates for Quadrant D Data is divided into 100 sec bins |
 |
 |
| Parameter | Plot |
|---|---|
| CZT HV Monitor | 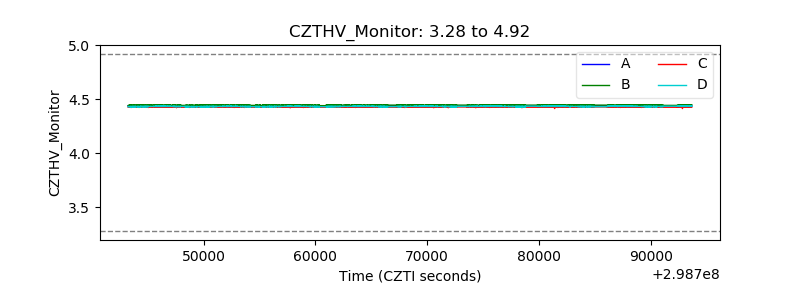 |
| D_VDD | 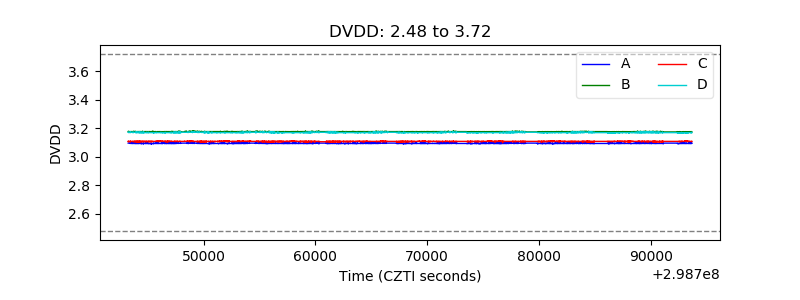 |
| Temperature 1 | 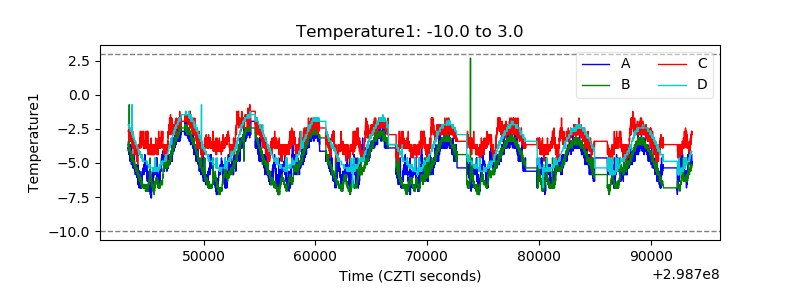 |
| Veto HV Monitor | 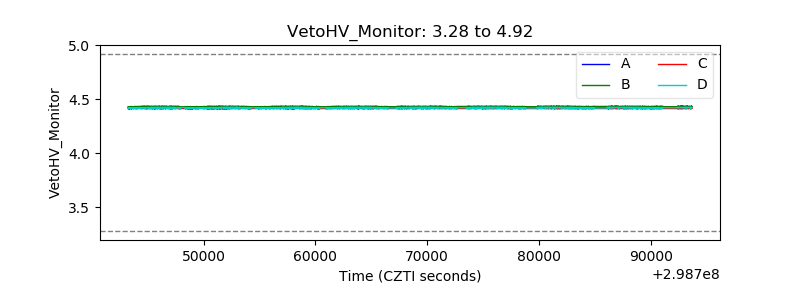 |
| Veto LLD | 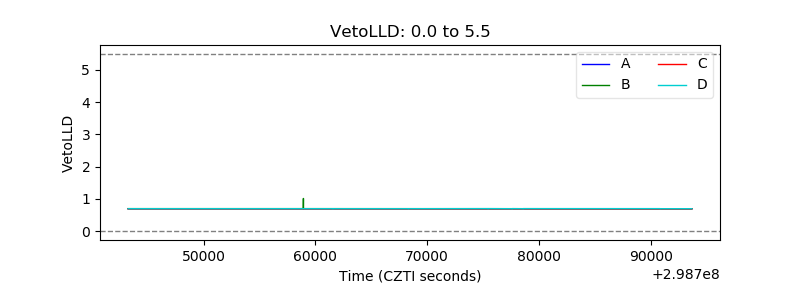 |
| Alpha Counter | 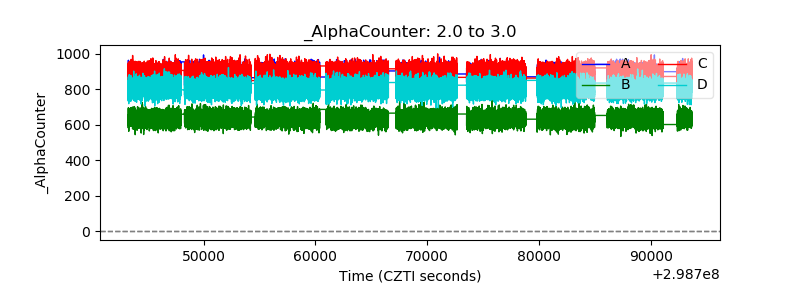 |
| _CPM_Rate | 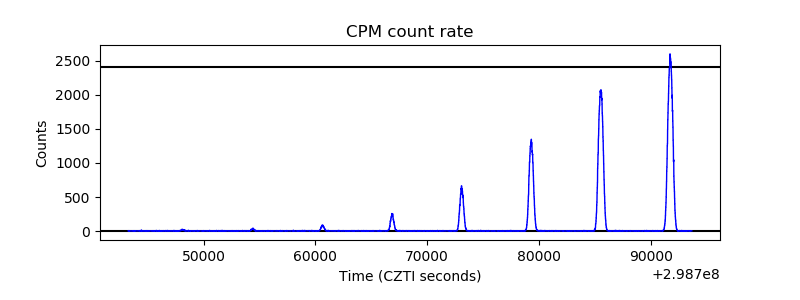 |
| CZT Counter | 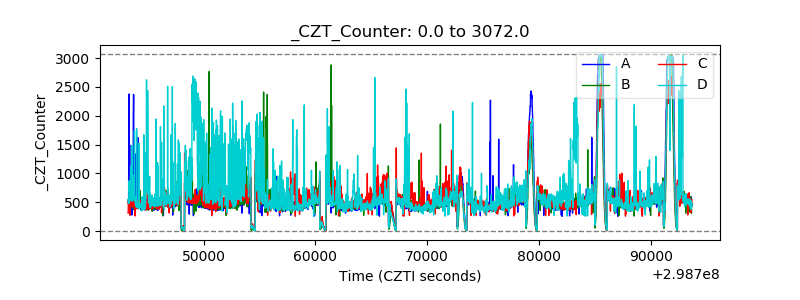 |
| +2.5 Volts monitor | 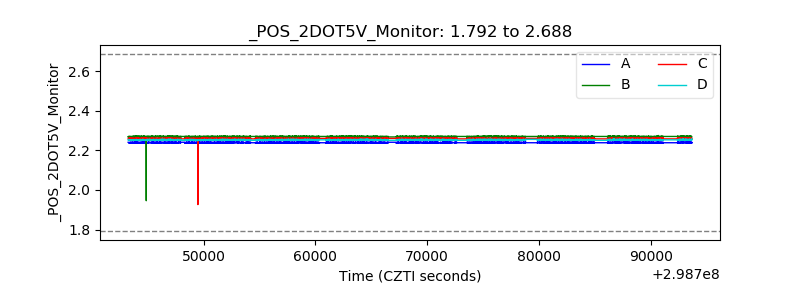 |
| +5 Volts monitor |  |
| _ROLL_ROT | 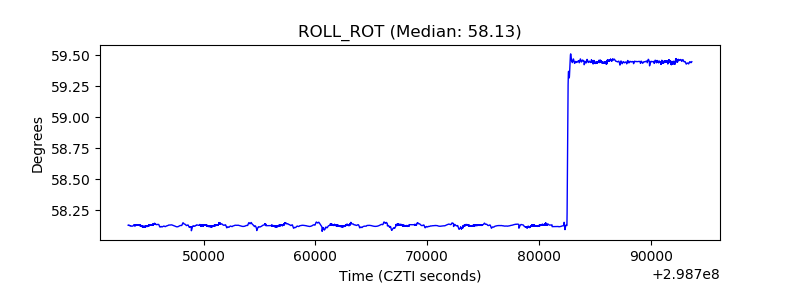 |
| _Roll_DEC | 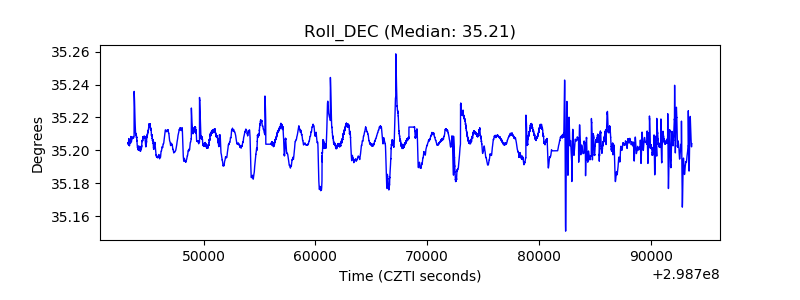 |
| _Roll_RA | 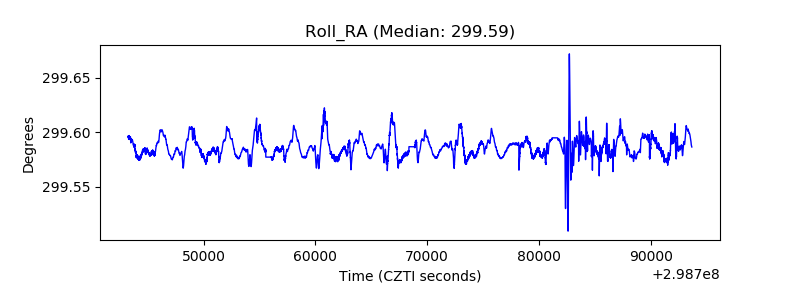 |
| Veto Counter | 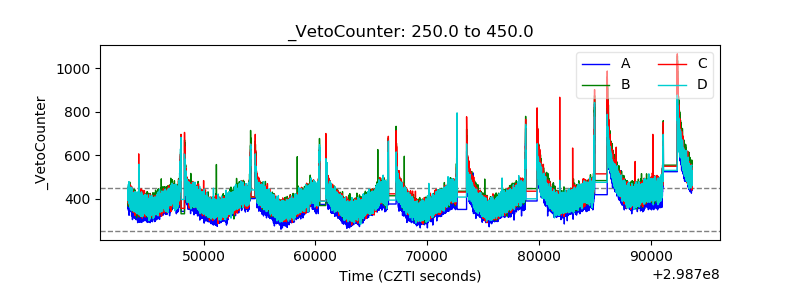 |