| Param | Original file | Final file |
|---|---|---|
| Filename | modeM0/AS1A05_180T01_9000002992_20162cztM0_level2.evt | modeM0/AS1A05_180T01_9000002992_20162cztM0_level2_quad_clean.evt |
| Size (bytes) | 473,042,880 | 87,125,760 |
| Size | 451.1 MB | 83.1 MB |
| Events in quadrant A | 3,227,982 | 574,612 |
| Events in quadrant B | 3,263,312 | 576,456 |
| Events in quadrant C | 3,323,812 | 540,203 |
| Events in quadrant D | 4,102,222 | 526,549 |
| Mode M9 | |||
|---|---|---|---|
| Quadrant | BADHDUFLAG | Total packets | Discarded packets |
| A | 0 | 13 | 0 |
| B | 0 | 13 | 0 |
| C | 0 | 13 | 0 |
| D | 0 | 13 | 0 |
| Mode M0 | |||
|---|---|---|---|
| Quadrant | BADHDUFLAG | Total packets | Discarded packets |
| A | 0 | 13024 | 2 |
| B | 0 | 13177 | 1 |
| C | 0 | 13468 | 1 |
| D | 0 | 15843 | 1 |
| Mode SS | |||
|---|---|---|---|
| Quadrant | BADHDUFLAG | Total packets | Discarded packets |
| A | 0 | 124 | 0 |
| B | 0 | 124 | 0 |
| C | 0 | 124 | 0 |
| D | 0 | 124 | 0 |
| Quadrant | Total seconds | Saturated seconds | Saturation percentage |
|---|---|---|---|
| A | 6016 | 58 | 0.964096% |
| B | 6017 | 70 | 1.163370% |
| C | 6017 | 82 | 1.362805% |
| D | 6017 | 332 | 5.517700% |
Noise dominated data is calculated using 1-second bins in cleaned event files. If a bin has >2000 counts, and if more than 50% of those come from <1% of pixels, then it is considered to be noise-dominated and hence unusable.
| Quadrant | # 1 sec bins | Bins with >0 counts | Bins with >2000 counts | High rate bins dominated by noise | Noise dominated (total time) | Noise dominated (detector-on time) | Marked lightcurve |
|---|---|---|---|---|---|---|---|
| A | 7321 | 6017 | 0 | 0 | 0.00% | 0.00% | 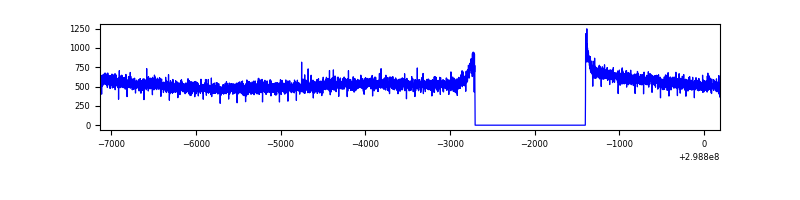 |
| B | 7322 | 6018 | 1 | 1 | 0.01% | 0.02% | 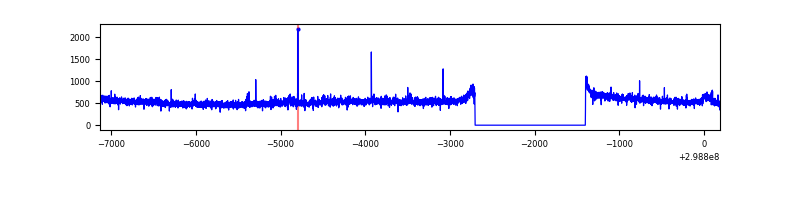 |
| C | 7322 | 6018 | 0 | 0 | 0.00% | 0.00% | 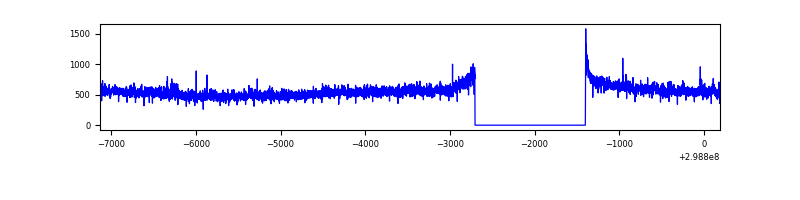 |
| D | 7322 | 6018 | 248 | 248 | 3.39% | 4.12% | 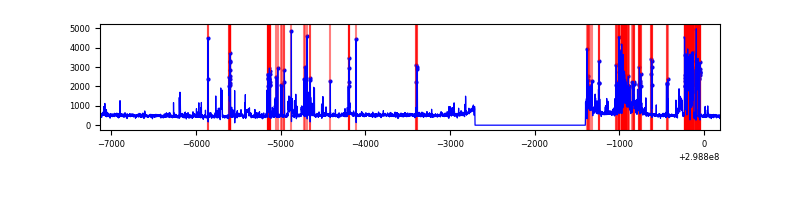 |
Top three noisy pixels from each quadrant. If the there are fewer than three noisy pixels in the level2.evt file, extra rows are filled as -1
| Pixel properties | Quadrant properties | ||||||
|---|---|---|---|---|---|---|---|
| Quadrant | DetID | PixID | Counts | Sigma | Mean | Median | Sigma |
| A | 0 | 226 | 7319 | 39.03 | 839 | 827 | 166.3 |
| A | 3 | 137 | 6275 | 32.75 | 839 | 827 | 166.3 |
| A | 12 | 194 | 5844 | 30.16 | 839 | 827 | 166.3 |
| B | 0 | 230 | 26717 | 168.88 | 822 | 806 | 153.4 |
| B | 12 | 111 | 17890 | 111.35 | 822 | 806 | 153.4 |
| B | 0 | 183 | 16380 | 101.51 | 822 | 806 | 153.4 |
| C | 3 | 233 | 165094 | 924.19 | 777 | 786 | 177.8 |
| C | 14 | 238 | 127402 | 712.18 | 777 | 786 | 177.8 |
| C | 13 | 61 | 5307 | 25.43 | 777 | 786 | 177.8 |
| D | 11 | 176 | 400361 | 2130.23 | 779 | 760 | 187.6 |
| D | 1 | 52 | 366576 | 1950.13 | 779 | 760 | 187.6 |
| D | 10 | 172 | 273773 | 1455.4 | 779 | 760 | 187.6 |
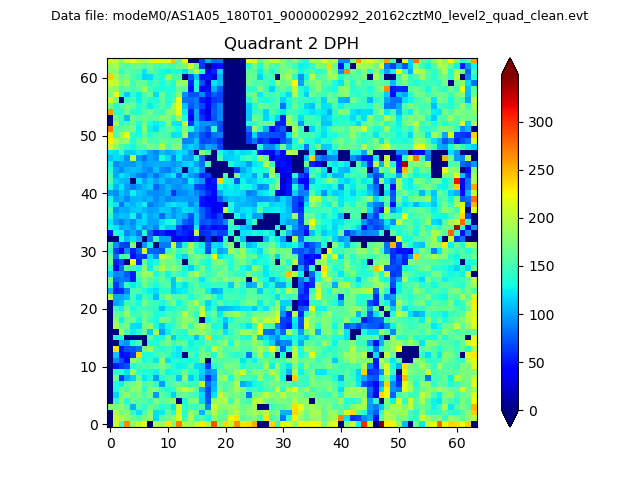
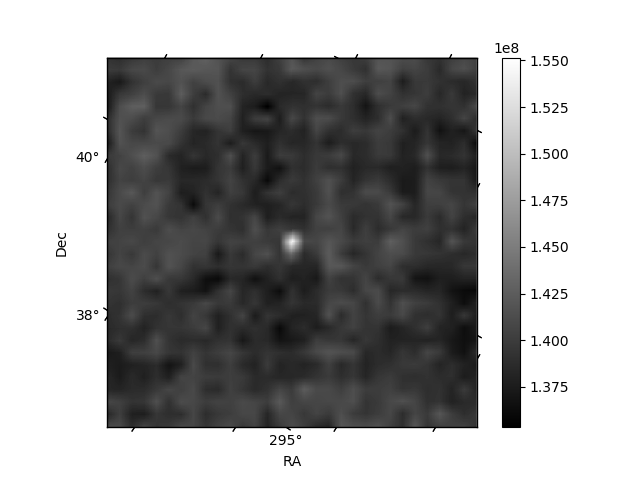
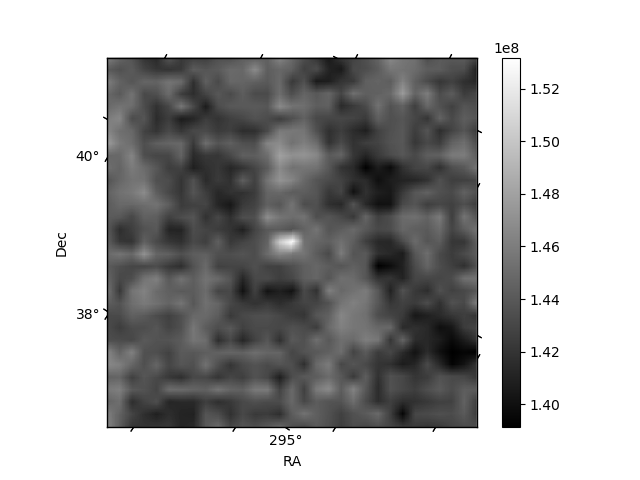
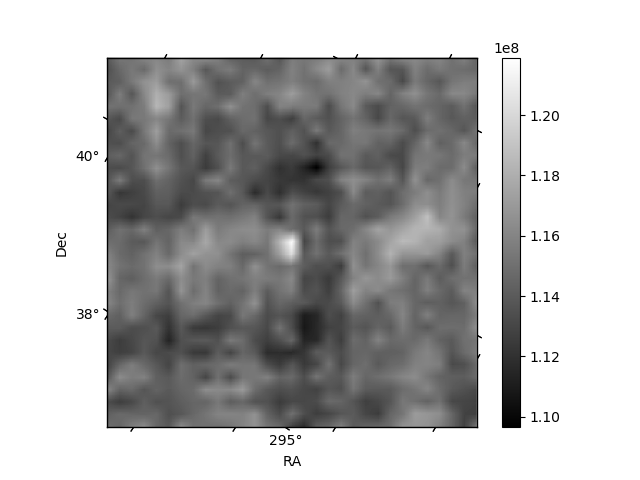
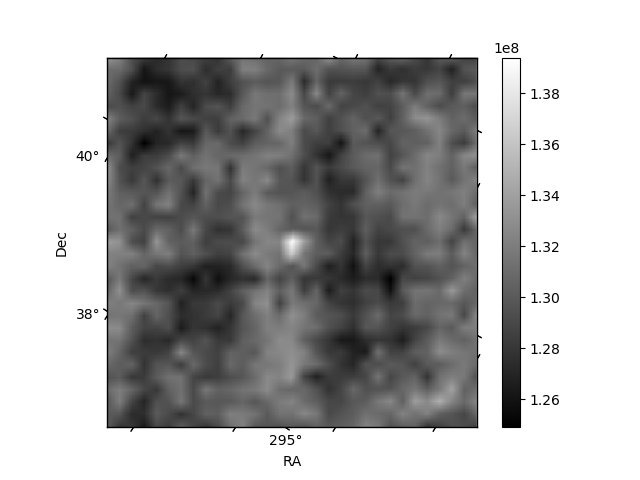
Histogram calculated using DETX and DETY for each event in the final _common_clean file
| Quadrant A | 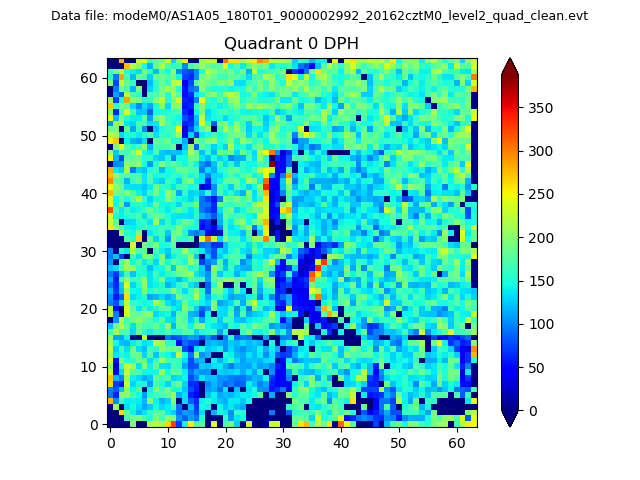 |
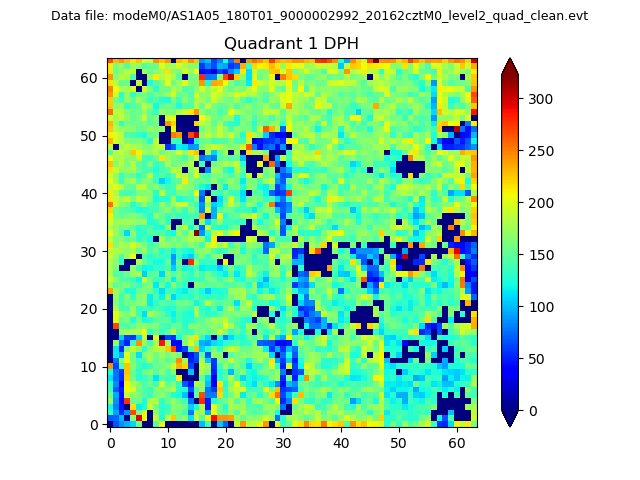 |
Quadrant B |
|---|---|---|---|
| Quadrant D | 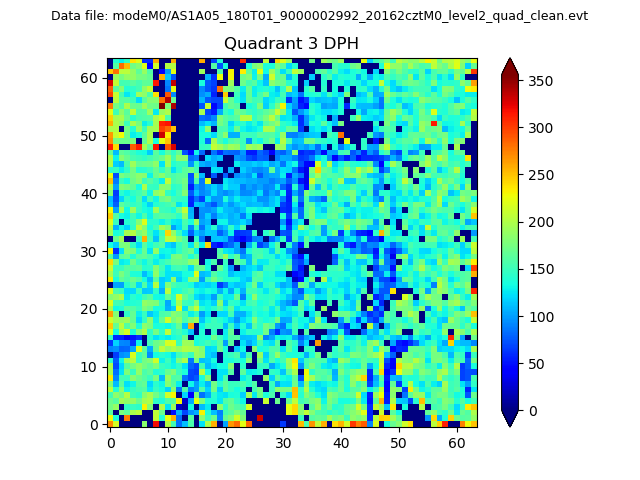 |
 |
Quadrant C |
| Plot type | Count rate plots | Images |
|---|---|---|
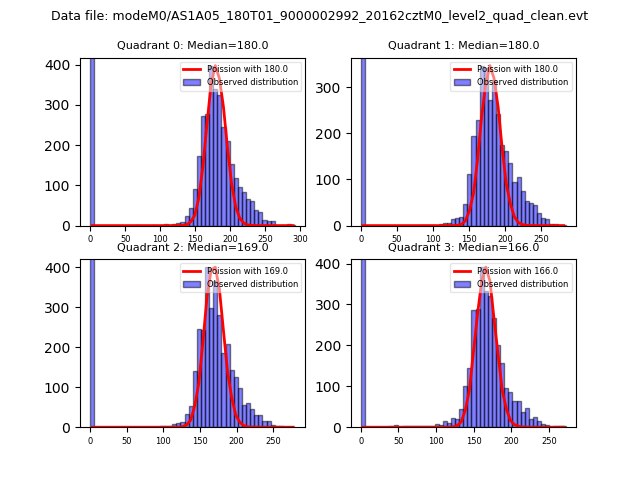
| Comparison with Poisson distribution Blue bars denote a histogram of data divided into 1 sec bins. Red curve is a Poisson curve with rate = median count rate of data. |
 |
 |
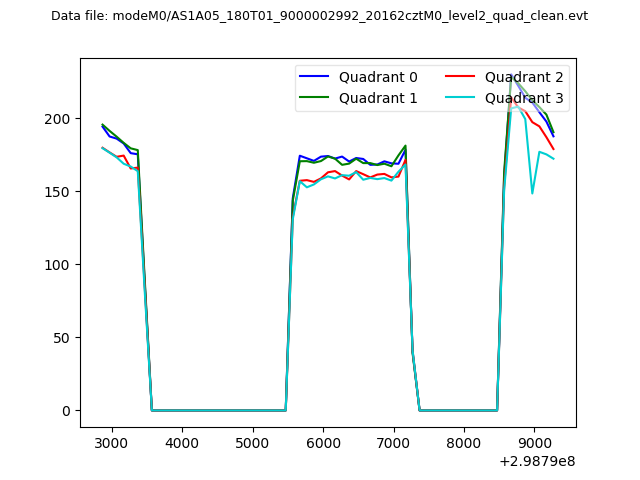
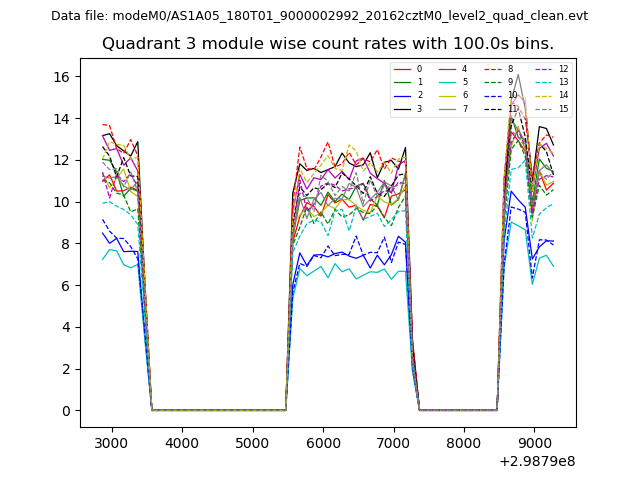
| Quadrant-wise count rates Data is divided into 100 sec bins |
 |
|
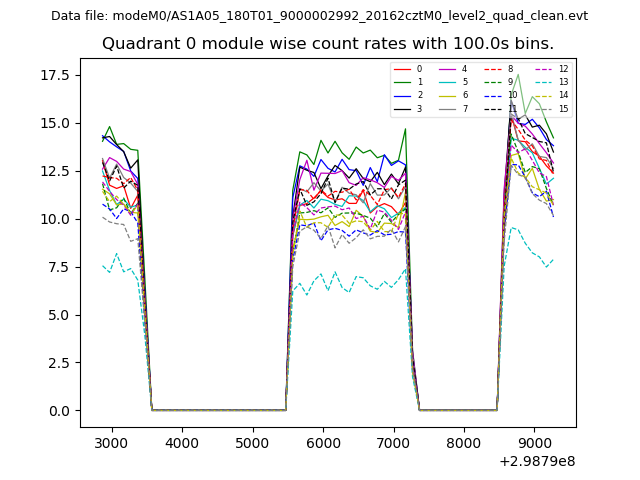
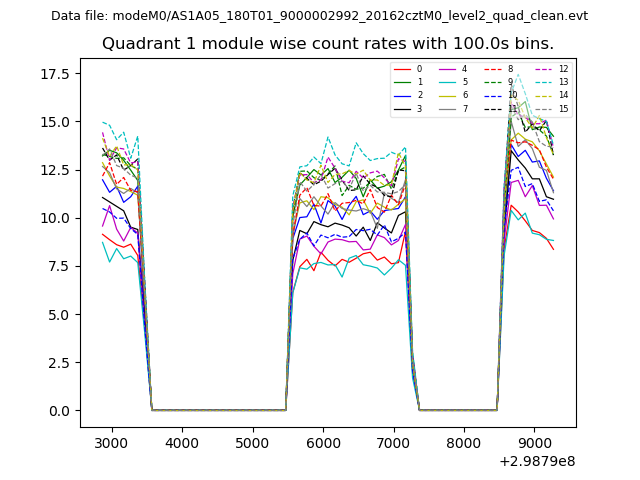
| Module-wise count rates for Quadrant A Data is divided into 100 sec bins |
 |
 |
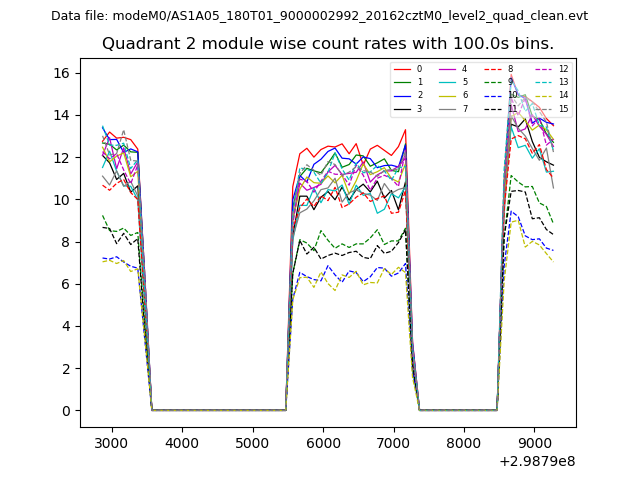
| Module-wise count rates for Quadrant B Data is divided into 100 sec bins |
 |
 |
| Module-wise count rates for Quadrant C Data is divided into 100 sec bins |
 |
 |
| Module-wise count rates for Quadrant D Data is divided into 100 sec bins |
 |
 |
| Parameter | Plot |
|---|---|
| CZT HV Monitor | 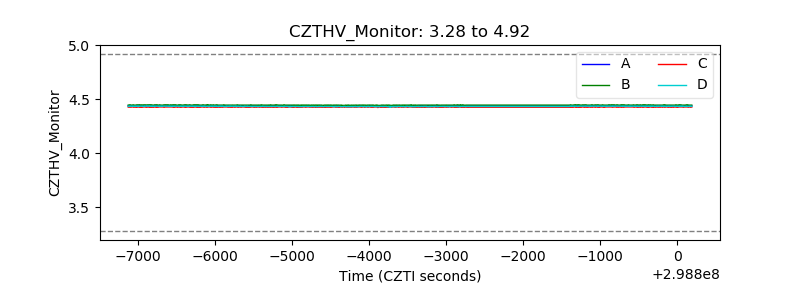 |
| D_VDD | 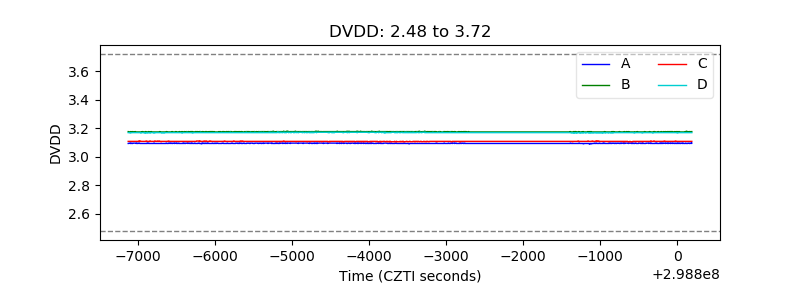 |
| Temperature 1 | 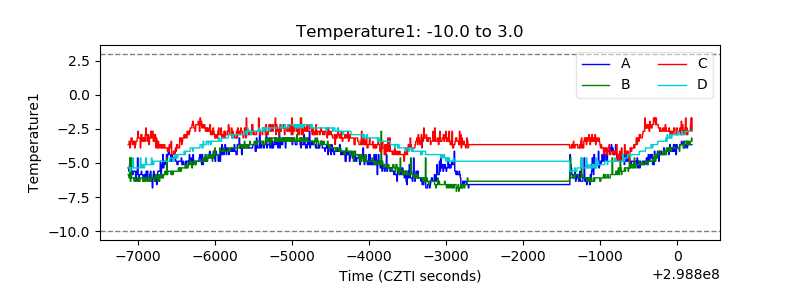 |
| Veto HV Monitor | 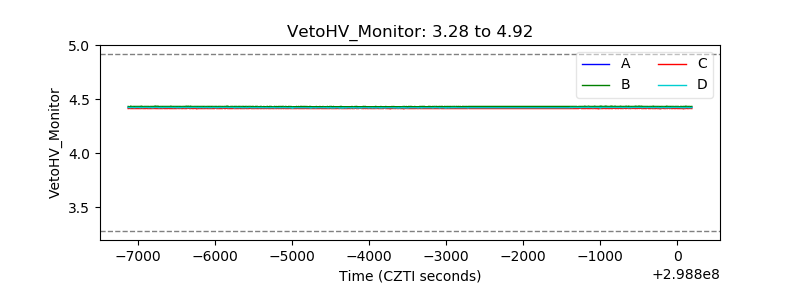 |
| Veto LLD | 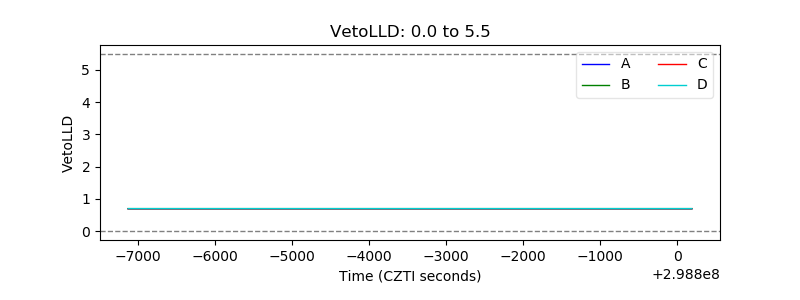 |
| Alpha Counter | 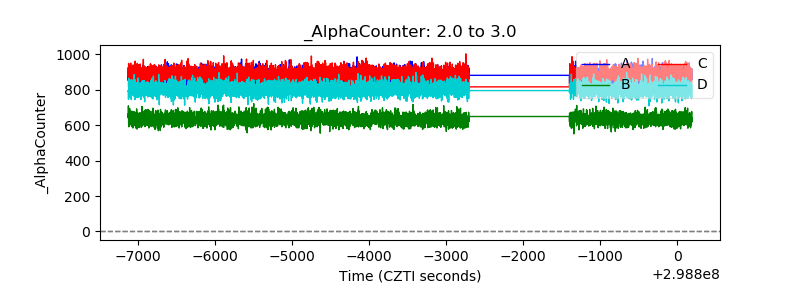 |
| _CPM_Rate | 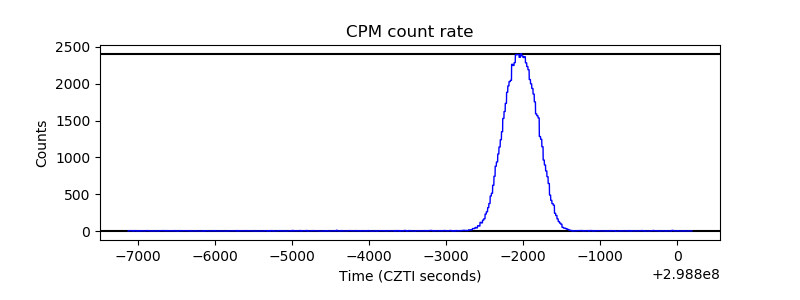 |
| CZT Counter | 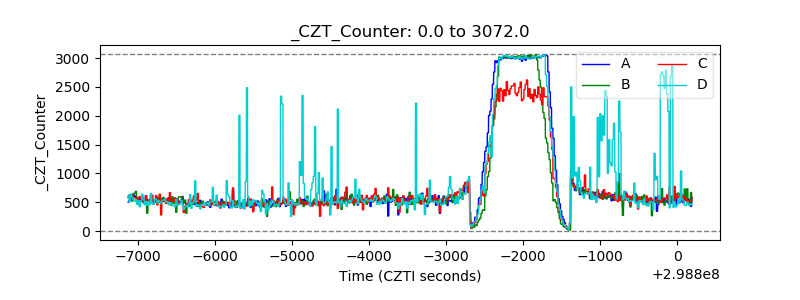 |
| +2.5 Volts monitor |  |
| +5 Volts monitor |  |
| _ROLL_ROT | 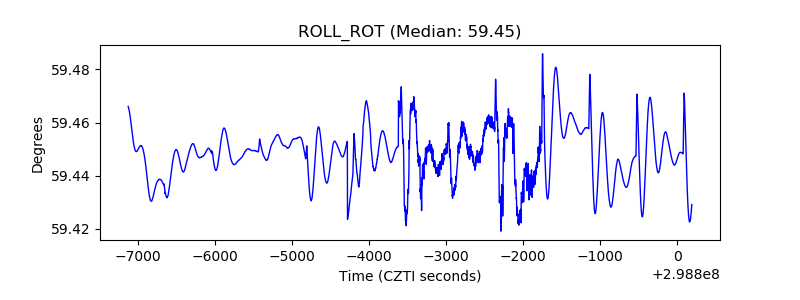 |
| _Roll_DEC | 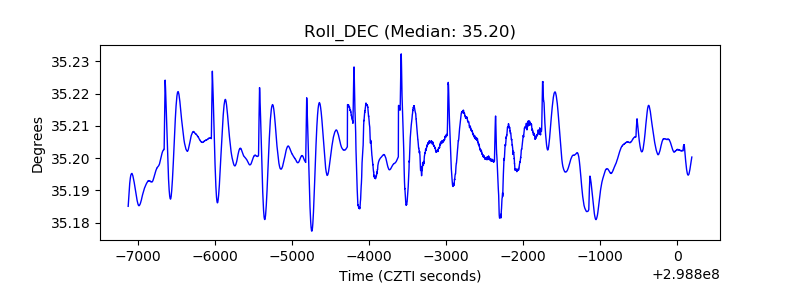 |
| _Roll_RA | 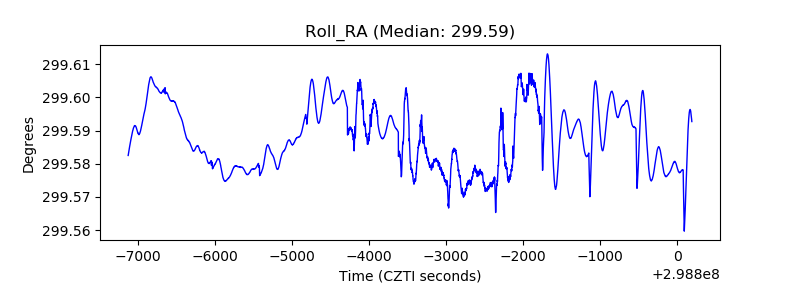 |
| Veto Counter | 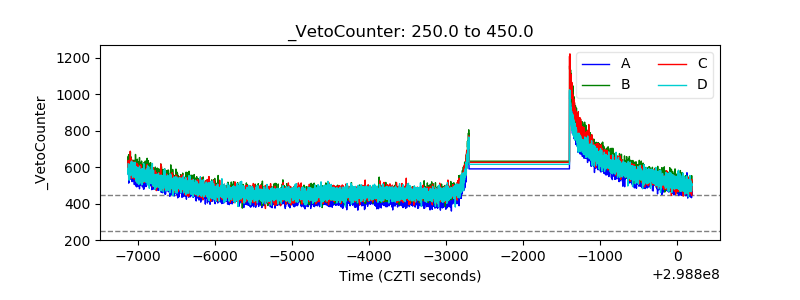 |