| Param | Original file | Final file |
|---|---|---|
| Filename | modeM0/AS1A05_180T01_9000002992_20166cztM0_level2.evt | modeM0/AS1A05_180T01_9000002992_20166cztM0_level2_quad_clean.evt |
| Size (bytes) | 1,319,952,960 | 237,582,720 |
| Size | 1.2 GB | 226.6 MB |
| Events in quadrant A | 8,746,636 | 1,566,208 |
| Events in quadrant B | 8,935,816 | 1,549,073 |
| Events in quadrant C | 9,761,370 | 1,465,278 |
| Events in quadrant D | 11,391,302 | 1,451,466 |
| Mode M9 | |||
|---|---|---|---|
| Quadrant | BADHDUFLAG | Total packets | Discarded packets |
| A | 0 | 30 | 0 |
| B | 0 | 30 | 0 |
| C | 0 | 30 | 0 |
| D | 0 | 30 | 0 |
| Mode M0 | |||
|---|---|---|---|
| Quadrant | BADHDUFLAG | Total packets | Discarded packets |
| A | 0 | 35541 | 3 |
| B | 0 | 36171 | 3 |
| C | 0 | 39417 | 3 |
| D | 0 | 44591 | 3 |
| Mode SS | |||
|---|---|---|---|
| Quadrant | BADHDUFLAG | Total packets | Discarded packets |
| A | 0 | 344 | 0 |
| B | 0 | 344 | 0 |
| C | 0 | 344 | 0 |
| D | 0 | 344 | 0 |
| Quadrant | Total seconds | Saturated seconds | Saturation percentage |
|---|---|---|---|
| A | 16877 | 376 | 2.227884% |
| B | 16878 | 390 | 2.310700% |
| C | 16878 | 457 | 2.707667% |
| D | 16878 | 819 | 4.852471% |
Noise dominated data is calculated using 1-second bins in cleaned event files. If a bin has >2000 counts, and if more than 50% of those come from <1% of pixels, then it is considered to be noise-dominated and hence unusable.
| Quadrant | # 1 sec bins | Bins with >0 counts | Bins with >2000 counts | High rate bins dominated by noise | Noise dominated (total time) | Noise dominated (detector-on time) | Marked lightcurve |
|---|---|---|---|---|---|---|---|
| A | 19872 | 16880 | 7 | 7 | 0.04% | 0.04% | 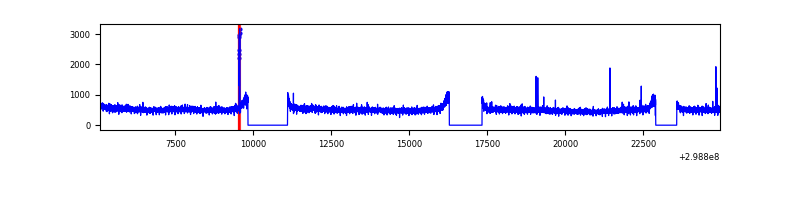 |
| B | 19873 | 16881 | 5 | 5 | 0.03% | 0.03% | 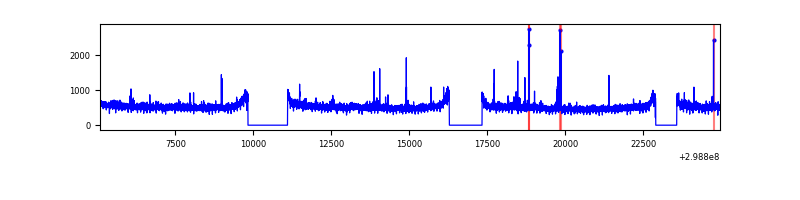 |
| C | 19873 | 16881 | 1 | 1 | 0.01% | 0.01% | 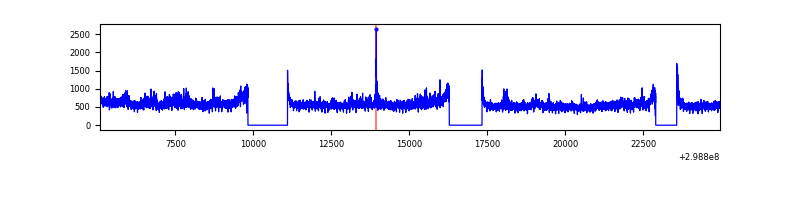 |
| D | 19873 | 16881 | 509 | 509 | 2.56% | 3.02% | 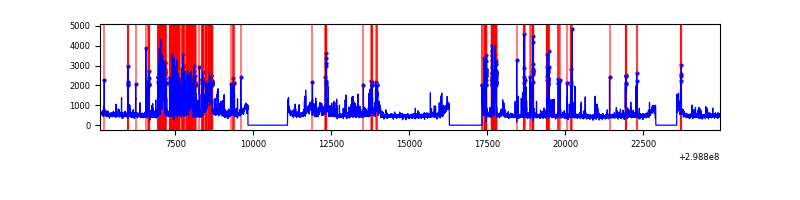 |
Top three noisy pixels from each quadrant. If the there are fewer than three noisy pixels in the level2.evt file, extra rows are filled as -1
| Pixel properties | Quadrant properties | ||||||
|---|---|---|---|---|---|---|---|
| Quadrant | DetID | PixID | Counts | Sigma | Mean | Median | Sigma |
| A | 14 | 238 | 44005 | 93.14 | 2263 | 2227 | 448.5 |
| A | 0 | 226 | 19413 | 38.32 | 2263 | 2227 | 448.5 |
| A | 3 | 137 | 17763 | 34.64 | 2263 | 2227 | 448.5 |
| B | 0 | 198 | 98668 | 231.46 | 2224 | 2177 | 416.9 |
| B | 12 | 111 | 49495 | 113.51 | 2224 | 2177 | 416.9 |
| B | 11 | 111 | 43777 | 99.79 | 2224 | 2177 | 416.9 |
| C | 3 | 233 | 1106549 | 2245.45 | 2127 | 2146 | 491.8 |
| C | 14 | 238 | 337684 | 682.21 | 2127 | 2146 | 491.8 |
| C | 5 | 4 | 22441 | 41.26 | 2127 | 2146 | 491.8 |
| D | 1 | 52 | 2141824 | 4055.54 | 2174 | 2114 | 527.6 |
| D | 12 | 238 | 341699 | 643.64 | 2174 | 2114 | 527.6 |
| D | 11 | 176 | 226427 | 425.16 | 2174 | 2114 | 527.6 |
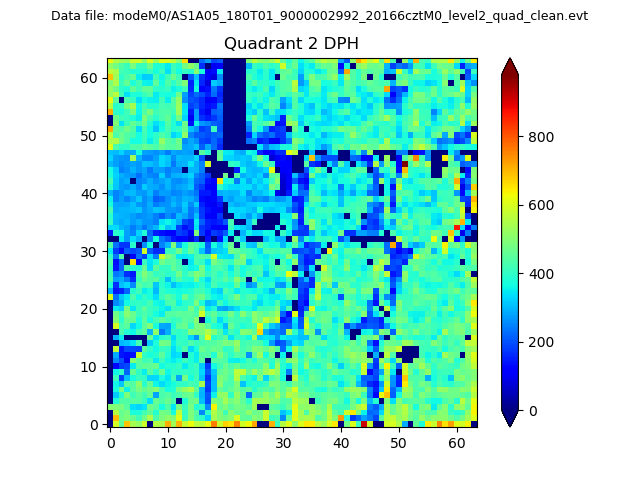
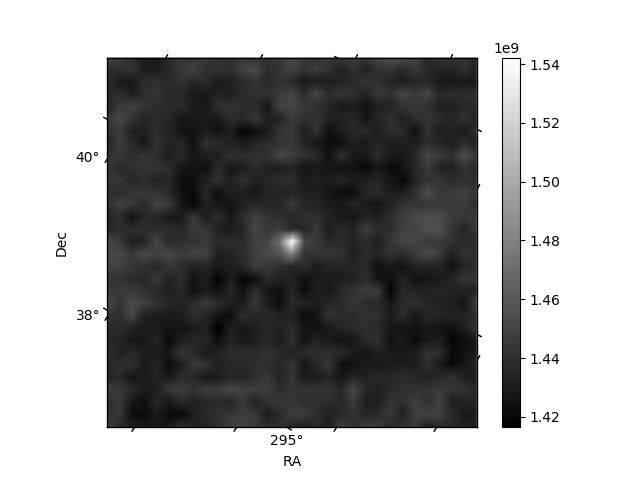
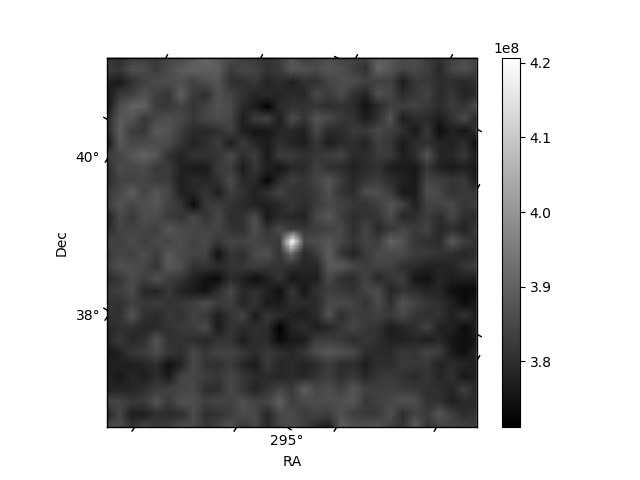
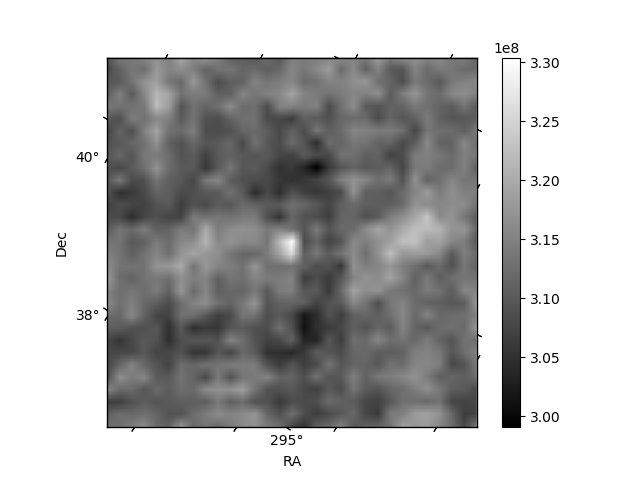
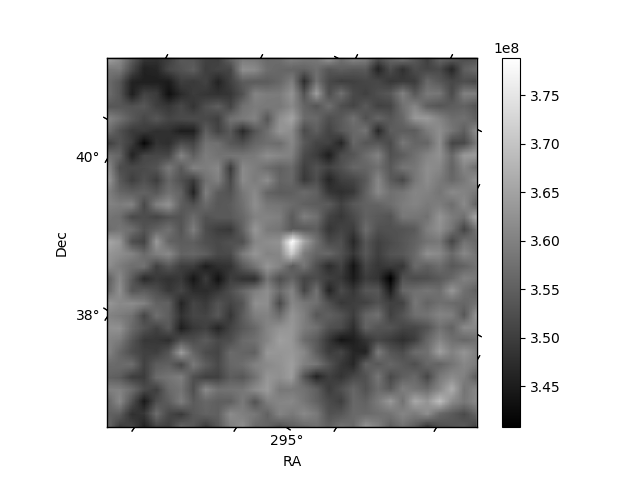
Histogram calculated using DETX and DETY for each event in the final _common_clean file
| Quadrant A | 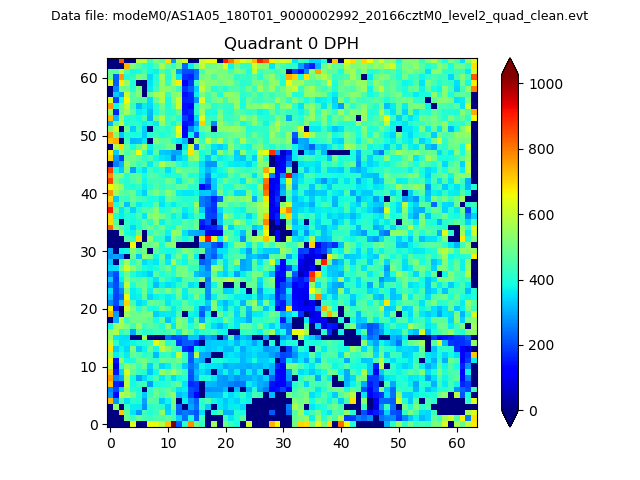 |
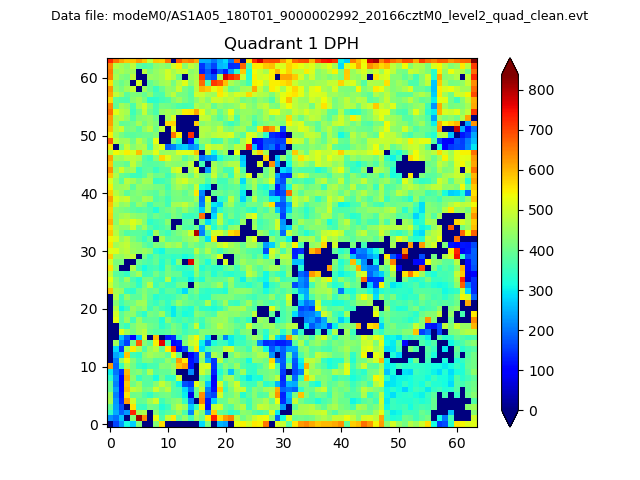 |
Quadrant B |
|---|---|---|---|
| Quadrant D | 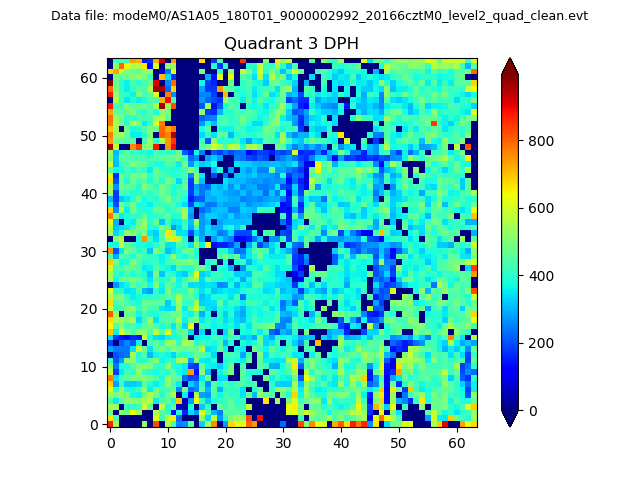 |
 |
Quadrant C |
| Plot type | Count rate plots | Images |
|---|---|---|
| Comparison with Poisson distribution Blue bars denote a histogram of data divided into 1 sec bins. Red curve is a Poisson curve with rate = median count rate of data. |
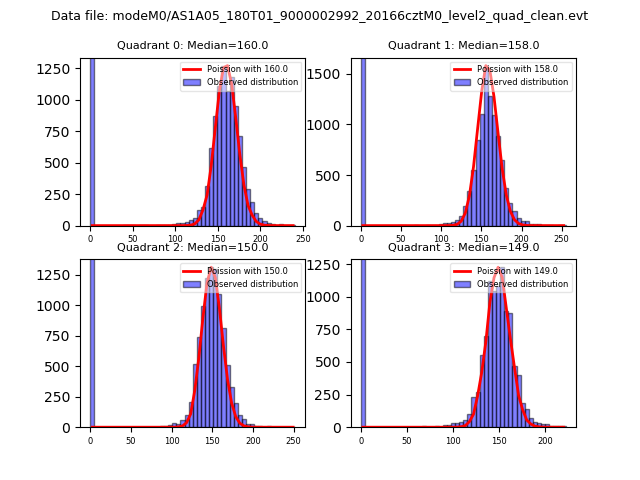 |
 |
| Quadrant-wise count rates Data is divided into 100 sec bins |
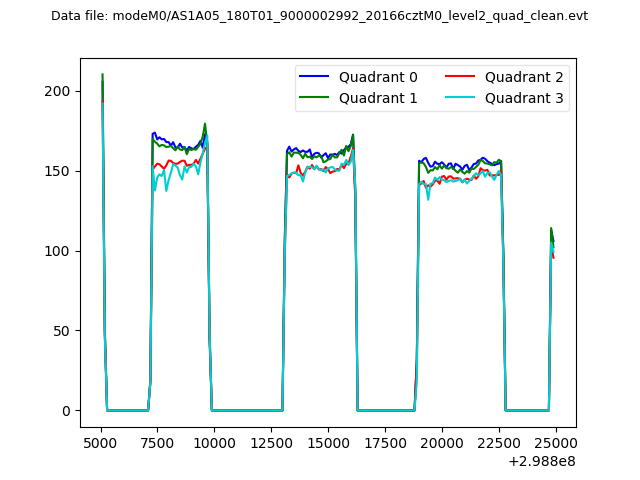 |
|
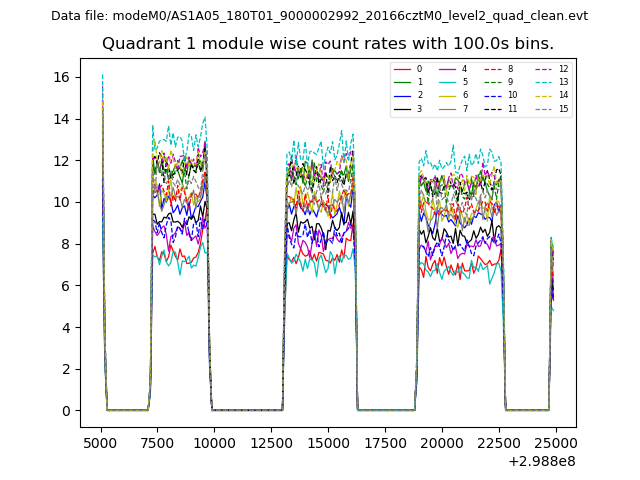
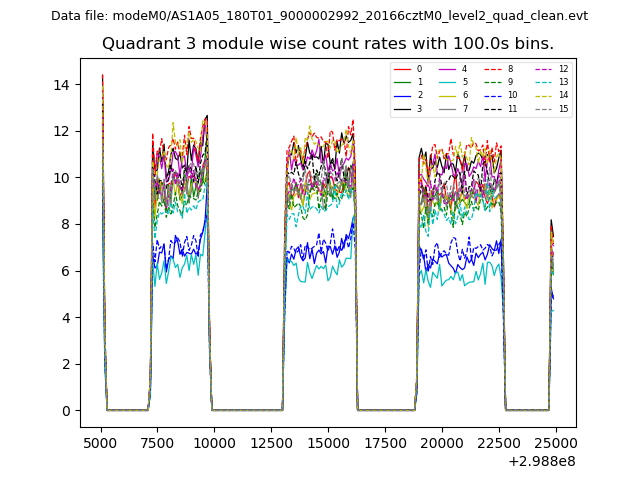
| Module-wise count rates for Quadrant A Data is divided into 100 sec bins |
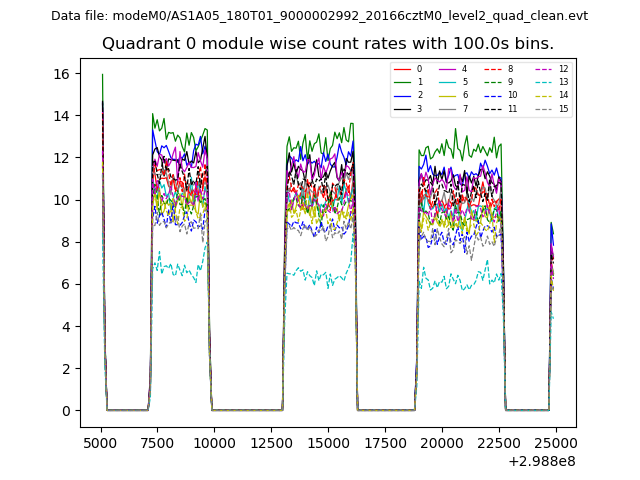 |
 |
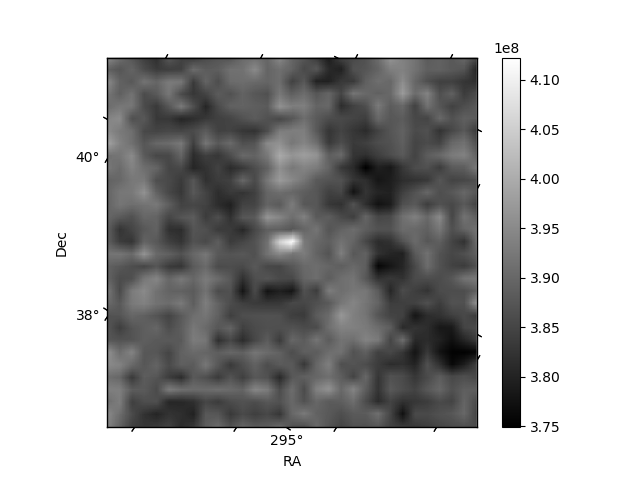
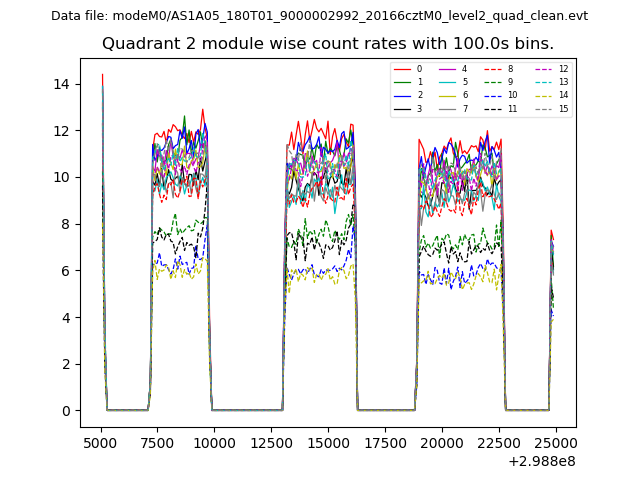
| Module-wise count rates for Quadrant B Data is divided into 100 sec bins |
 |
 |
| Module-wise count rates for Quadrant C Data is divided into 100 sec bins |
 |
 |
| Module-wise count rates for Quadrant D Data is divided into 100 sec bins |
 |
 |
| Parameter | Plot |
|---|---|
| CZT HV Monitor | 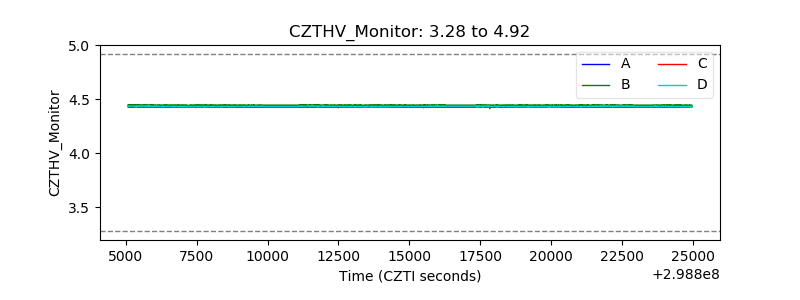 |
| D_VDD | 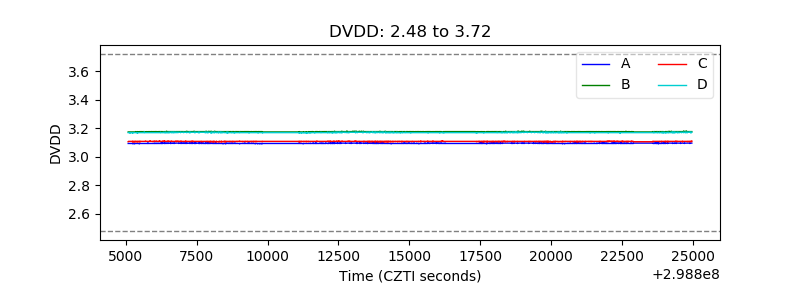 |
| Temperature 1 | 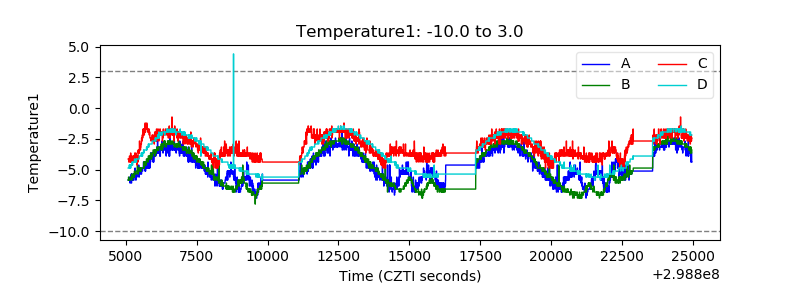 |
| Veto HV Monitor | 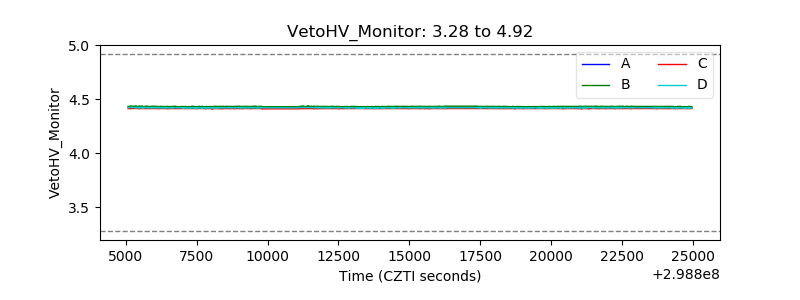 |
| Veto LLD | 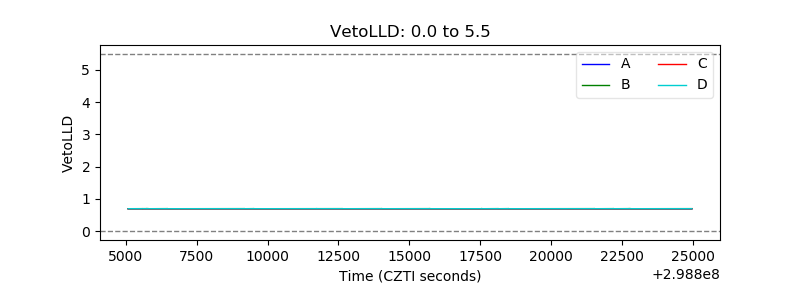 |
| Alpha Counter | 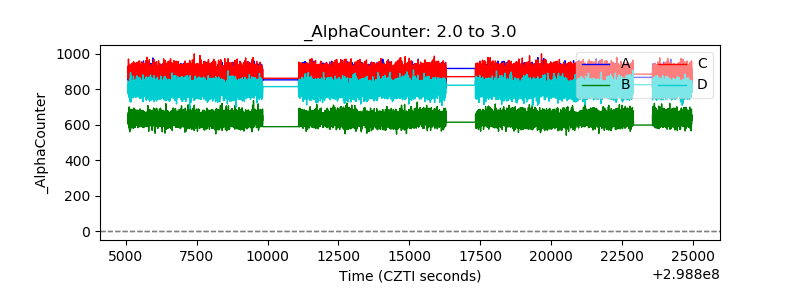 |
| _CPM_Rate | 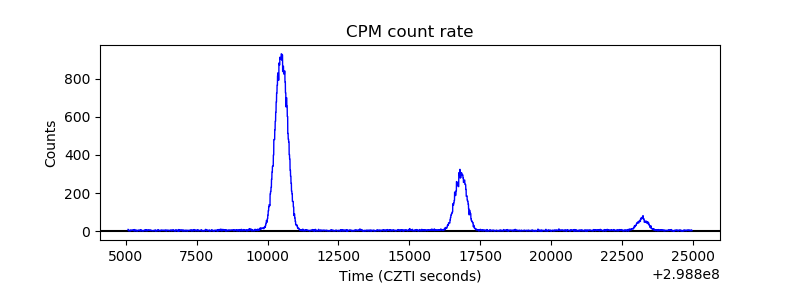 |
| CZT Counter | 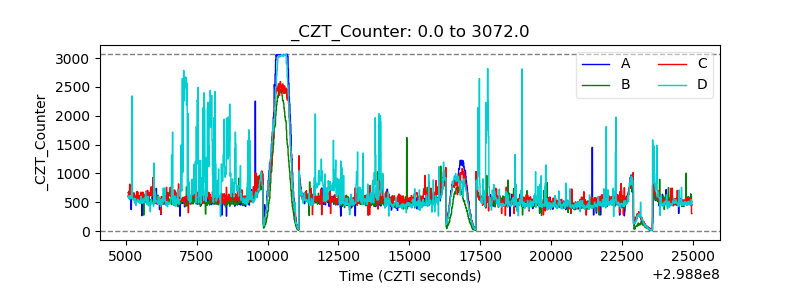 |
| +2.5 Volts monitor |  |
| +5 Volts monitor | 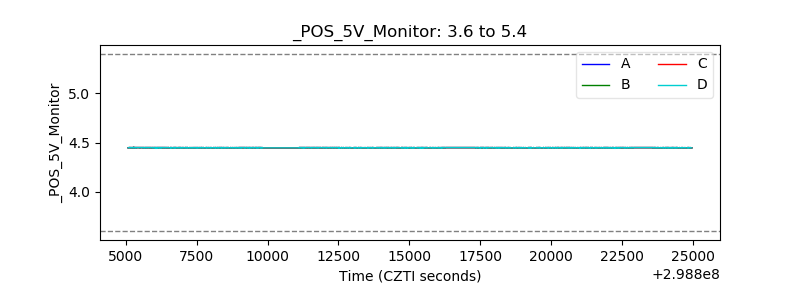 |
| _ROLL_ROT | 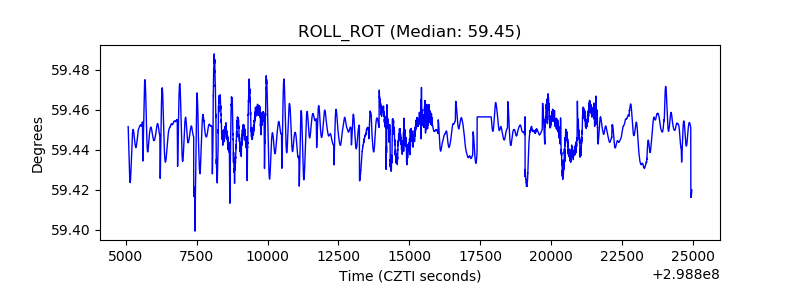 |
| _Roll_DEC | 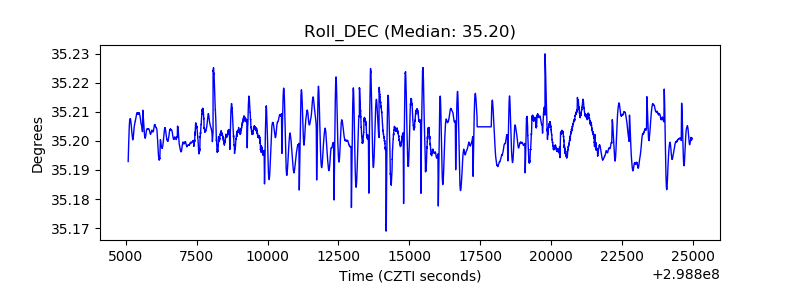 |
| _Roll_RA | 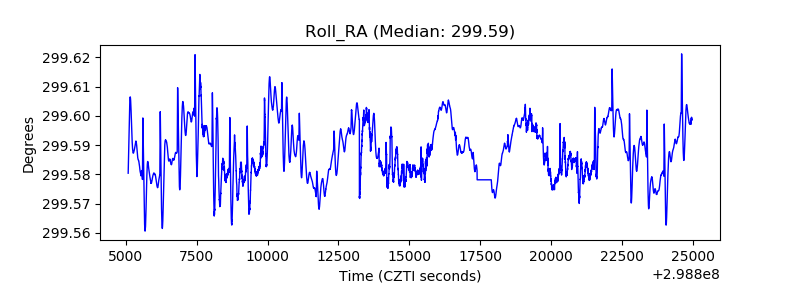 |
| Veto Counter | 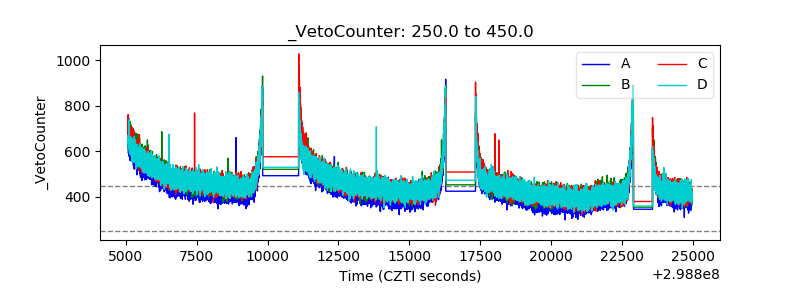 |