| Param | Original file | Final file |
|---|---|---|
| Filename | modeM0/AS1A05_180T01_9000002992_20167cztM0_level2.evt | modeM0/AS1A05_180T01_9000002992_20167cztM0_level2_quad_clean.evt |
| Size (bytes) | 346,907,520 | 79,341,120 |
| Size | 330.8 MB | 75.7 MB |
| Events in quadrant A | 2,482,277 | 529,892 |
| Events in quadrant B | 2,514,371 | 524,779 |
| Events in quadrant C | 2,634,317 | 499,827 |
| Events in quadrant D | 2,536,135 | 499,375 |
| Mode M9 | |||
|---|---|---|---|
| Quadrant | BADHDUFLAG | Total packets | Discarded packets |
| A | 0 | 6 | 0 |
| B | 0 | 6 | 0 |
| C | 0 | 6 | 0 |
| D | 0 | 6 | 0 |
| Mode M0 | |||
|---|---|---|---|
| Quadrant | BADHDUFLAG | Total packets | Discarded packets |
| A | 0 | 10462 | 1 |
| B | 0 | 10472 | 1 |
| C | 0 | 10656 | 1 |
| D | 0 | 10865 | 1 |
| Mode SS | |||
|---|---|---|---|
| Quadrant | BADHDUFLAG | Total packets | Discarded packets |
| A | 0 | 102 | 0 |
| B | 0 | 102 | 0 |
| C | 0 | 102 | 0 |
| D | 0 | 102 | 0 |
| Quadrant | Total seconds | Saturated seconds | Saturation percentage |
|---|---|---|---|
| A | 4969 | 141 | 2.837593% |
| B | 4970 | 131 | 2.635815% |
| C | 4970 | 168 | 3.380282% |
| D | 4970 | 132 | 2.655936% |
Noise dominated data is calculated using 1-second bins in cleaned event files. If a bin has >2000 counts, and if more than 50% of those come from <1% of pixels, then it is considered to be noise-dominated and hence unusable.
| Quadrant | # 1 sec bins | Bins with >0 counts | Bins with >2000 counts | High rate bins dominated by noise | Noise dominated (total time) | Noise dominated (detector-on time) | Marked lightcurve |
|---|---|---|---|---|---|---|---|
| A | 5644 | 4970 | 11 | 11 | 0.19% | 0.22% | 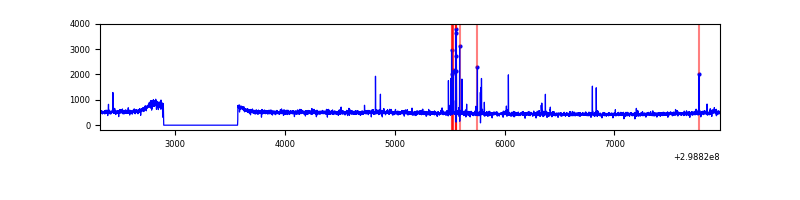 |
| B | 5645 | 4971 | 2 | 2 | 0.04% | 0.04% | 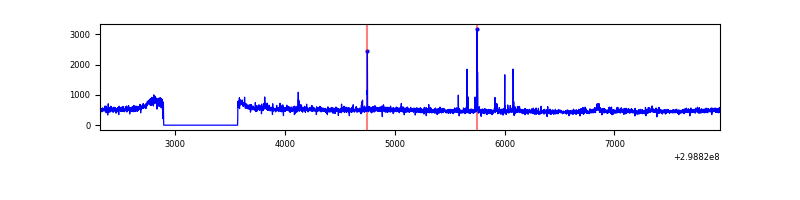 |
| C | 5645 | 4971 | 0 | 0 | 0.00% | 0.00% |  |
| D | 5645 | 4971 | 15 | 15 | 0.27% | 0.30% | 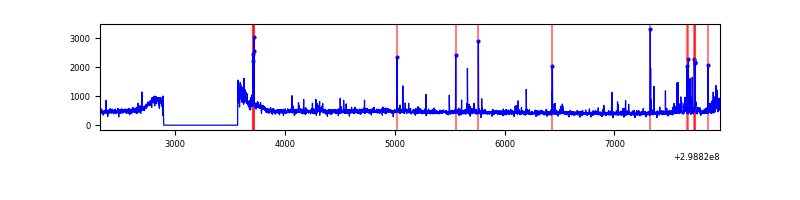 |
Top three noisy pixels from each quadrant. If the there are fewer than three noisy pixels in the level2.evt file, extra rows are filled as -1
| Pixel properties | Quadrant properties | ||||||
|---|---|---|---|---|---|---|---|
| Quadrant | DetID | PixID | Counts | Sigma | Mean | Median | Sigma |
| A | 14 | 238 | 67533 | 525.25 | 625 | 615 | 127.4 |
| A | 10 | 253 | 5403 | 37.58 | 625 | 615 | 127.4 |
| A | 0 | 226 | 5381 | 37.41 | 625 | 615 | 127.4 |
| B | 0 | 198 | 53075 | 440.13 | 617 | 601 | 119.2 |
| B | 0 | 183 | 20222 | 164.57 | 617 | 601 | 119.2 |
| B | 12 | 111 | 13981 | 112.23 | 617 | 601 | 119.2 |
| C | 3 | 233 | 227369 | 1612.1 | 594 | 598 | 140.7 |
| C | 14 | 238 | 92425 | 652.79 | 594 | 598 | 140.7 |
| C | 13 | 61 | 4126 | 25.08 | 594 | 598 | 140.7 |
| D | 1 | 52 | 112465 | 757.52 | 607 | 591 | 147.7 |
| D | 1 | 20 | 38912 | 259.48 | 607 | 591 | 147.7 |
| D | 2 | 234 | 24325 | 160.71 | 607 | 591 | 147.7 |
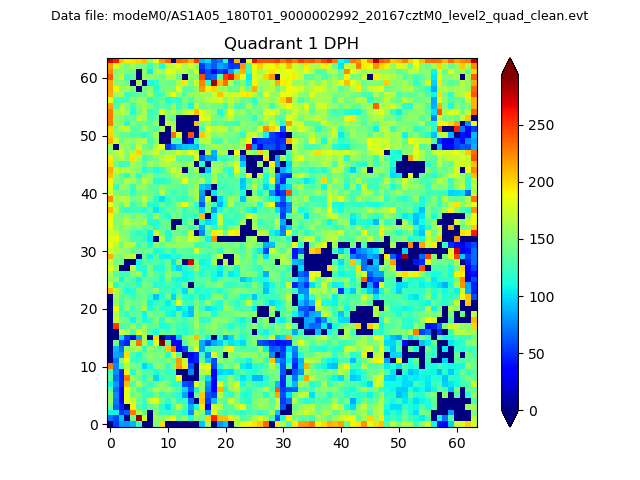
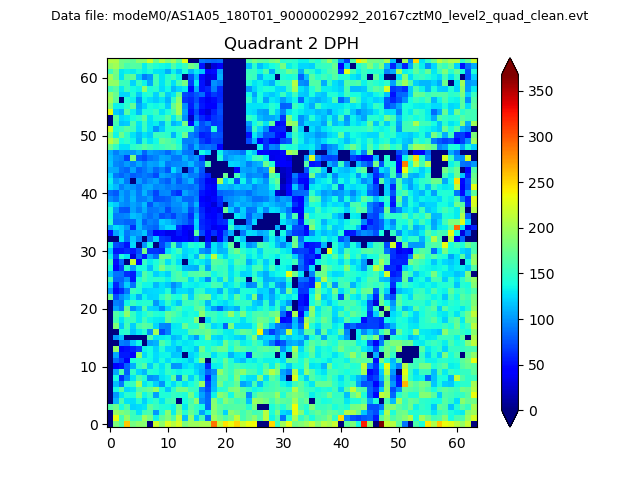
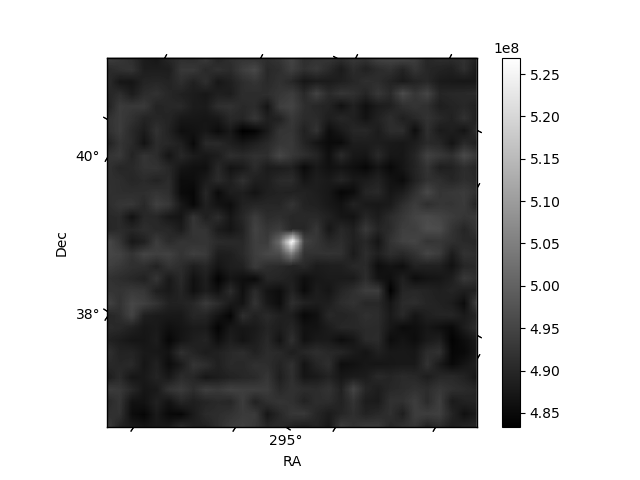
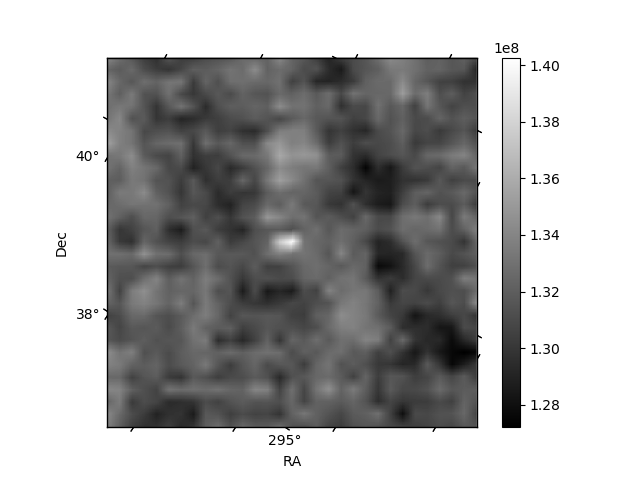
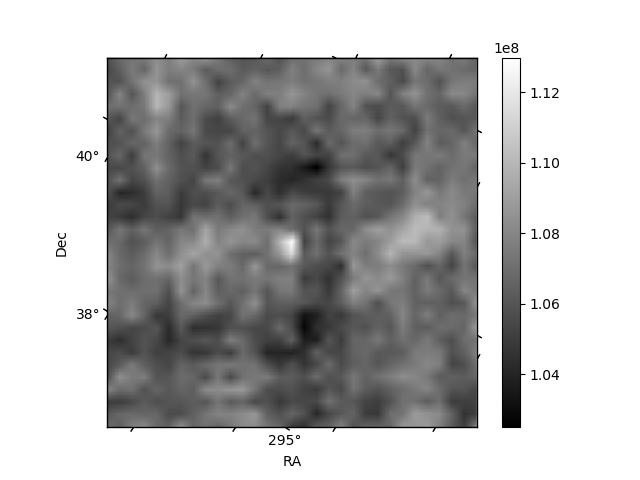
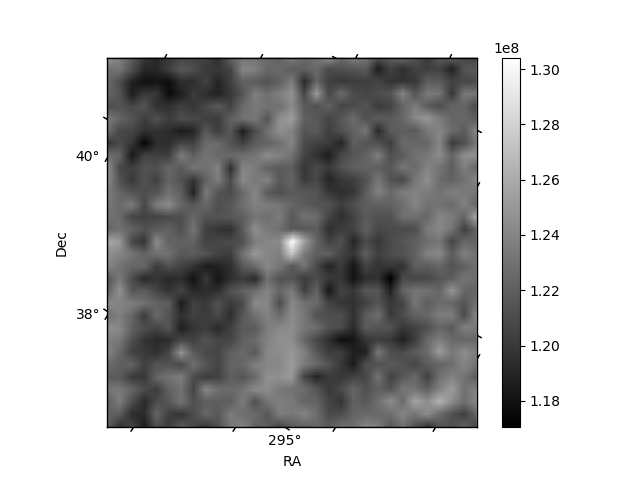
Histogram calculated using DETX and DETY for each event in the final _common_clean file
| Quadrant A | 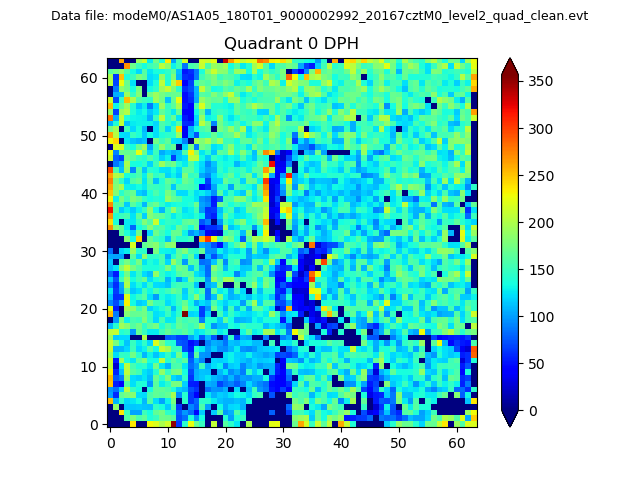 |
 |
Quadrant B |
|---|---|---|---|
| Quadrant D | 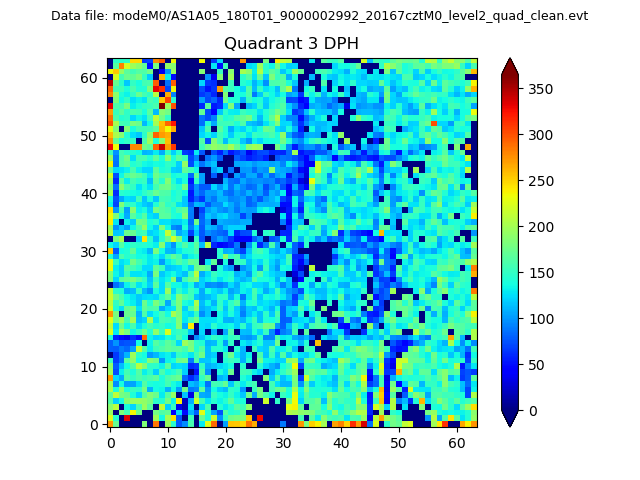 |
 |
Quadrant C |
| Plot type | Count rate plots | Images |
|---|---|---|
| Comparison with Poisson distribution Blue bars denote a histogram of data divided into 1 sec bins. Red curve is a Poisson curve with rate = median count rate of data. |
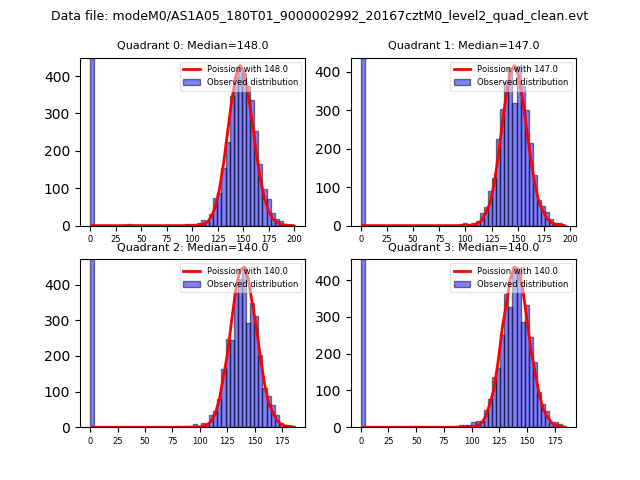 |
 |
| Quadrant-wise count rates Data is divided into 100 sec bins |
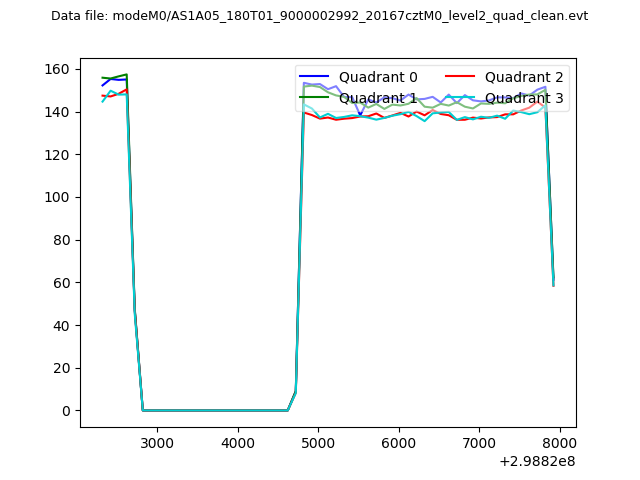 |
|
| Module-wise count rates for Quadrant A Data is divided into 100 sec bins |
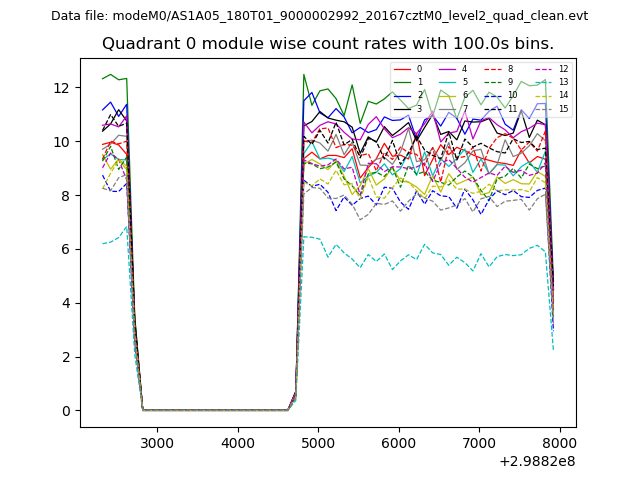 |
 |
| Module-wise count rates for Quadrant B Data is divided into 100 sec bins |
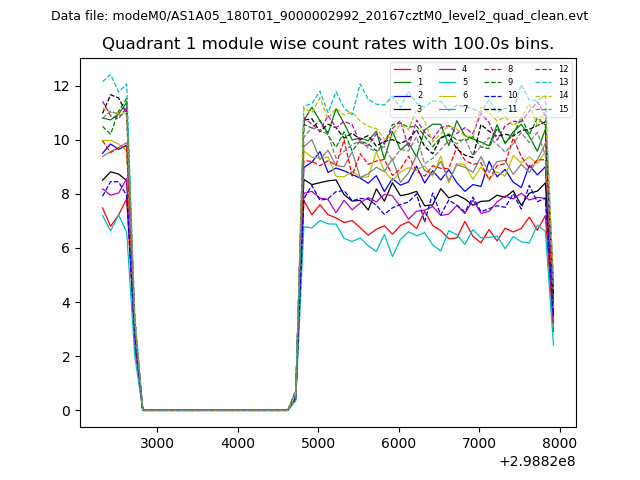 |
 |
| Module-wise count rates for Quadrant C Data is divided into 100 sec bins |
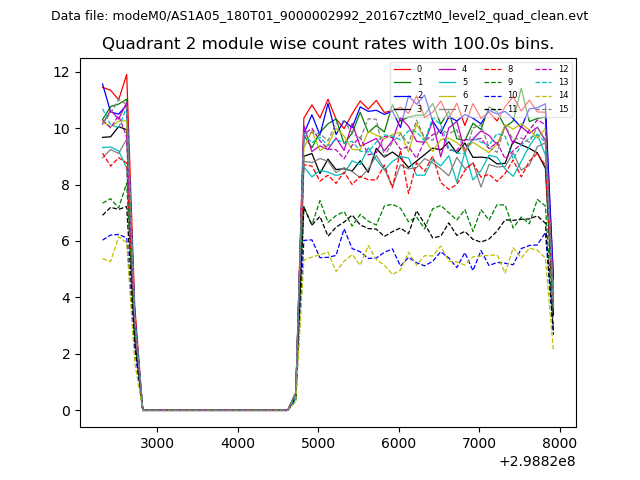 |
 |
| Module-wise count rates for Quadrant D Data is divided into 100 sec bins |
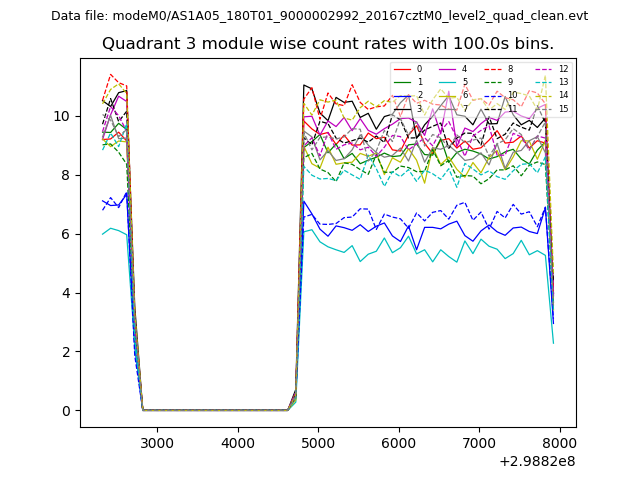 |
 |
| Parameter | Plot |
|---|---|
| CZT HV Monitor | 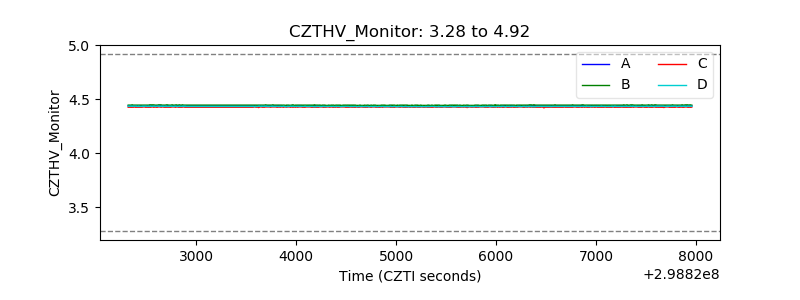 |
| D_VDD | 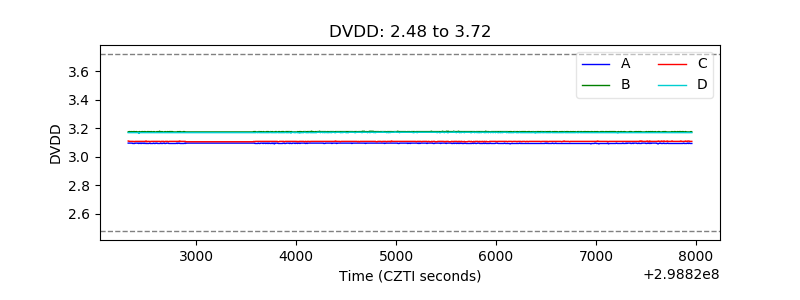 |
| Temperature 1 | 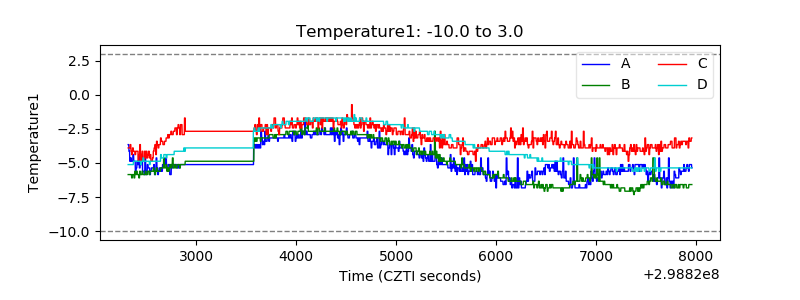 |
| Veto HV Monitor |  |
| Veto LLD | 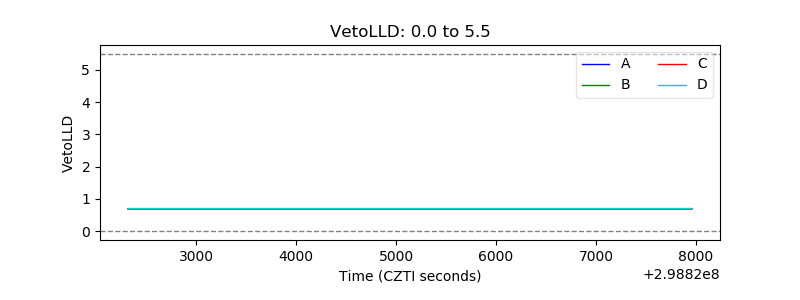 |
| Alpha Counter | 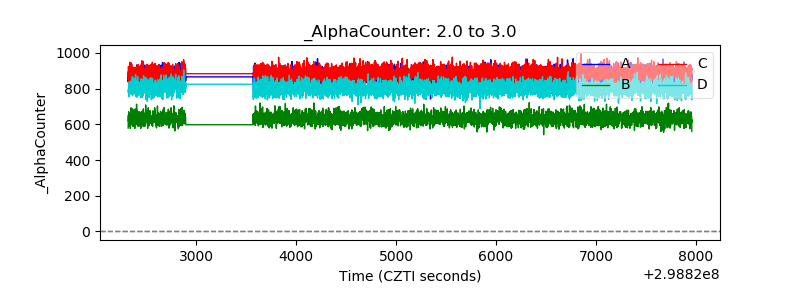 |
| _CPM_Rate | 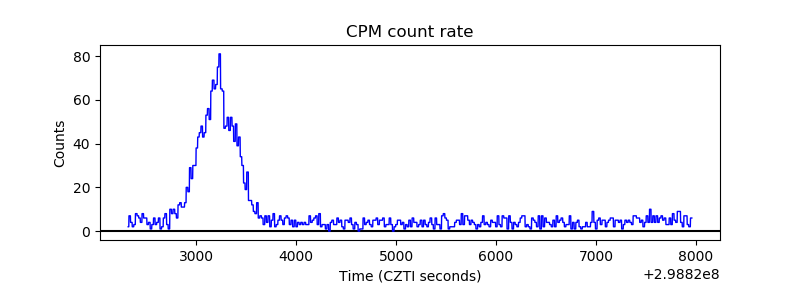 |
| CZT Counter | 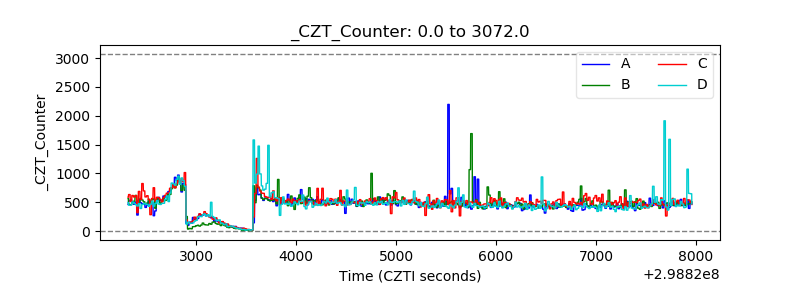 |
| +2.5 Volts monitor |  |
| +5 Volts monitor |  |
| _ROLL_ROT | 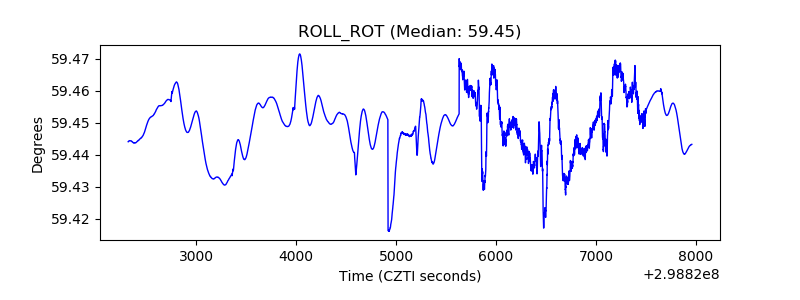 |
| _Roll_DEC |  |
| _Roll_RA | 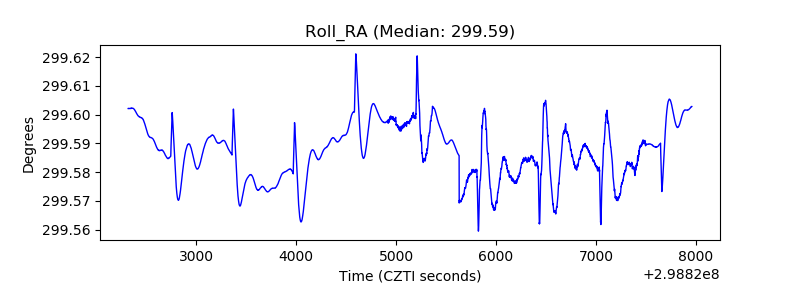 |
| Veto Counter | 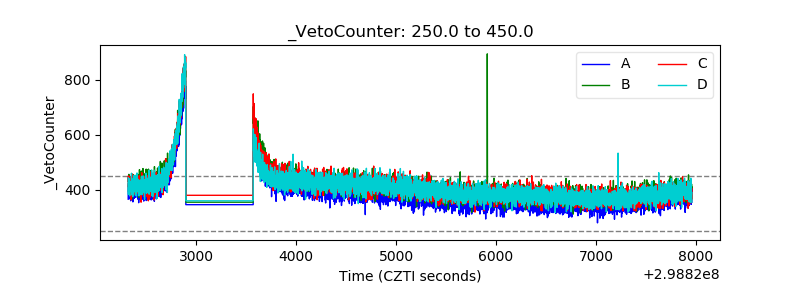 |