| Param | Original file | Final file |
|---|---|---|
| Filename | modeM0/AS1A05_180T01_9000002992_20172cztM0_level2.evt | modeM0/AS1A05_180T01_9000002992_20172cztM0_level2_quad_clean.evt |
| Size (bytes) | 276,292,800 | 68,840,640 |
| Size | 263.5 MB | 65.7 MB |
| Events in quadrant A | 1,990,609 | 463,087 |
| Events in quadrant B | 2,018,320 | 457,506 |
| Events in quadrant C | 2,087,194 | 436,078 |
| Events in quadrant D | 1,988,164 | 435,833 |
| Mode M0 | |||
|---|---|---|---|
| Quadrant | BADHDUFLAG | Total packets | Discarded packets |
| A | 0 | 8518 | 0 |
| B | 0 | 8494 | 0 |
| C | 0 | 8482 | 0 |
| D | 0 | 8693 | 0 |
| Mode SS | |||
|---|---|---|---|
| Quadrant | BADHDUFLAG | Total packets | Discarded packets |
| A | 0 | 82 | 0 |
| B | 0 | 82 | 0 |
| C | 0 | 82 | 0 |
| D | 0 | 82 | 0 |
| Quadrant | Total seconds | Saturated seconds | Saturation percentage |
|---|---|---|---|
| A | 4147 | 22 | 0.530504% |
| B | 4148 | 11 | 0.265188% |
| C | 4148 | 20 | 0.482160% |
| D | 4148 | 10 | 0.241080% |
Noise dominated data is calculated using 1-second bins in cleaned event files. If a bin has >2000 counts, and if more than 50% of those come from <1% of pixels, then it is considered to be noise-dominated and hence unusable.
| Quadrant | # 1 sec bins | Bins with >0 counts | Bins with >2000 counts | High rate bins dominated by noise | Noise dominated (total time) | Noise dominated (detector-on time) | Marked lightcurve |
|---|---|---|---|---|---|---|---|
| A | 4147 | 4147 | 11 | 11 | 0.27% | 0.27% | 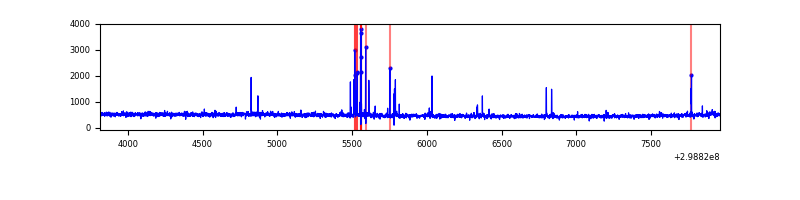 |
| B | 4148 | 4148 | 2 | 2 | 0.05% | 0.05% | 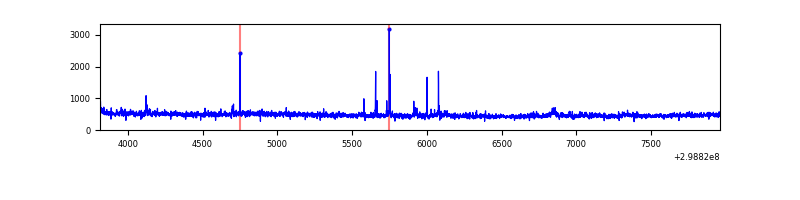 |
| C | 4148 | 4148 | 0 | 0 | 0.00% | 0.00% | 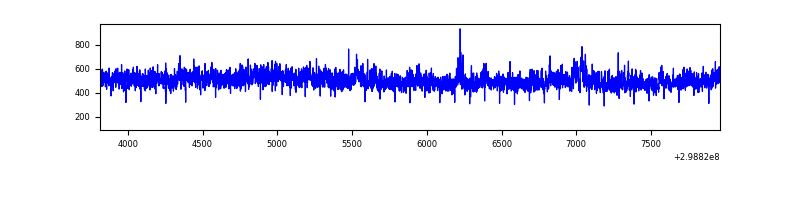 |
| D | 4148 | 4148 | 11 | 11 | 0.27% | 0.27% | 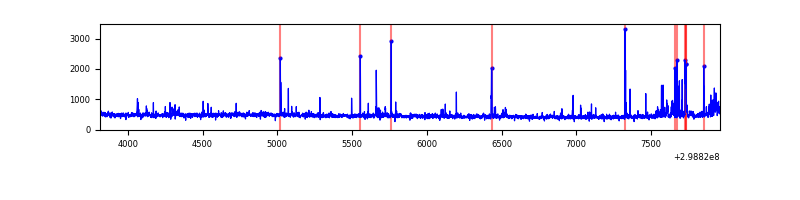 |
Top three noisy pixels from each quadrant. If the there are fewer than three noisy pixels in the level2.evt file, extra rows are filled as -1
| Pixel properties | Quadrant properties | ||||||
|---|---|---|---|---|---|---|---|
| Quadrant | DetID | PixID | Counts | Sigma | Mean | Median | Sigma |
| A | 14 | 238 | 65310 | 639.73 | 497 | 490 | 101.3 |
| A | 10 | 253 | 5206 | 46.54 | 497 | 490 | 101.3 |
| A | 0 | 226 | 4259 | 37.2 | 497 | 490 | 101.3 |
| B | 0 | 198 | 44326 | 462.87 | 494 | 481 | 94.7 |
| B | 0 | 183 | 19525 | 201.05 | 494 | 481 | 94.7 |
| B | 0 | 197 | 13190 | 134.17 | 494 | 481 | 94.7 |
| C | 3 | 233 | 156503 | 1389.12 | 476 | 482 | 112.3 |
| C | 14 | 238 | 74852 | 662.15 | 476 | 482 | 112.3 |
| C | 13 | 61 | 3273 | 24.85 | 476 | 482 | 112.3 |
| D | 1 | 52 | 109965 | 921.78 | 484 | 471 | 118.8 |
| D | 2 | 234 | 20290 | 166.85 | 484 | 471 | 118.8 |
| D | 7 | 96 | 19337 | 158.82 | 484 | 471 | 118.8 |
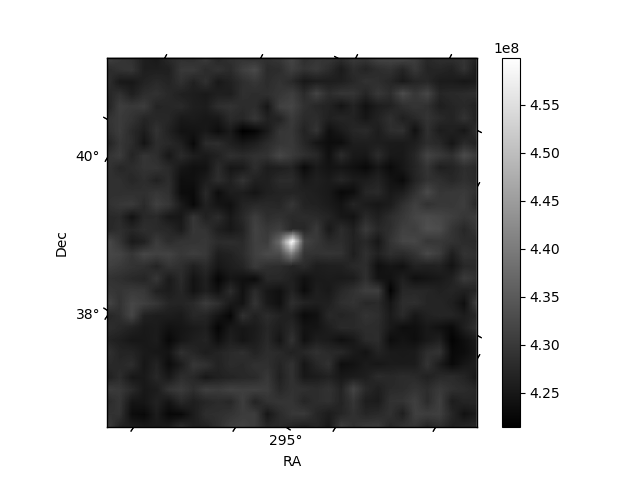
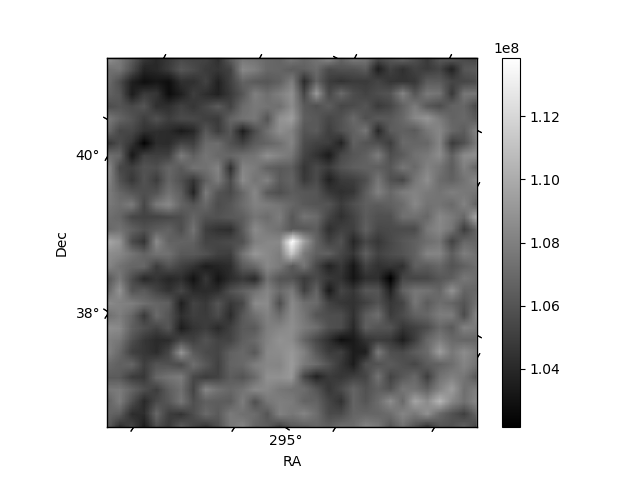
Histogram calculated using DETX and DETY for each event in the final _common_clean file
| Quadrant A | 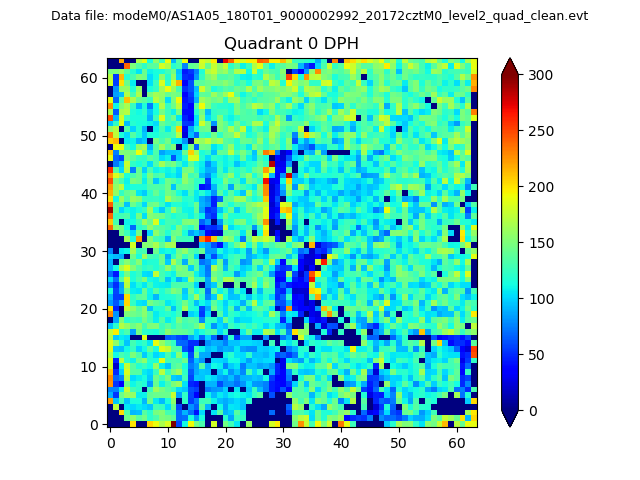 |
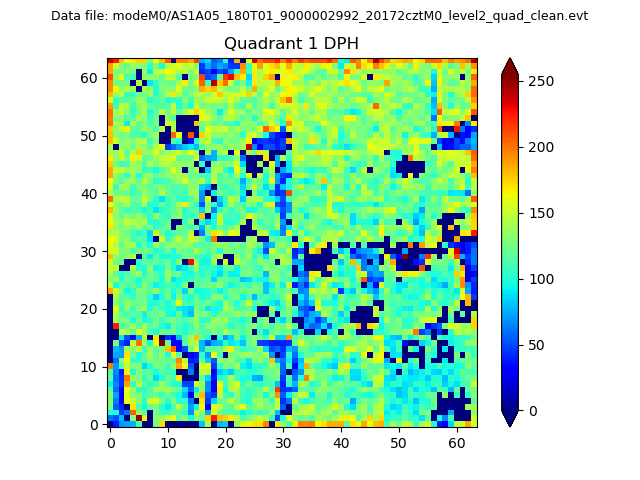 |
Quadrant B |
|---|---|---|---|
| Quadrant D |  |
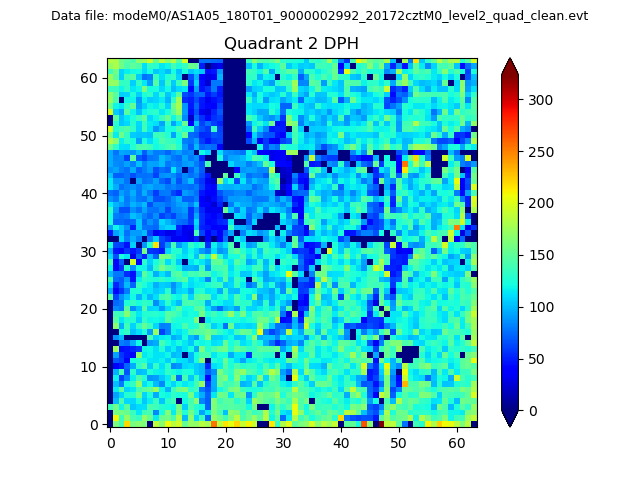 |
Quadrant C |
| Plot type | Count rate plots | Images |
|---|---|---|
| Comparison with Poisson distribution Blue bars denote a histogram of data divided into 1 sec bins. Red curve is a Poisson curve with rate = median count rate of data. |
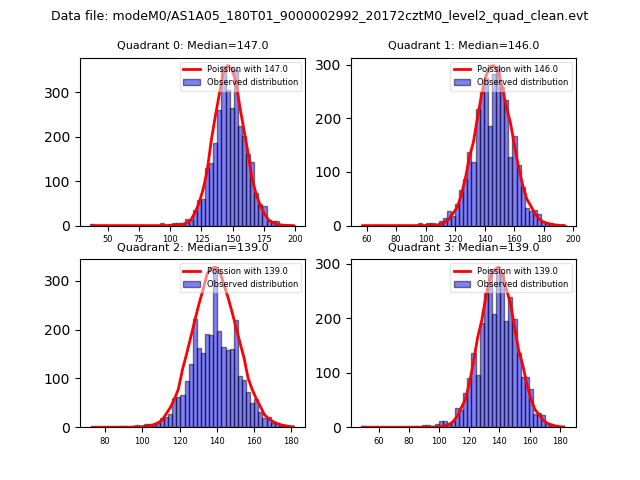 |
 |
| Quadrant-wise count rates Data is divided into 100 sec bins |
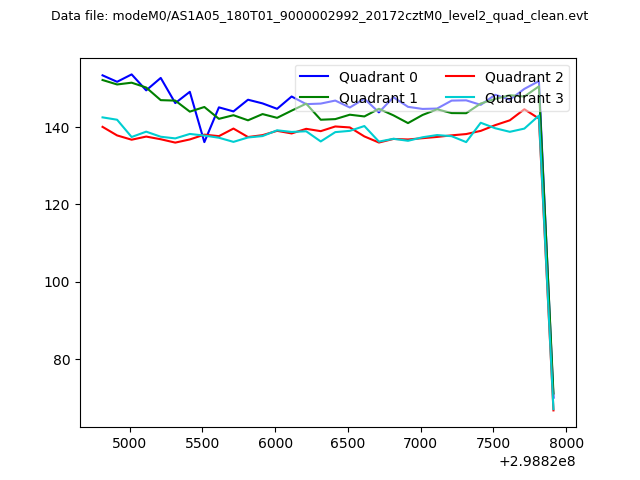 |
|
| Module-wise count rates for Quadrant A Data is divided into 100 sec bins |
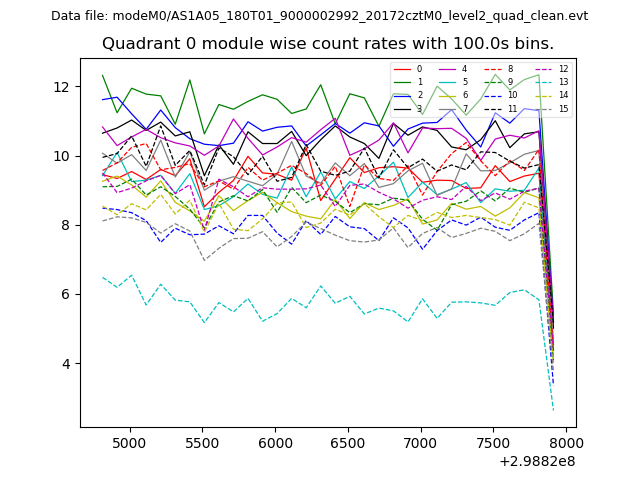 |
 |
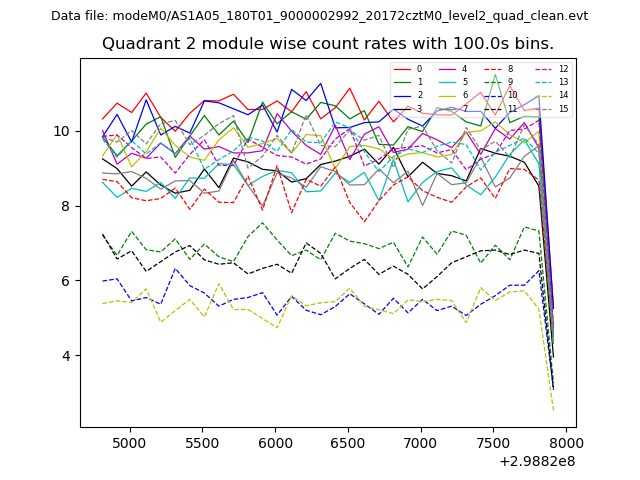
| Module-wise count rates for Quadrant B Data is divided into 100 sec bins |
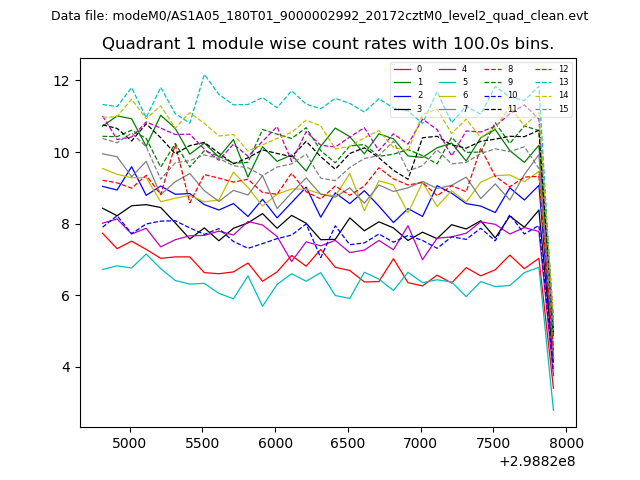 |
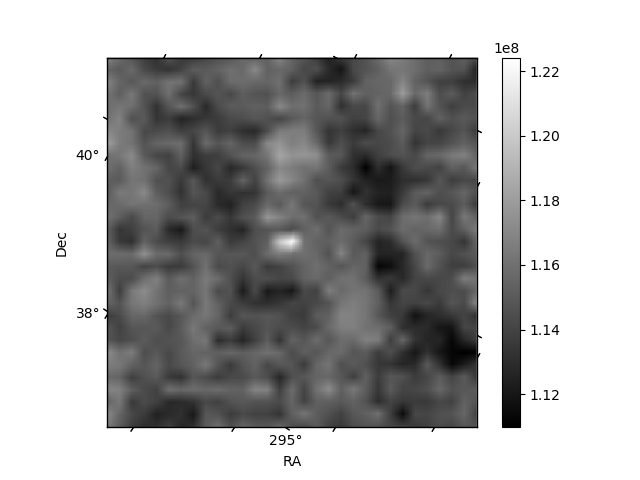 |
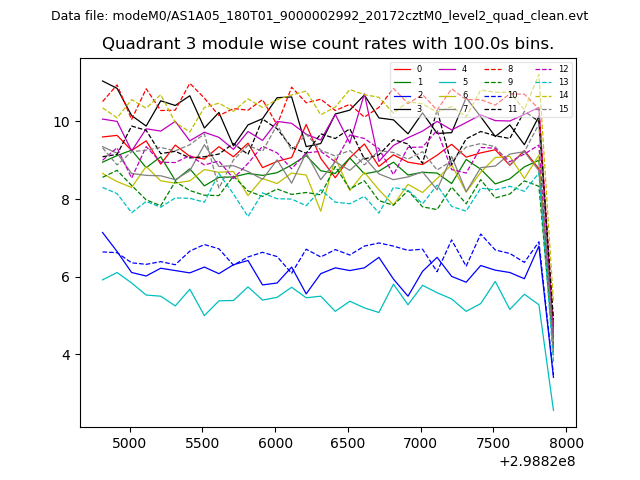
| Module-wise count rates for Quadrant C Data is divided into 100 sec bins |
 |
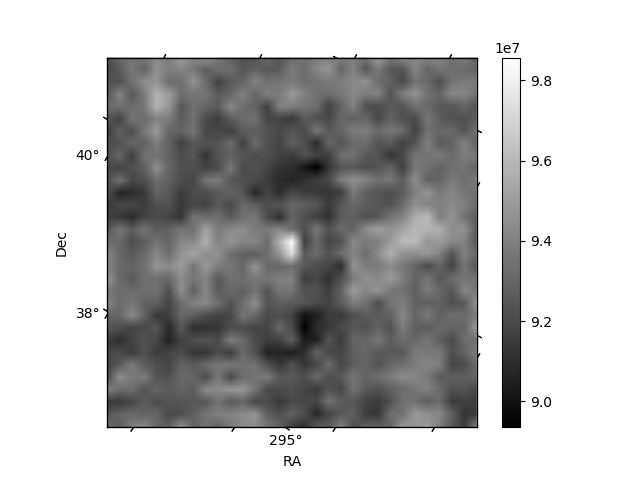 |
| Module-wise count rates for Quadrant D Data is divided into 100 sec bins |
 |
 |
| Parameter | Plot |
|---|---|
| CZT HV Monitor | 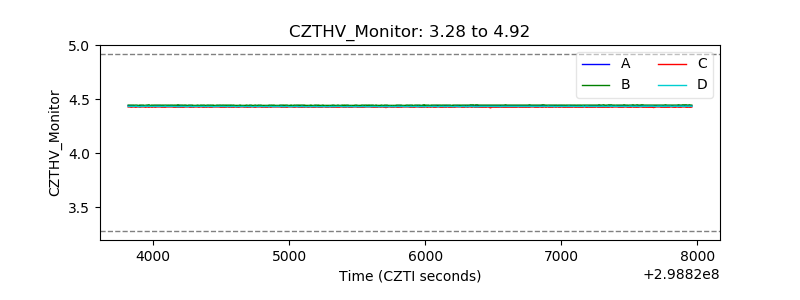 |
| D_VDD | 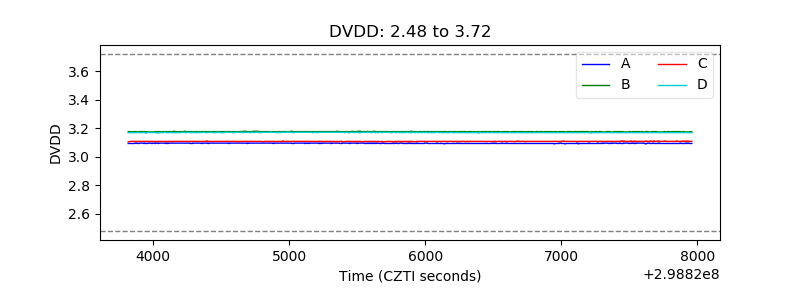 |
| Temperature 1 | 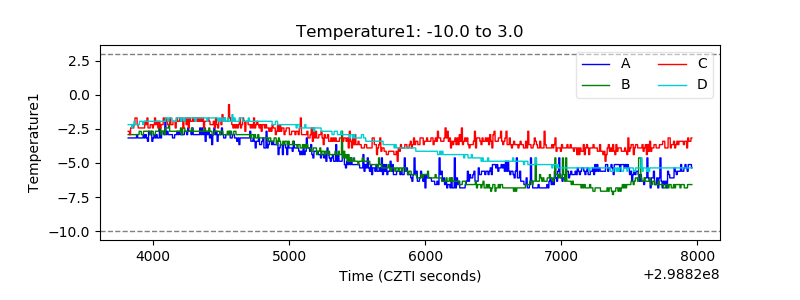 |
| Veto HV Monitor | 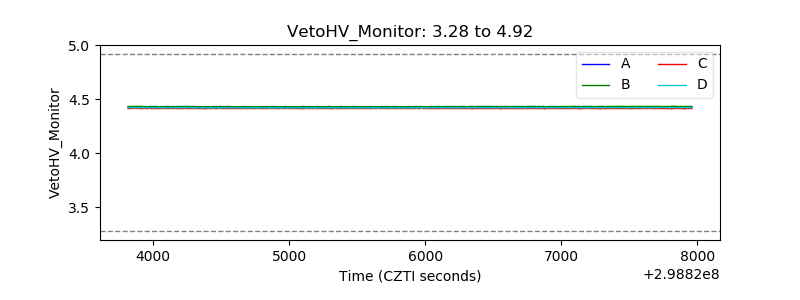 |
| Veto LLD | 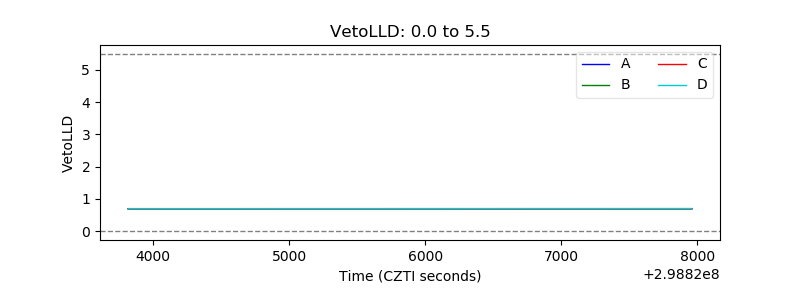 |
| Alpha Counter | 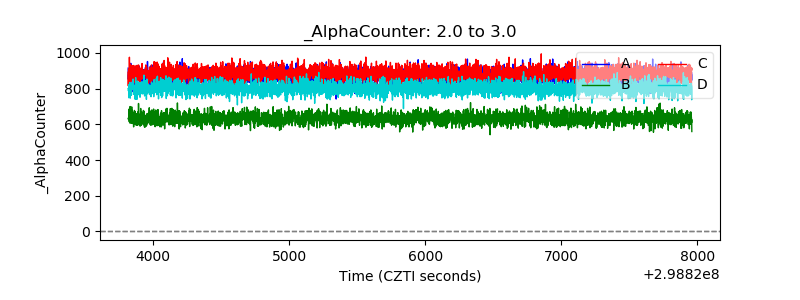 |
| _CPM_Rate | 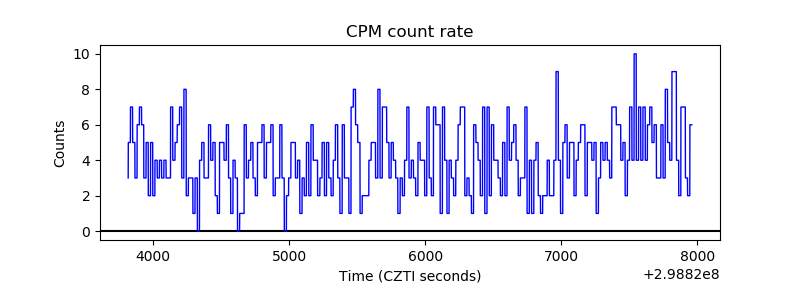 |
| CZT Counter | 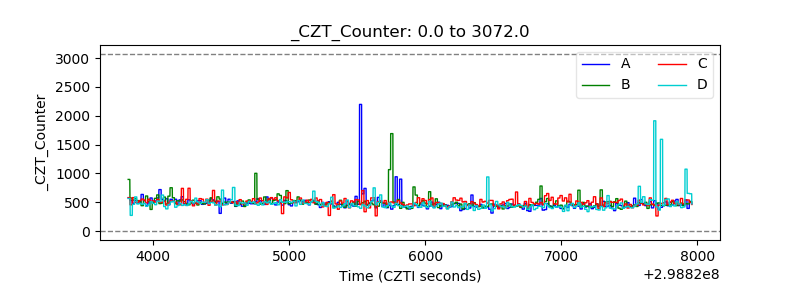 |
| +2.5 Volts monitor |  |
| +5 Volts monitor |  |
| _ROLL_ROT | 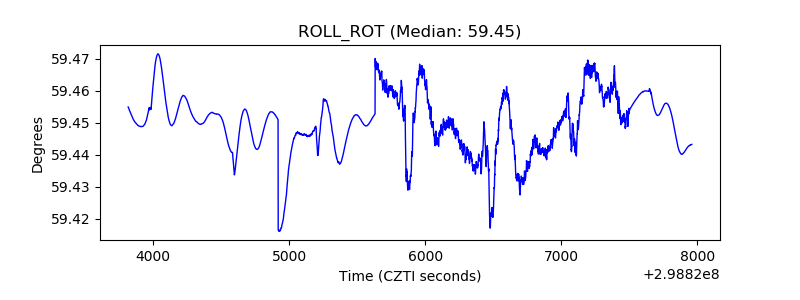 |
| _Roll_DEC | 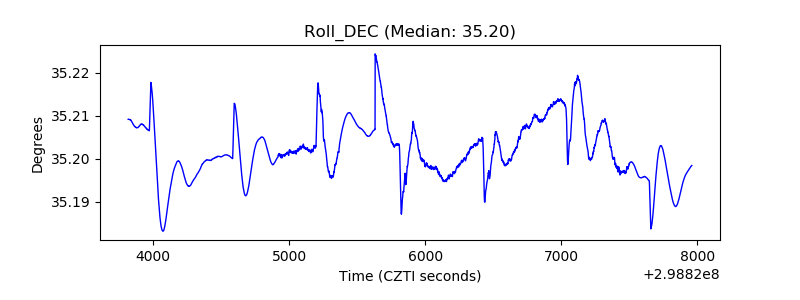 |
| _Roll_RA |  |
| Veto Counter | 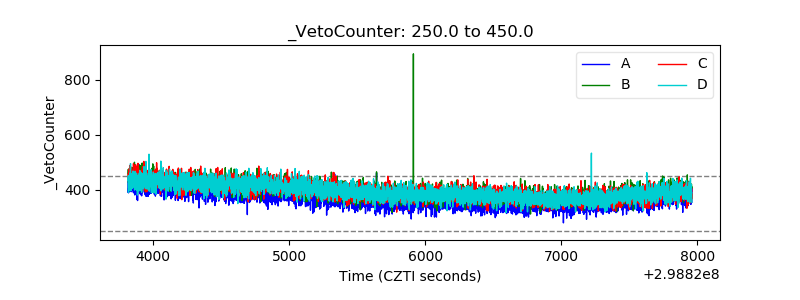 |