| Param | Original file | Final file |
|---|---|---|
| Filename | modeM0/AS1C04_001T01_9000002994_20167cztM0_level2.evt | modeM0/AS1C04_001T01_9000002994_20167cztM0_level2_quad_clean.evt |
| Size (bytes) | 208,693,440 | 39,732,480 |
| Size | 199.0 MB | 37.9 MB |
| Events in quadrant A | 1,260,001 | 274,925 |
| Events in quadrant B | 1,212,646 | 276,841 |
| Events in quadrant C | 1,466,289 | 259,170 |
| Events in quadrant D | 2,227,263 | 229,996 |
| Mode SS | |||
|---|---|---|---|
| Quadrant | BADHDUFLAG | Total packets | Discarded packets |
| A | 0 | 44 | 0 |
| B | 0 | 44 | 0 |
| C | 0 | 44 | 0 |
| D | 0 | 44 | 0 |
| Mode M9 | |||
|---|---|---|---|
| Quadrant | BADHDUFLAG | Total packets | Discarded packets |
| A | 0 | 4 | 0 |
| B | 0 | 4 | 0 |
| C | 0 | 4 | 0 |
| D | 0 | 4 | 0 |
| Mode M0 | |||
|---|---|---|---|
| Quadrant | BADHDUFLAG | Total packets | Discarded packets |
| A | 0 | 5076 | 1 |
| B | 0 | 4956 | 1 |
| C | 0 | 5876 | 1 |
| D | 0 | 8114 | 1 |
| Quadrant | Total seconds | Saturated seconds | Saturation percentage |
|---|---|---|---|
| A | 2248 | 85 | 3.781139% |
| B | 2248 | 95 | 4.225979% |
| C | 2248 | 135 | 6.005338% |
| D | 2248 | 484 | 21.530249% |
Noise dominated data is calculated using 1-second bins in cleaned event files. If a bin has >2000 counts, and if more than 50% of those come from <1% of pixels, then it is considered to be noise-dominated and hence unusable.
| Quadrant | # 1 sec bins | Bins with >0 counts | Bins with >2000 counts | High rate bins dominated by noise | Noise dominated (total time) | Noise dominated (detector-on time) | Marked lightcurve |
|---|---|---|---|---|---|---|---|
| A | 2563 | 2249 | 11 | 11 | 0.43% | 0.49% | 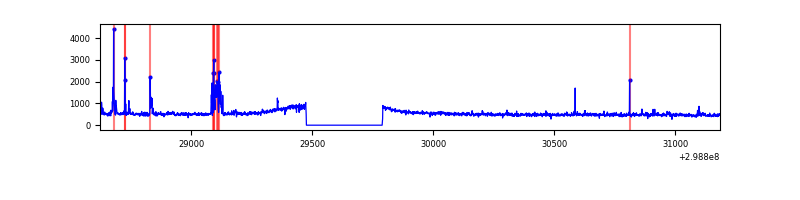 |
| B | 2563 | 2249 | 2 | 2 | 0.08% | 0.09% | 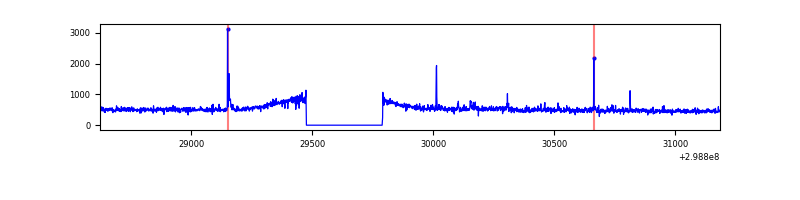 |
| C | 2563 | 2249 | 0 | 0 | 0.00% | 0.00% |  |
| D | 2563 | 2248 | 265 | 265 | 10.34% | 11.79% | 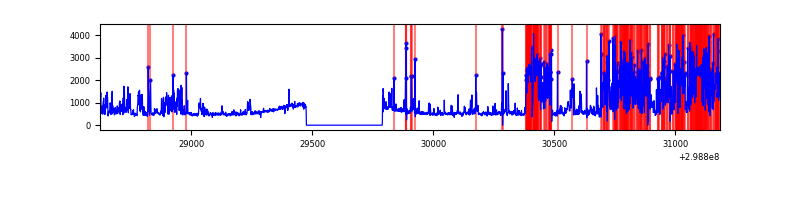 |
Top three noisy pixels from each quadrant. If the there are fewer than three noisy pixels in the level2.evt file, extra rows are filled as -1
| Pixel properties | Quadrant properties | ||||||
|---|---|---|---|---|---|---|---|
| Quadrant | DetID | PixID | Counts | Sigma | Mean | Median | Sigma |
| A | 14 | 238 | 76360 | 1214.76 | 302 | 295 | 62.6 |
| A | 10 | 253 | 7453 | 114.31 | 302 | 295 | 62.6 |
| A | 11 | 29 | 5564 | 84.15 | 302 | 295 | 62.6 |
| B | 3 | 64 | 13090 | 214.6 | 297 | 288 | 59.7 |
| B | 0 | 190 | 12532 | 205.25 | 297 | 288 | 59.7 |
| B | 12 | 111 | 6822 | 109.53 | 297 | 288 | 59.7 |
| C | 3 | 233 | 301997 | 4439.02 | 286 | 285 | 68.0 |
| C | 14 | 238 | 43372 | 633.93 | 286 | 285 | 68.0 |
| C | 8 | 128 | 3324 | 44.71 | 286 | 285 | 68.0 |
| D | 12 | 218 | 634550 | 9301.35 | 274 | 264 | 68.2 |
| D | 7 | 38 | 191873 | 2809.81 | 274 | 264 | 68.2 |
| D | 1 | 52 | 156868 | 2296.48 | 274 | 264 | 68.2 |
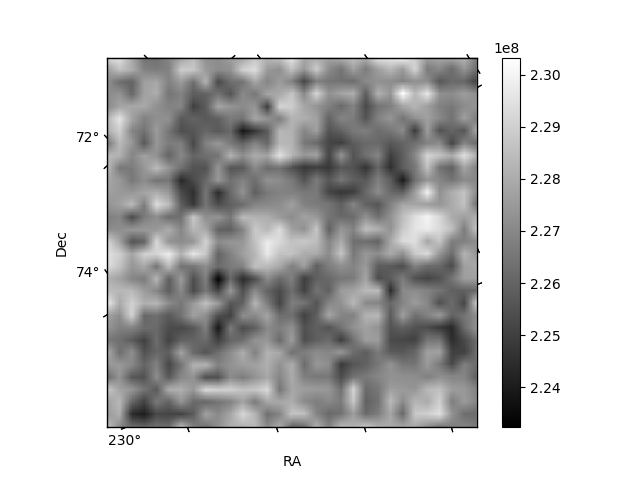
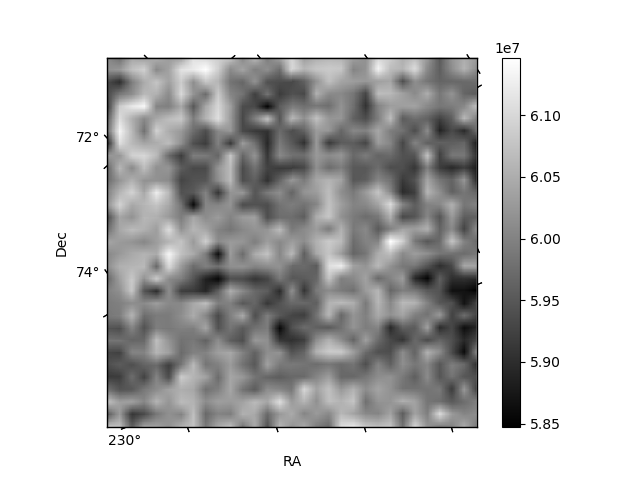
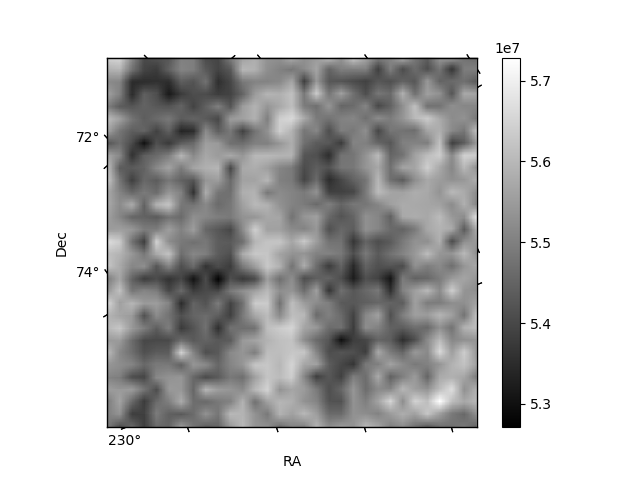
Histogram calculated using DETX and DETY for each event in the final _common_clean file
| Quadrant A | 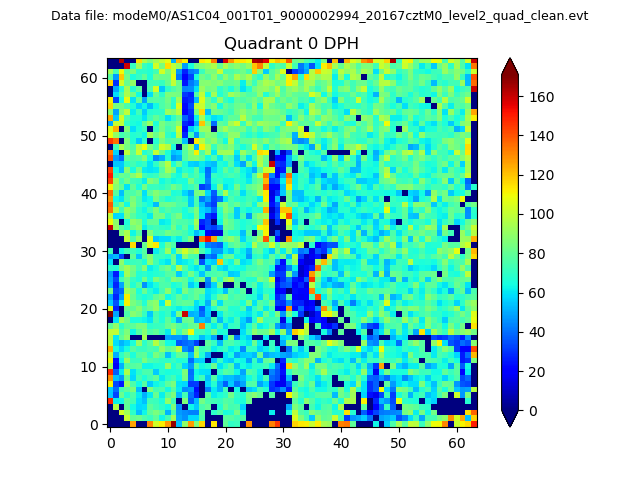 |
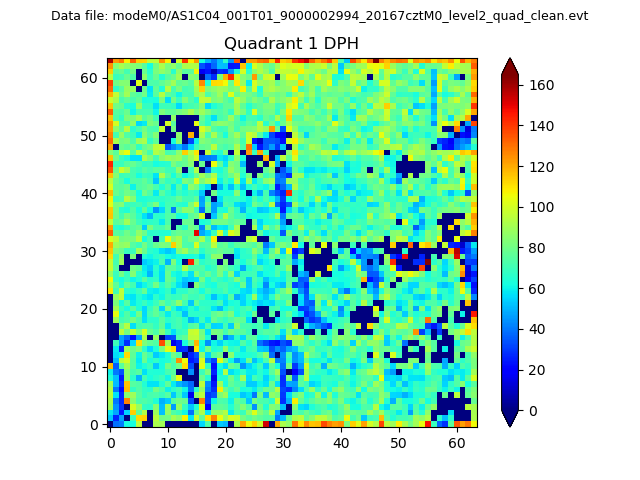 |
Quadrant B |
|---|---|---|---|
| Quadrant D |  |
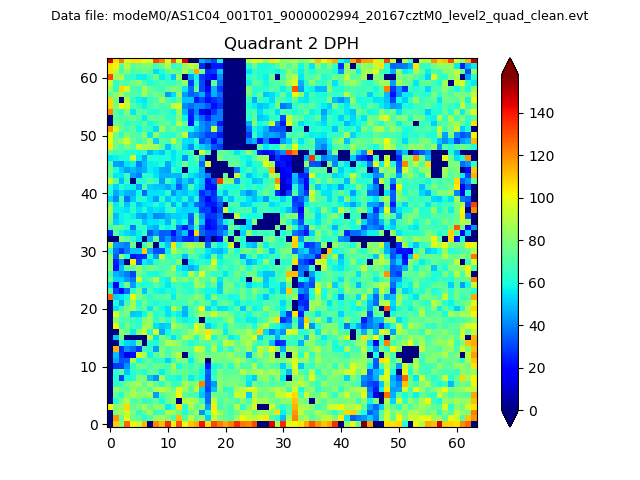 |
Quadrant C |
| Plot type | Count rate plots | Images |
|---|---|---|
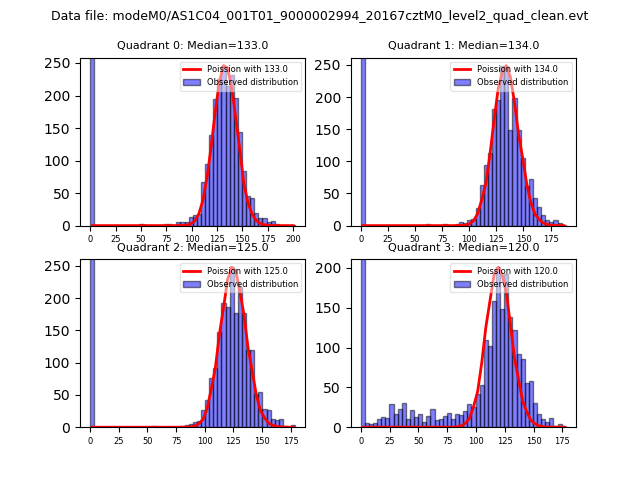
| Comparison with Poisson distribution Blue bars denote a histogram of data divided into 1 sec bins. Red curve is a Poisson curve with rate = median count rate of data. |
 |
 |
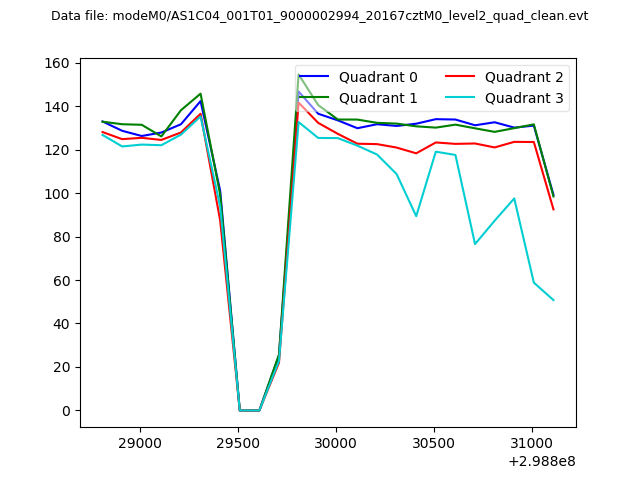
| Quadrant-wise count rates Data is divided into 100 sec bins |
 |
|
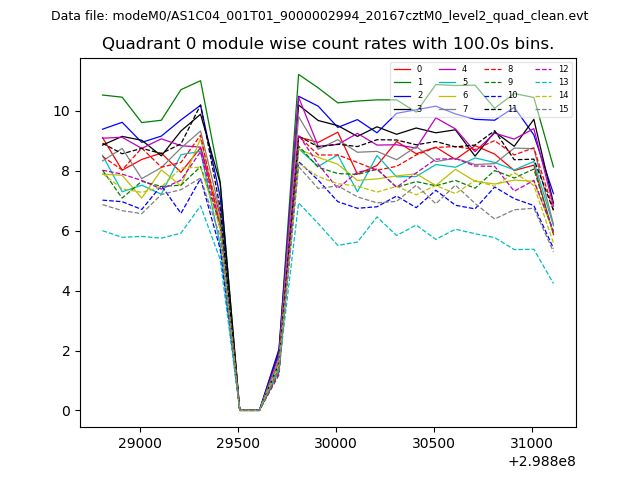
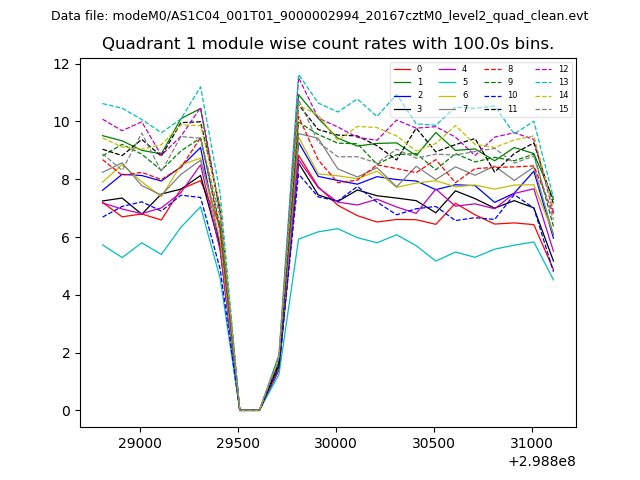
| Module-wise count rates for Quadrant A Data is divided into 100 sec bins |
 |
 |
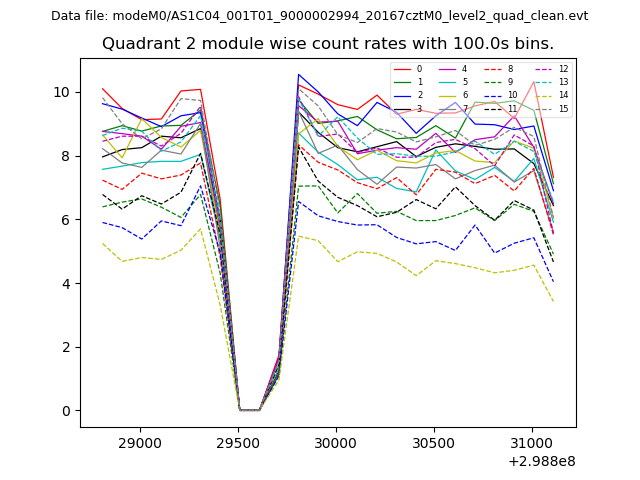
| Module-wise count rates for Quadrant B Data is divided into 100 sec bins |
 |
 |
| Module-wise count rates for Quadrant C Data is divided into 100 sec bins |
 |
 |
| Module-wise count rates for Quadrant D Data is divided into 100 sec bins |
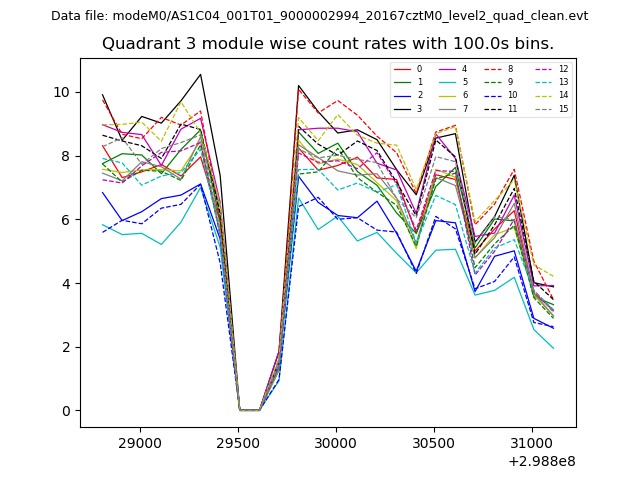 |
 |
| Parameter | Plot |
|---|---|
| CZT HV Monitor | 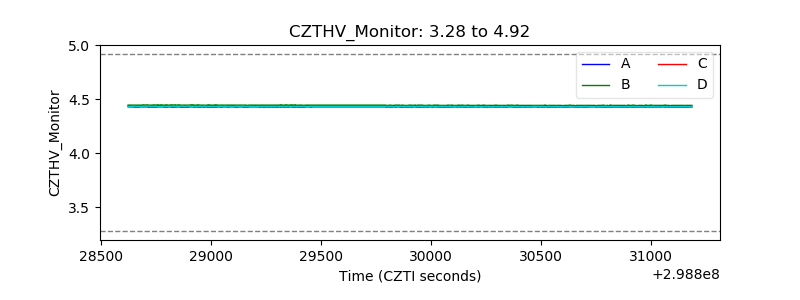 |
| D_VDD | 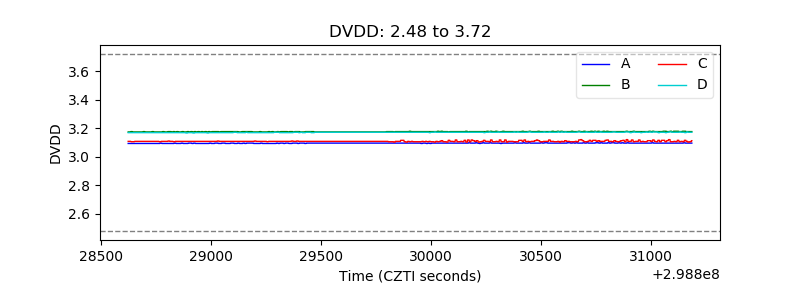 |
| Temperature 1 | 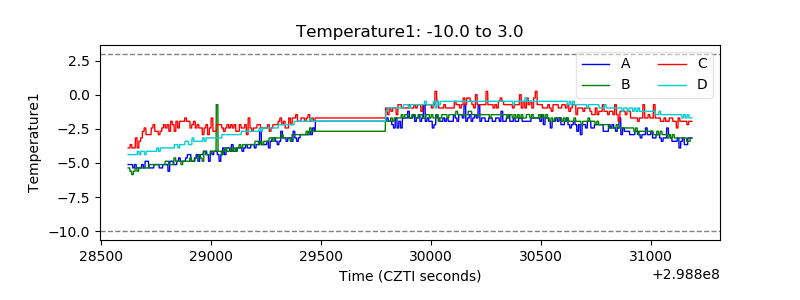 |
| Veto HV Monitor | 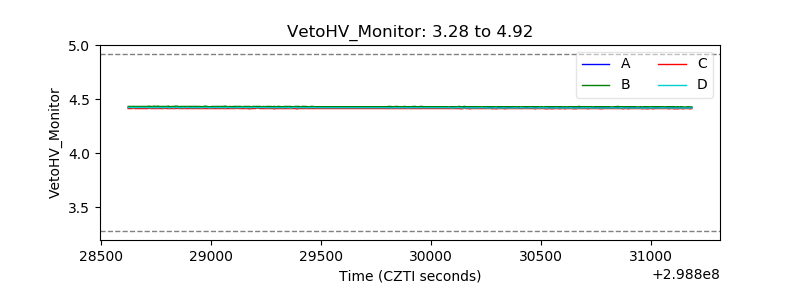 |
| Veto LLD |  |
| Alpha Counter | 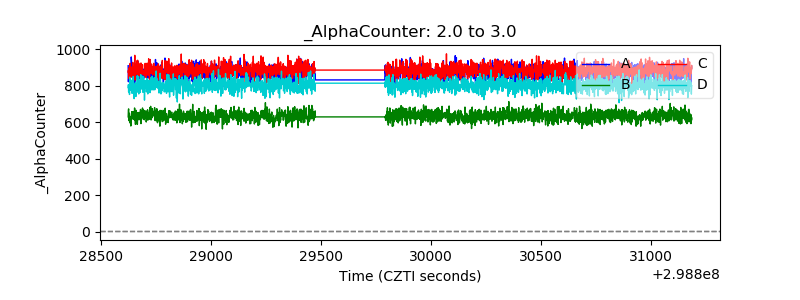 |
| _CPM_Rate | 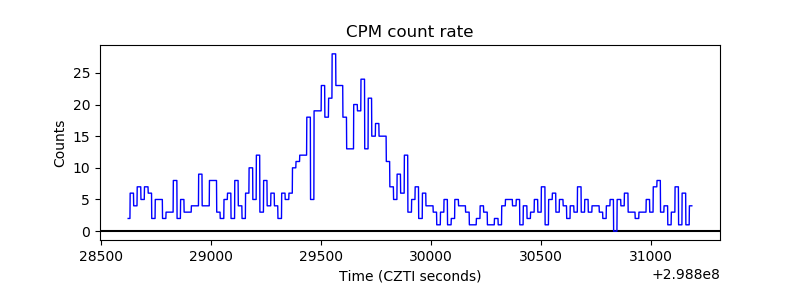 |
| CZT Counter | 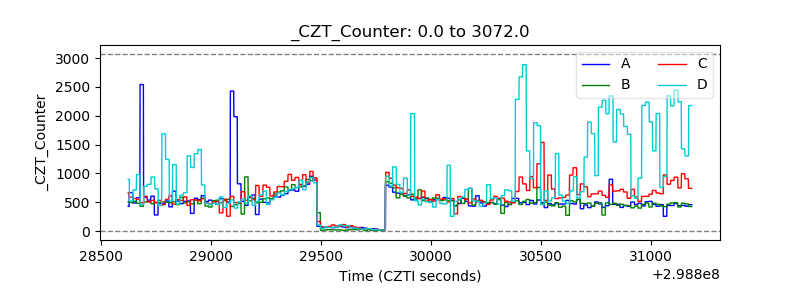 |
| +2.5 Volts monitor |  |
| +5 Volts monitor |  |
| _ROLL_ROT | 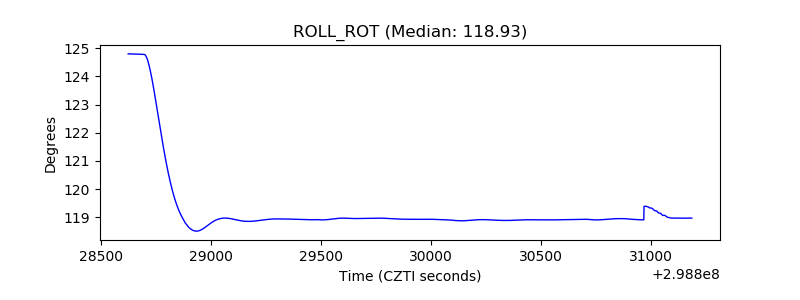 |
| _Roll_DEC | 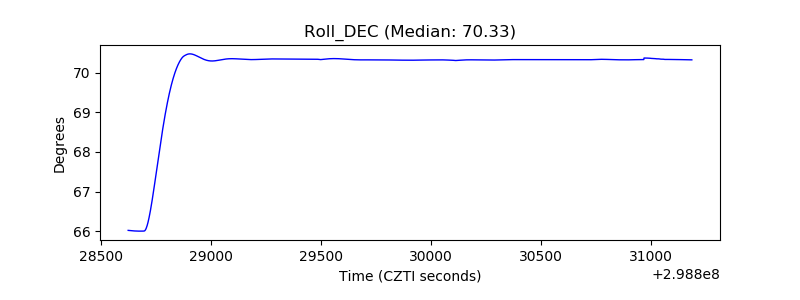 |
| _Roll_RA | 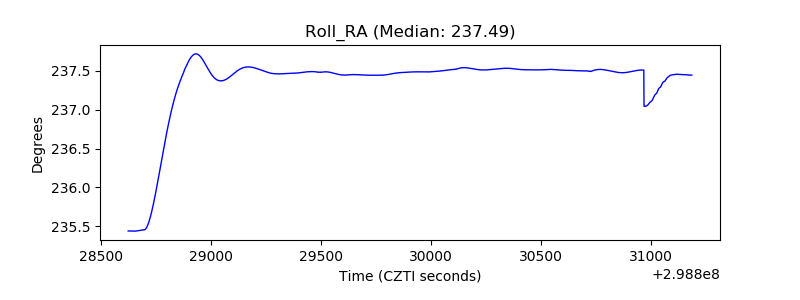 |
| Veto Counter | 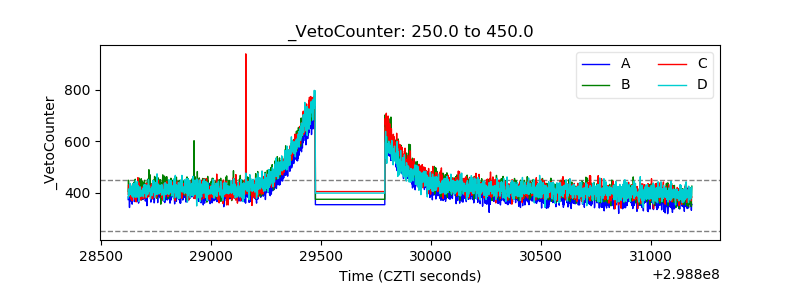 |