| Param | Original file | Final file |
|---|---|---|
| Filename | modeM0/AS1C04_001T01_9000002994_20172cztM0_level2.evt | modeM0/AS1C04_001T01_9000002994_20172cztM0_level2_quad_clean.evt |
| Size (bytes) | 2,557,537,920 | 511,220,160 |
| Size | 2.4 GB | 487.5 MB |
| Events in quadrant A | 18,557,358 | 3,401,043 |
| Events in quadrant B | 14,464,408 | 3,572,736 |
| Events in quadrant C | 15,300,792 | 3,495,631 |
| Events in quadrant D | 27,201,951 | 3,044,105 |
| Mode SS | |||
|---|---|---|---|
| Quadrant | BADHDUFLAG | Total packets | Discarded packets |
| A | 0 | 580 | 0 |
| B | 0 | 580 | 0 |
| C | 0 | 580 | 0 |
| D | 0 | 580 | 0 |
| Mode M9 | |||
|---|---|---|---|
| Quadrant | BADHDUFLAG | Total packets | Discarded packets |
| A | 0 | 35 | 0 |
| B | 0 | 35 | 0 |
| C | 0 | 35 | 0 |
| D | 0 | 35 | 0 |
| Mode M0 | |||
|---|---|---|---|
| Quadrant | BADHDUFLAG | Total packets | Discarded packets |
| A | 0 | 74857 | 13 |
| B | 0 | 62558 | 6 |
| C | 0 | 64547 | 6 |
| D | 0 | 100840 | 7 |
| Quadrant | Total seconds | Saturated seconds | Saturation percentage |
|---|---|---|---|
| A | 28652 | 2616 | 9.130253% |
| B | 28653 | 526 | 1.835759% |
| C | 28653 | 506 | 1.765958% |
| D | 28652 | 5401 | 18.850342% |
Noise dominated data is calculated using 1-second bins in cleaned event files. If a bin has >2000 counts, and if more than 50% of those come from <1% of pixels, then it is considered to be noise-dominated and hence unusable.
| Quadrant | # 1 sec bins | Bins with >0 counts | Bins with >2000 counts | High rate bins dominated by noise | Noise dominated (total time) | Noise dominated (detector-on time) | Marked lightcurve |
|---|---|---|---|---|---|---|---|
| A | 34137 | 28655 | 1509 | 1509 | 4.42% | 5.27% | 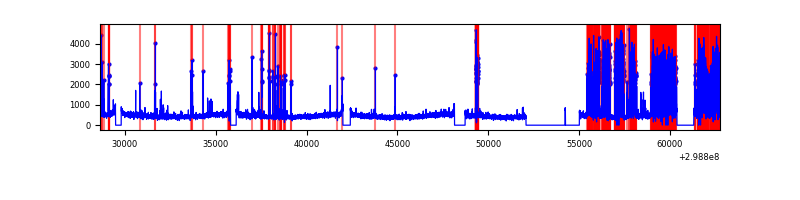 |
| B | 34137 | 28660 | 78 | 78 | 0.23% | 0.27% | 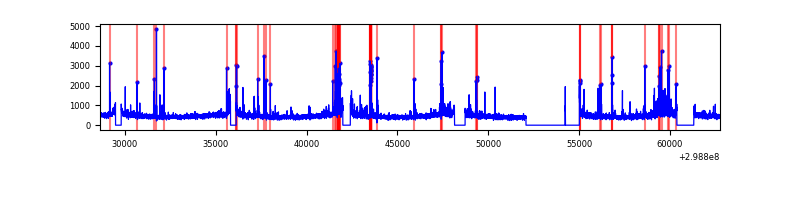 |
| C | 34137 | 28660 | 0 | 0 | 0.00% | 0.00% | 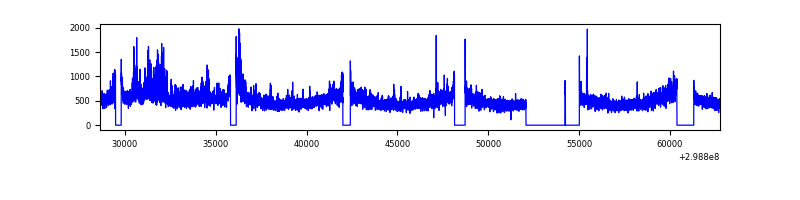 |
| D | 34137 | 28658 | 4422 | 4422 | 12.95% | 15.43% | 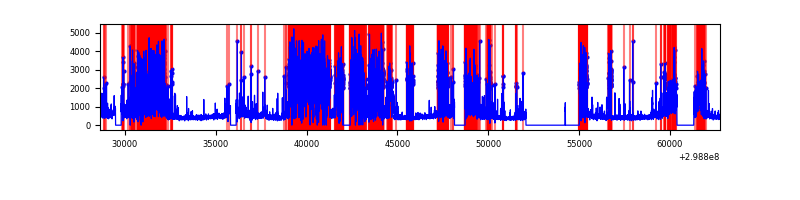 |
Top three noisy pixels from each quadrant. If the there are fewer than three noisy pixels in the level2.evt file, extra rows are filled as -1
| Pixel properties | Quadrant properties | ||||||
|---|---|---|---|---|---|---|---|
| Quadrant | DetID | PixID | Counts | Sigma | Mean | Median | Sigma |
| A | 14 | 238 | 5919025 | 9185.3 | 3213 | 3142 | 644.1 |
| A | 9 | 143 | 173623 | 264.7 | 3213 | 3142 | 644.1 |
| A | 11 | 29 | 44848 | 64.75 | 3213 | 3142 | 644.1 |
| B | 7 | 220 | 504809 | 795.58 | 3347 | 3258 | 630.4 |
| B | 0 | 197 | 157477 | 244.63 | 3347 | 3258 | 630.4 |
| B | 0 | 189 | 126248 | 195.09 | 3347 | 3258 | 630.4 |
| C | 3 | 233 | 2139113 | 2844.17 | 3243 | 3263 | 751.0 |
| C | 14 | 238 | 502284 | 664.51 | 3243 | 3263 | 751.0 |
| C | 13 | 61 | 22517 | 25.64 | 3243 | 3263 | 751.0 |
| D | 1 | 52 | 10485248 | 14711.17 | 2965 | 2883 | 712.5 |
| D | 12 | 218 | 2115056 | 2964.27 | 2965 | 2883 | 712.5 |
| D | 7 | 238 | 871967 | 1219.69 | 2965 | 2883 | 712.5 |
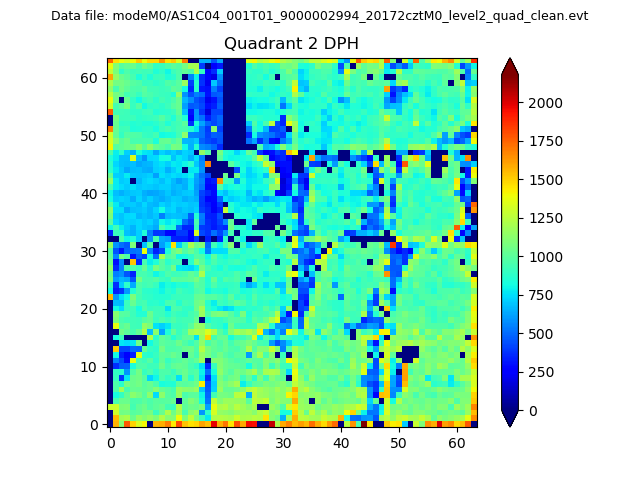
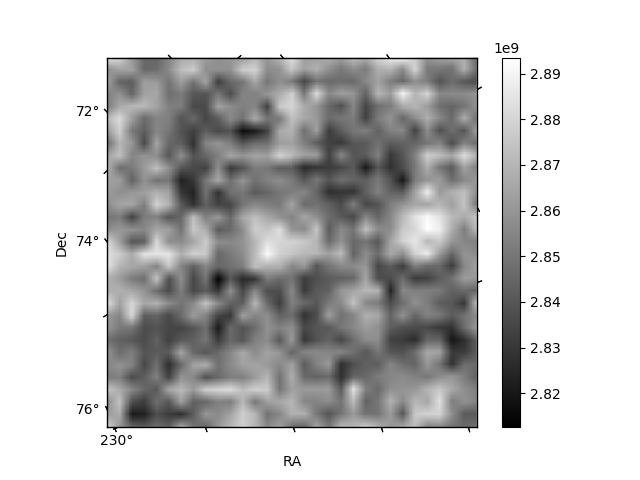
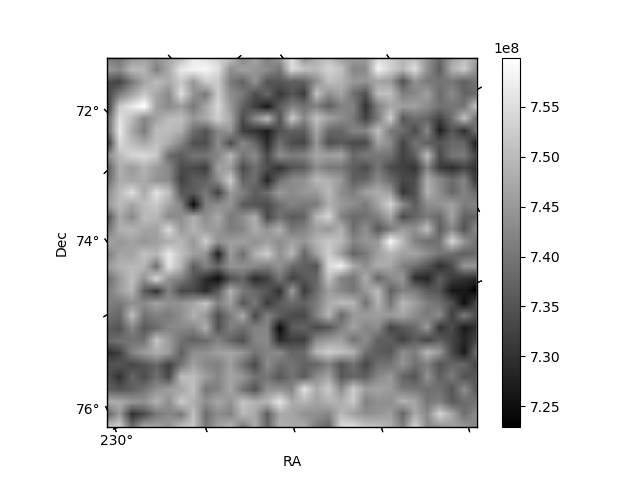
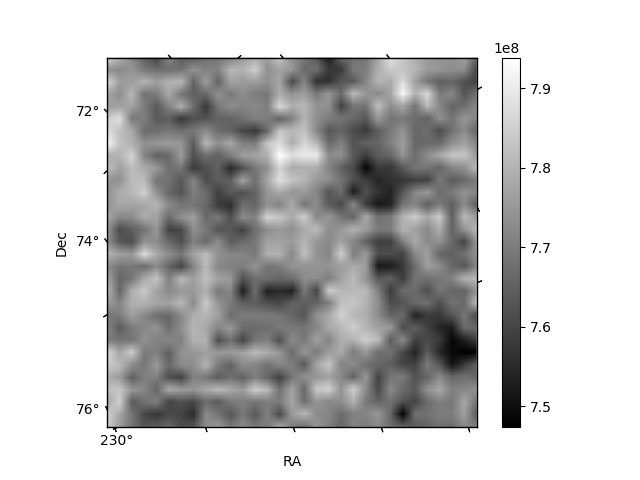
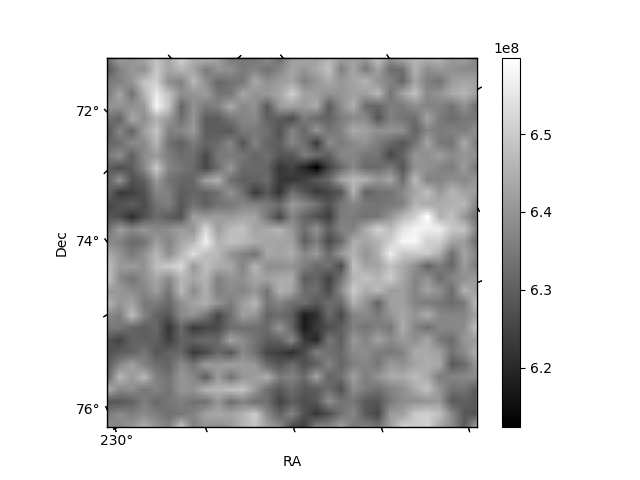
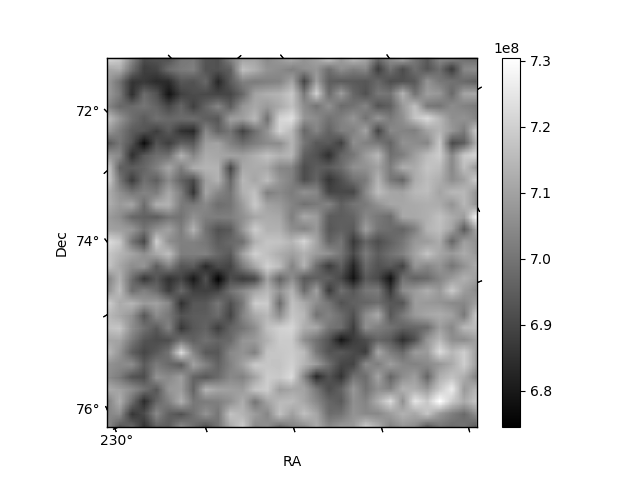
Histogram calculated using DETX and DETY for each event in the final _common_clean file
| Quadrant A | 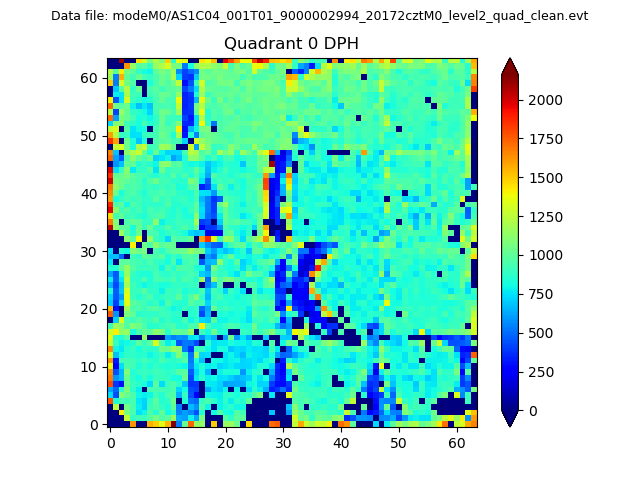 |
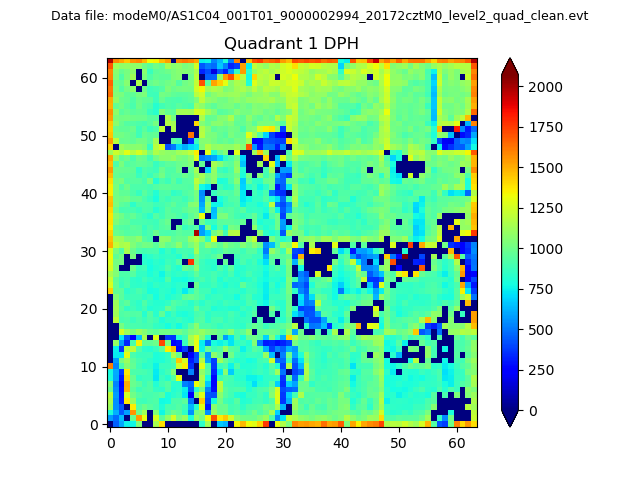 |
Quadrant B |
|---|---|---|---|
| Quadrant D | 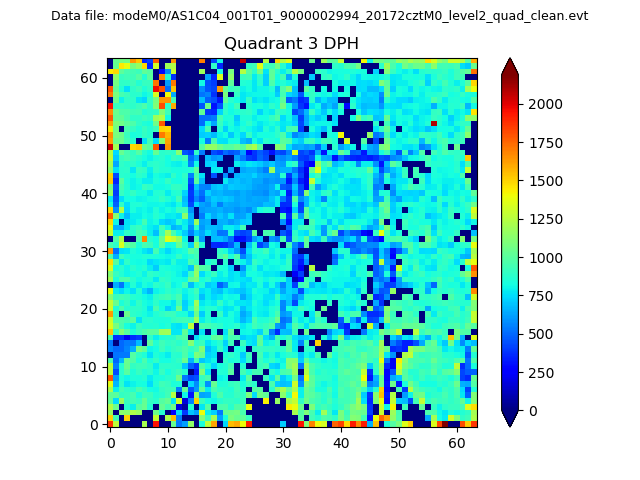 |
 |
Quadrant C |
| Plot type | Count rate plots | Images |
|---|---|---|
| Comparison with Poisson distribution Blue bars denote a histogram of data divided into 1 sec bins. Red curve is a Poisson curve with rate = median count rate of data. |
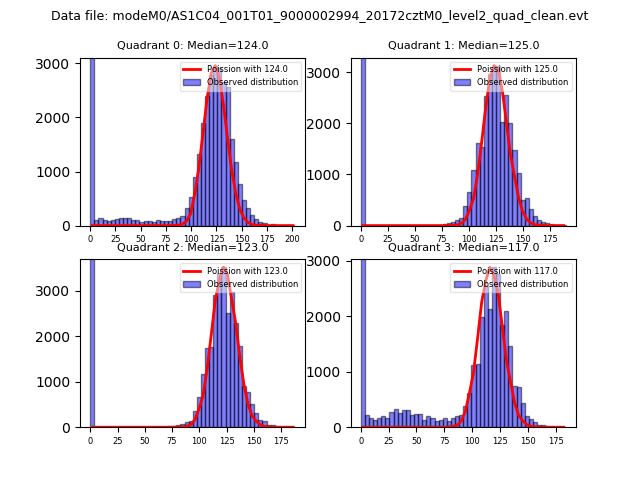 |
 |
| Quadrant-wise count rates Data is divided into 100 sec bins |
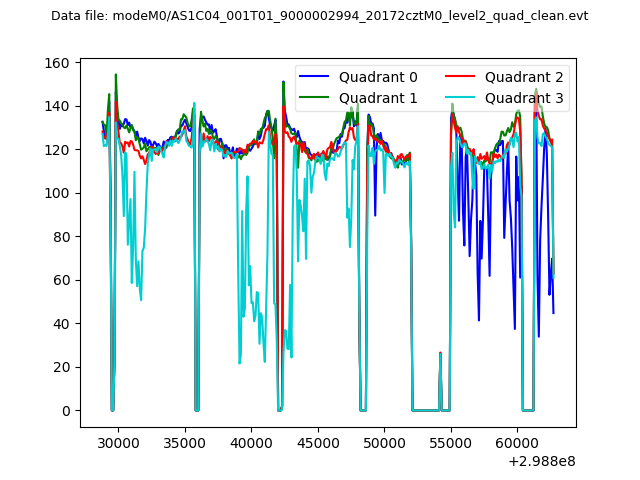 |
|
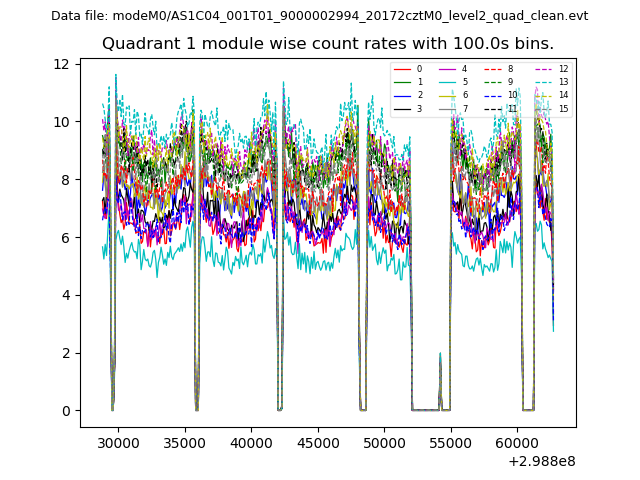
| Module-wise count rates for Quadrant A Data is divided into 100 sec bins |
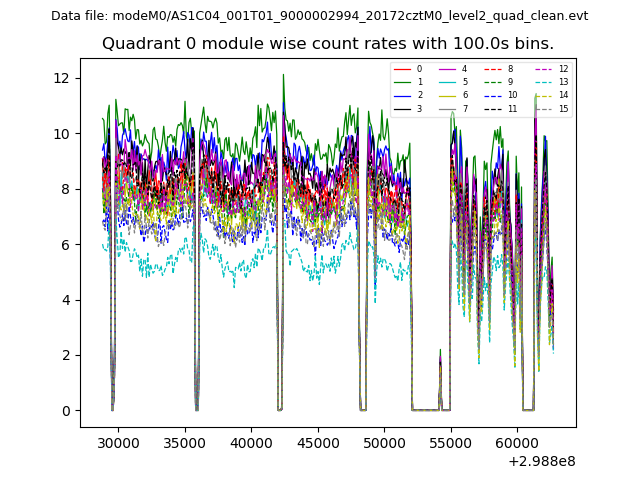 |
 |
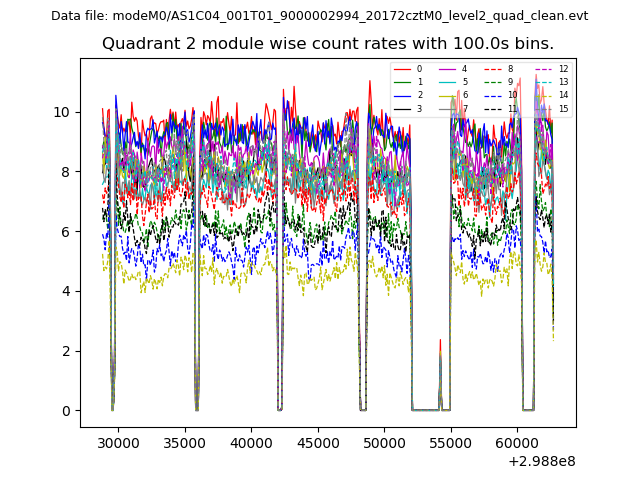
| Module-wise count rates for Quadrant B Data is divided into 100 sec bins |
 |
 |
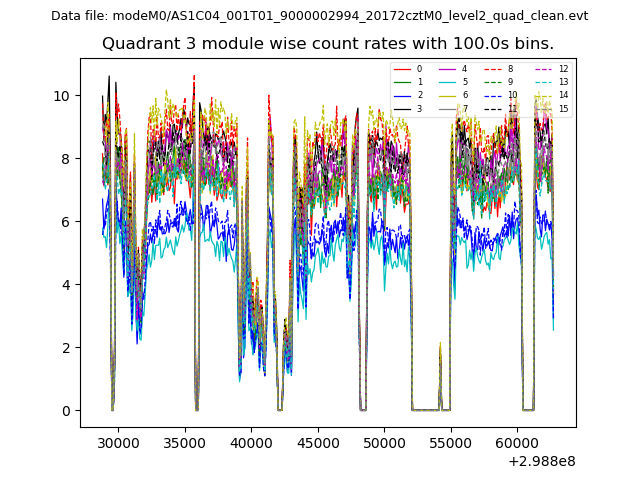
| Module-wise count rates for Quadrant C Data is divided into 100 sec bins |
 |
 |
| Module-wise count rates for Quadrant D Data is divided into 100 sec bins |
 |
 |
| Parameter | Plot |
|---|---|
| CZT HV Monitor | 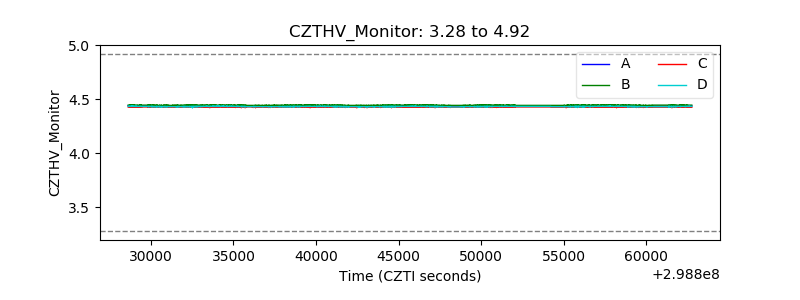 |
| D_VDD | 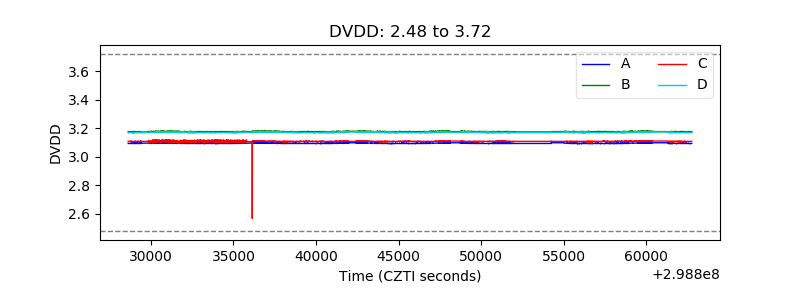 |
| Temperature 1 | 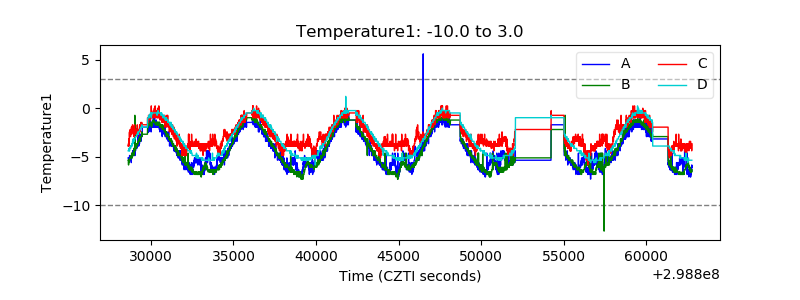 |
| Veto HV Monitor | 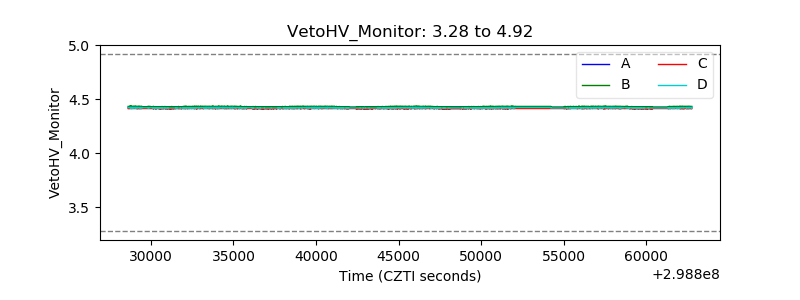 |
| Veto LLD | 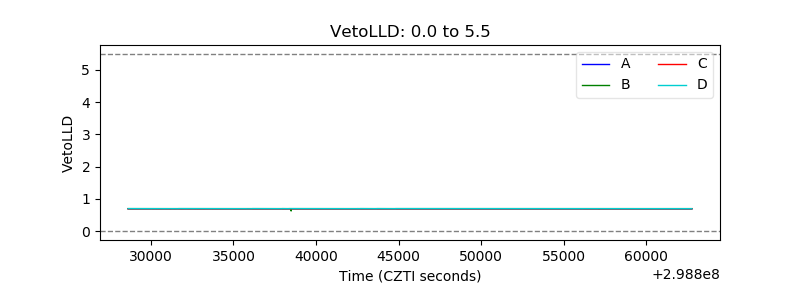 |
| Alpha Counter | 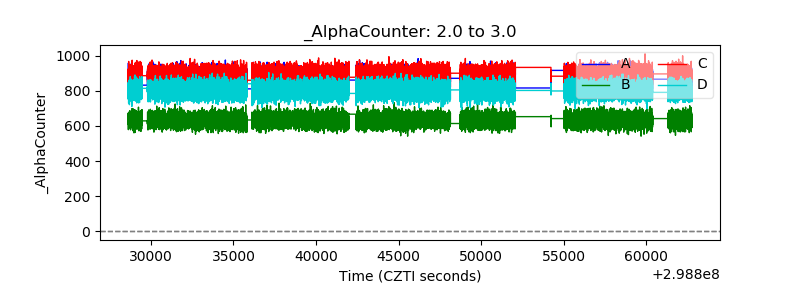 |
| _CPM_Rate | 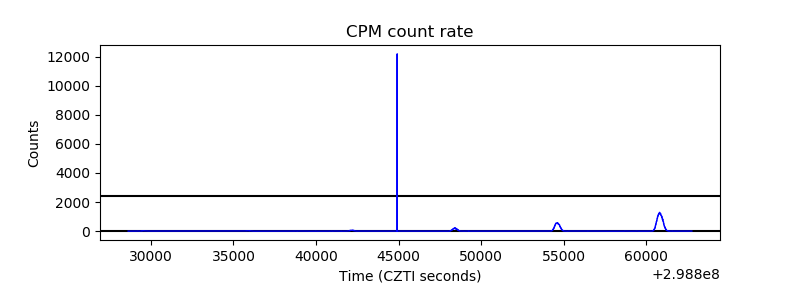 |
| CZT Counter | 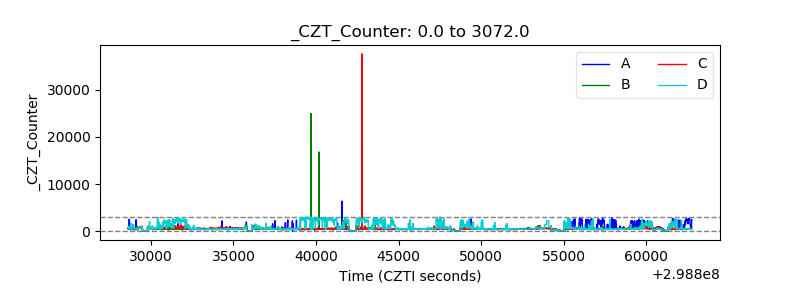 |
| +2.5 Volts monitor |  |
| +5 Volts monitor |  |
| _ROLL_ROT | 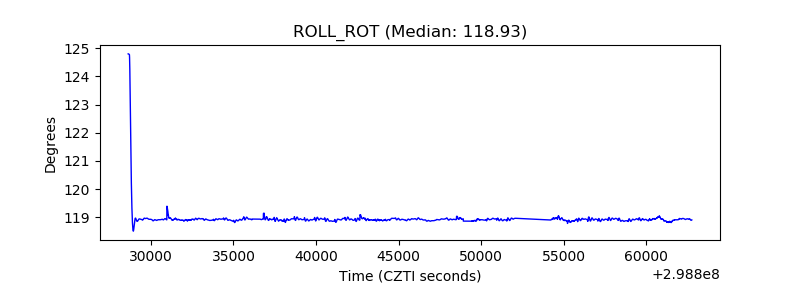 |
| _Roll_DEC | 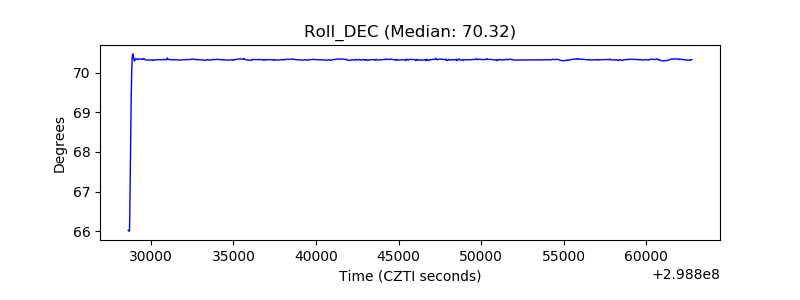 |
| _Roll_RA | 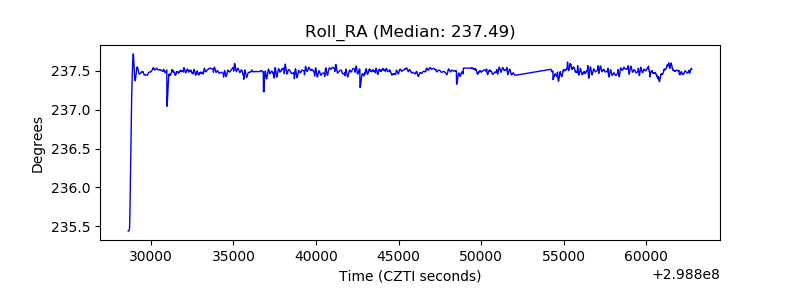 |
| Veto Counter | 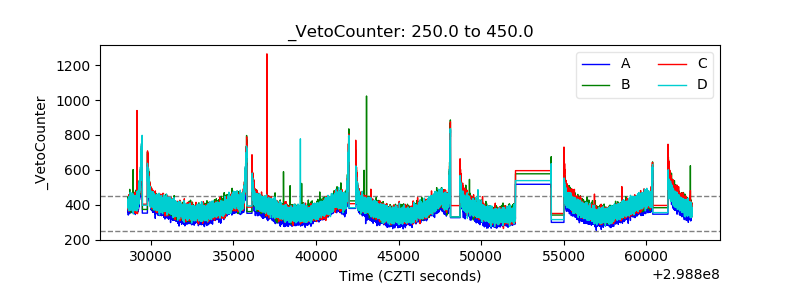 |