| Param | Original file | Final file |
|---|---|---|
| Filename | modeM0/AS1C04_001T01_9000002994_20173cztM0_level2.evt | modeM0/AS1C04_001T01_9000002994_20173cztM0_level2_quad_clean.evt |
| Size (bytes) | 1,416,608,640 | 275,463,360 |
| Size | 1.3 GB | 262.7 MB |
| Events in quadrant A | 15,857,023 | 1,646,979 |
| Events in quadrant B | 7,767,480 | 1,943,470 |
| Events in quadrant C | 7,728,724 | 1,891,089 |
| Events in quadrant D | 10,522,466 | 1,810,920 |
| Mode SS | |||
|---|---|---|---|
| Quadrant | BADHDUFLAG | Total packets | Discarded packets |
| A | 0 | 308 | 0 |
| B | 0 | 308 | 0 |
| C | 0 | 308 | 0 |
| D | 0 | 308 | 0 |
| Mode M9 | |||
|---|---|---|---|
| Quadrant | BADHDUFLAG | Total packets | Discarded packets |
| A | 0 | 29 | 0 |
| B | 0 | 29 | 0 |
| C | 0 | 29 | 0 |
| D | 0 | 29 | 0 |
| Mode M0 | |||
|---|---|---|---|
| Quadrant | BADHDUFLAG | Total packets | Discarded packets |
| A | 0 | 57489 | 4 |
| B | 0 | 33311 | 3 |
| C | 0 | 33180 | 3 |
| D | 0 | 42011 | 3 |
| Quadrant | Total seconds | Saturated seconds | Saturation percentage |
|---|---|---|---|
| A | 15218 | 3837 | 25.213563% |
| B | 15219 | 148 | 0.972469% |
| C | 15219 | 193 | 1.268152% |
| D | 15219 | 837 | 5.499704% |
Noise dominated data is calculated using 1-second bins in cleaned event files. If a bin has >2000 counts, and if more than 50% of those come from <1% of pixels, then it is considered to be noise-dominated and hence unusable.
| Quadrant | # 1 sec bins | Bins with >0 counts | Bins with >2000 counts | High rate bins dominated by noise | Noise dominated (total time) | Noise dominated (detector-on time) | Marked lightcurve |
|---|---|---|---|---|---|---|---|
| A | 17988 | 15217 | 2466 | 2466 | 13.71% | 16.21% | 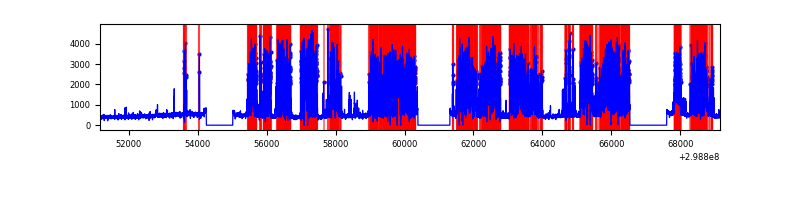 |
| B | 17989 | 15222 | 23 | 23 | 0.13% | 0.15% | 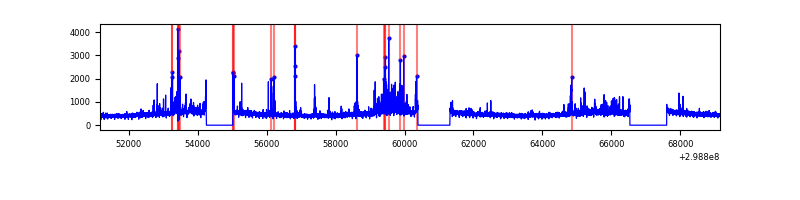 |
| C | 17989 | 15222 | 26 | 26 | 0.14% | 0.17% | 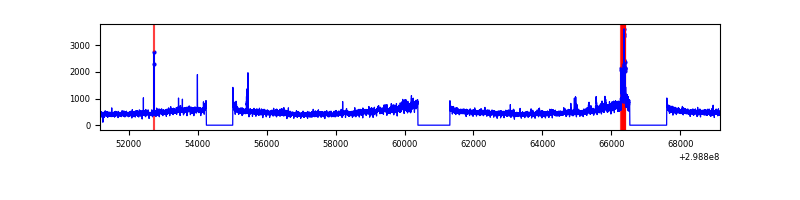 |
| D | 17989 | 15222 | 658 | 658 | 3.66% | 4.32% | 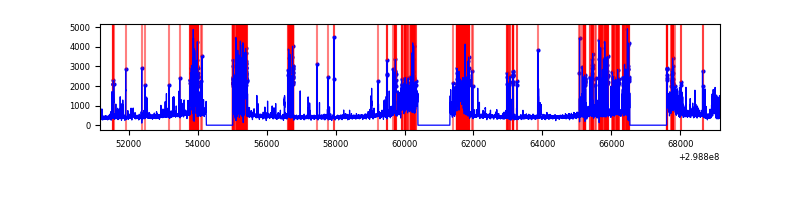 |
Top three noisy pixels from each quadrant. If the there are fewer than three noisy pixels in the level2.evt file, extra rows are filled as -1
| Pixel properties | Quadrant properties | ||||||
|---|---|---|---|---|---|---|---|
| Quadrant | DetID | PixID | Counts | Sigma | Mean | Median | Sigma |
| A | 14 | 238 | 9820508 | 31466.55 | 1559 | 1524 | 312.0 |
| A | 13 | 254 | 16233 | 47.14 | 1559 | 1524 | 312.0 |
| A | 15 | 191 | 15520 | 44.85 | 1559 | 1524 | 312.0 |
| B | 7 | 220 | 333182 | 981.32 | 1785 | 1739 | 337.8 |
| B | 4 | 80 | 115779 | 337.64 | 1785 | 1739 | 337.8 |
| B | 0 | 189 | 100844 | 293.43 | 1785 | 1739 | 337.8 |
| C | 3 | 233 | 760952 | 1914.56 | 1716 | 1728 | 396.6 |
| C | 14 | 238 | 269670 | 675.68 | 1716 | 1728 | 396.6 |
| C | 13 | 61 | 11965 | 25.81 | 1716 | 1728 | 396.6 |
| D | 1 | 52 | 2000010 | 4888.69 | 1706 | 1657 | 408.8 |
| D | 1 | 20 | 640977 | 1564.01 | 1706 | 1657 | 408.8 |
| D | 7 | 238 | 407779 | 993.52 | 1706 | 1657 | 408.8 |
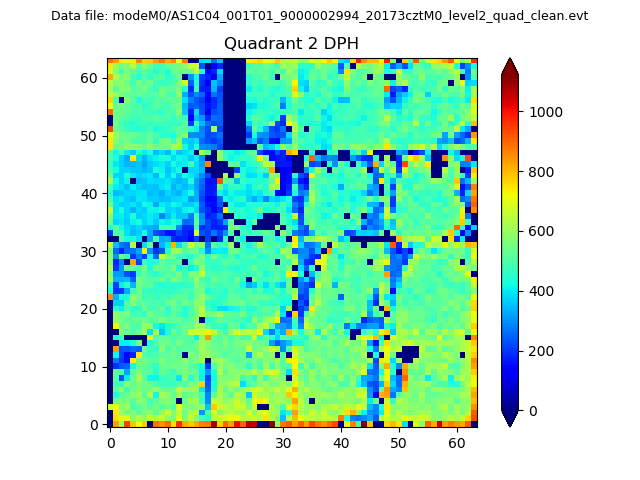
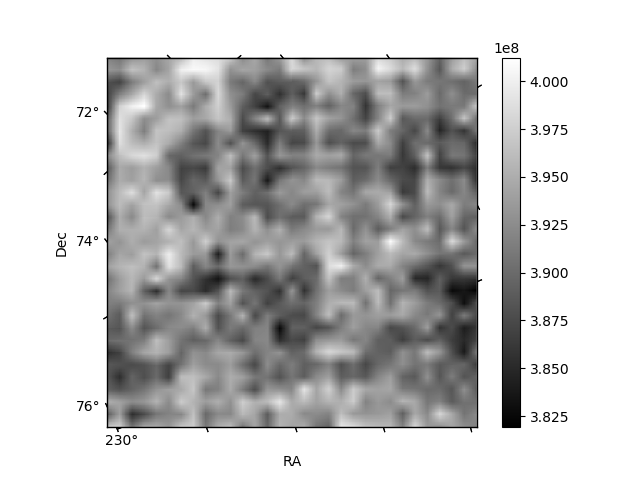
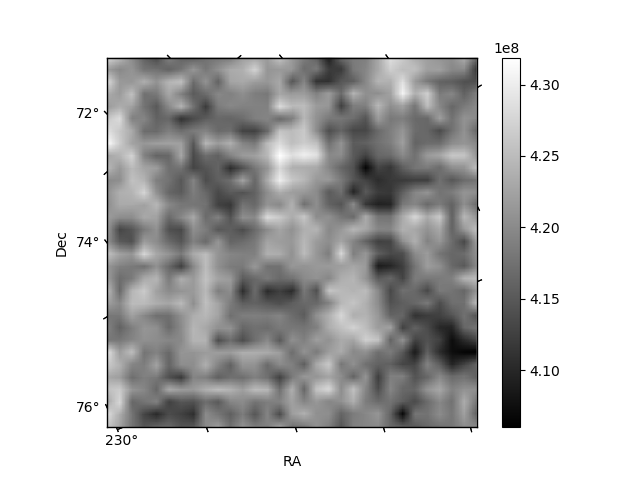
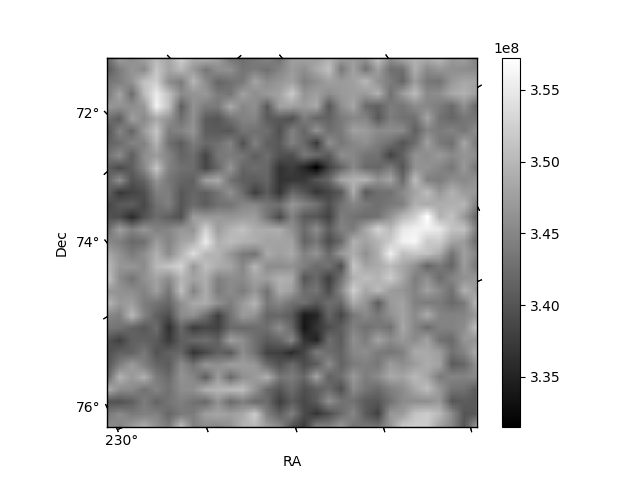
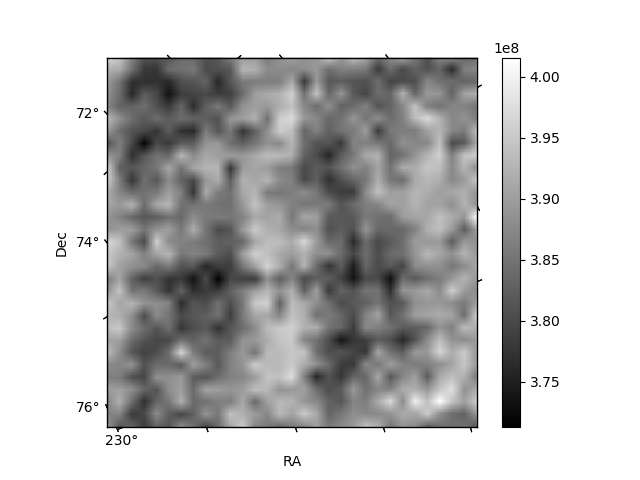
Histogram calculated using DETX and DETY for each event in the final _common_clean file
| Quadrant A | 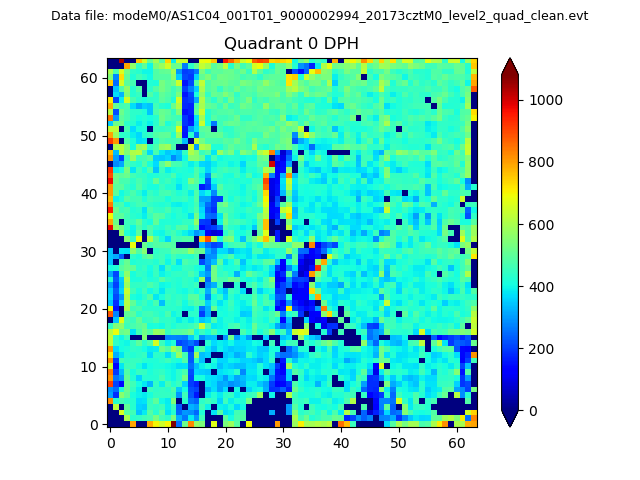 |
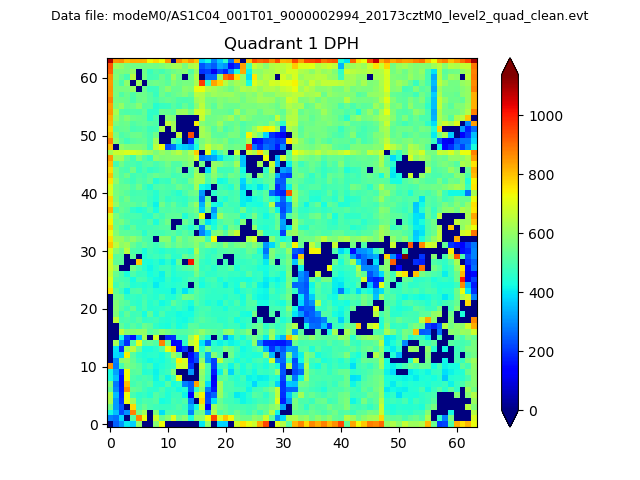 |
Quadrant B |
|---|---|---|---|
| Quadrant D | 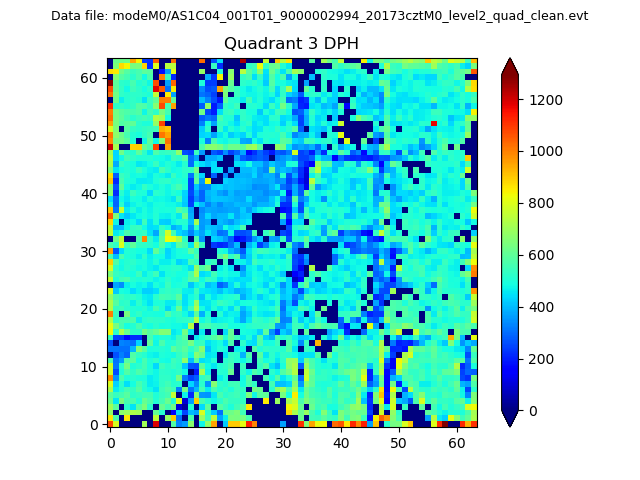 |
 |
Quadrant C |
| Plot type | Count rate plots | Images |
|---|---|---|
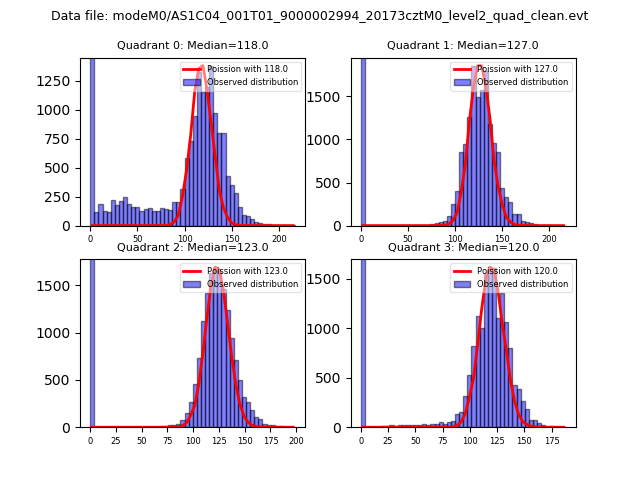
| Comparison with Poisson distribution Blue bars denote a histogram of data divided into 1 sec bins. Red curve is a Poisson curve with rate = median count rate of data. |
 |
 |
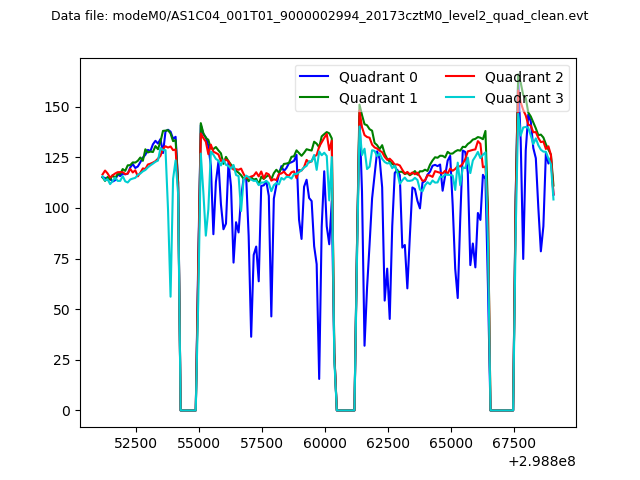
| Quadrant-wise count rates Data is divided into 100 sec bins |
 |
|
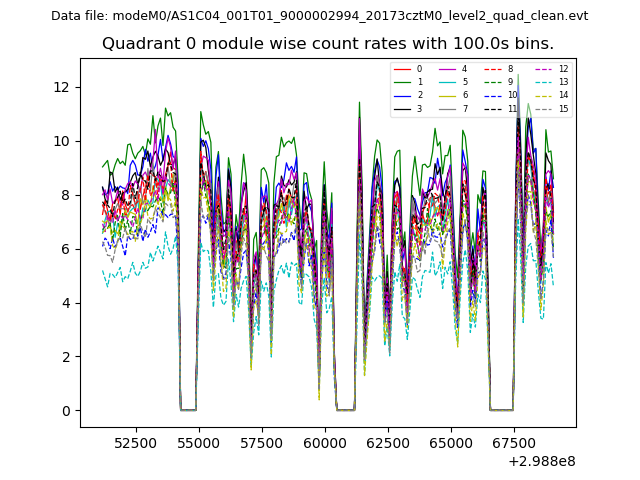
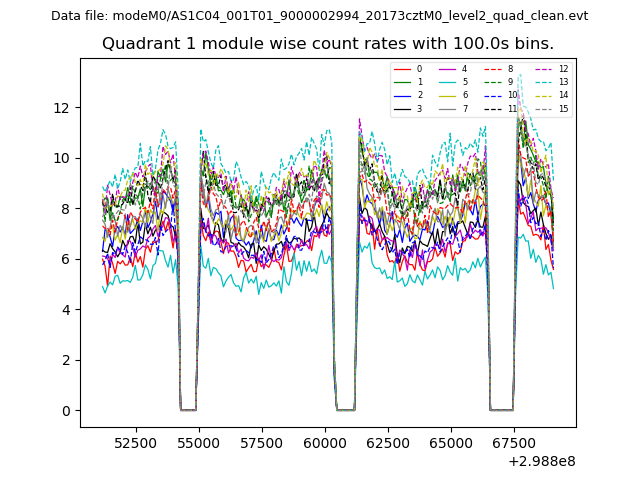
| Module-wise count rates for Quadrant A Data is divided into 100 sec bins |
 |
 |
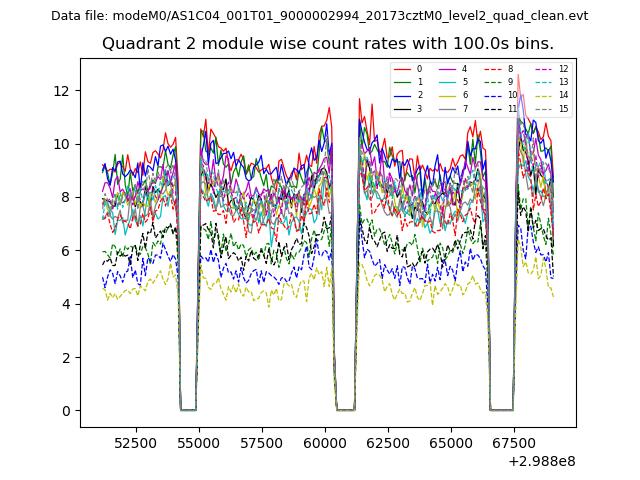
| Module-wise count rates for Quadrant B Data is divided into 100 sec bins |
 |
 |
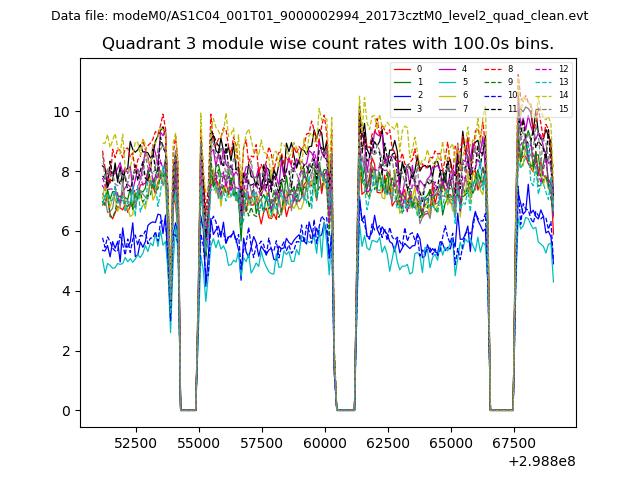
| Module-wise count rates for Quadrant C Data is divided into 100 sec bins |
 |
 |
| Module-wise count rates for Quadrant D Data is divided into 100 sec bins |
 |
 |
| Parameter | Plot |
|---|---|
| CZT HV Monitor | 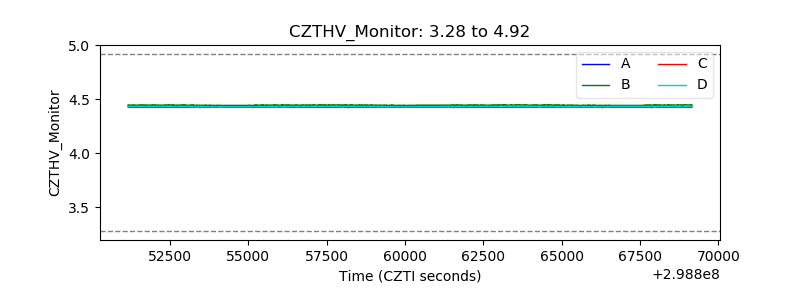 |
| D_VDD | 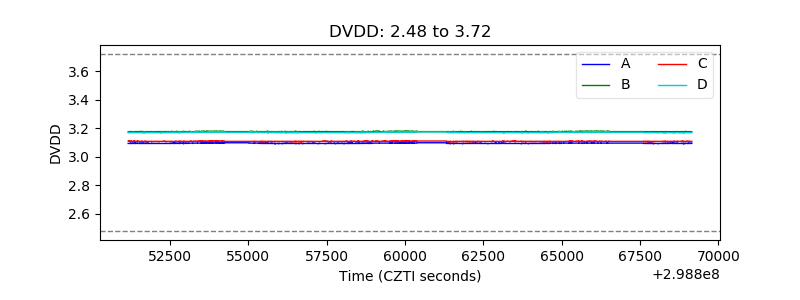 |
| Temperature 1 | 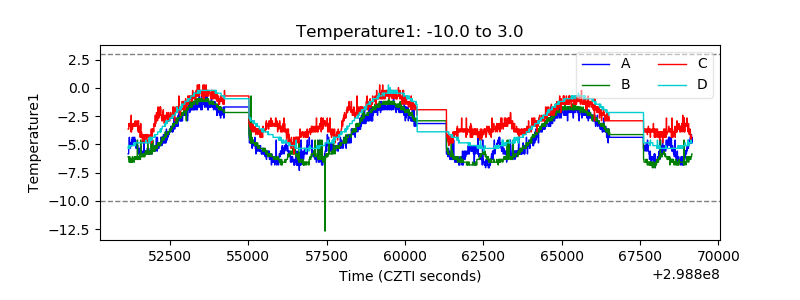 |
| Veto HV Monitor |  |
| Veto LLD | 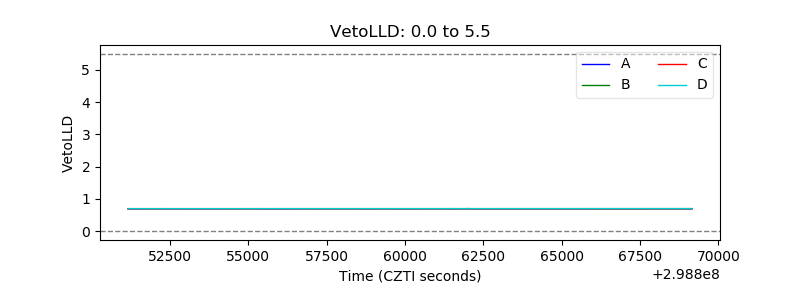 |
| Alpha Counter | 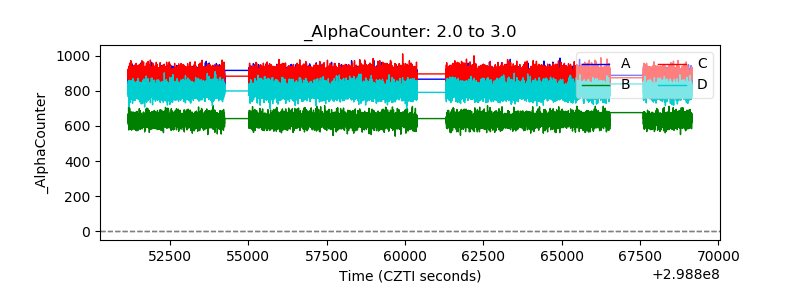 |
| _CPM_Rate | 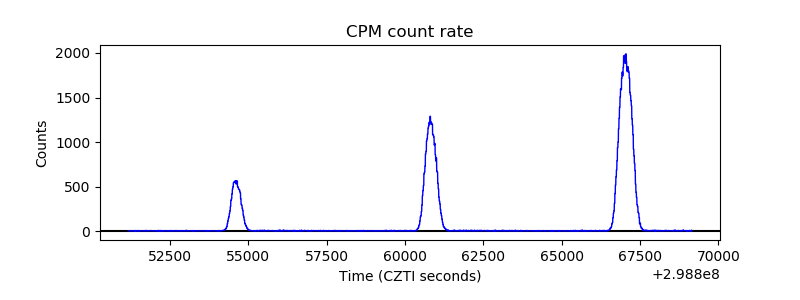 |
| CZT Counter | 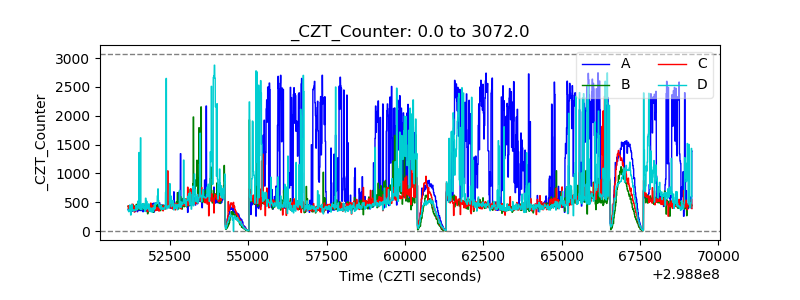 |
| +2.5 Volts monitor |  |
| +5 Volts monitor | 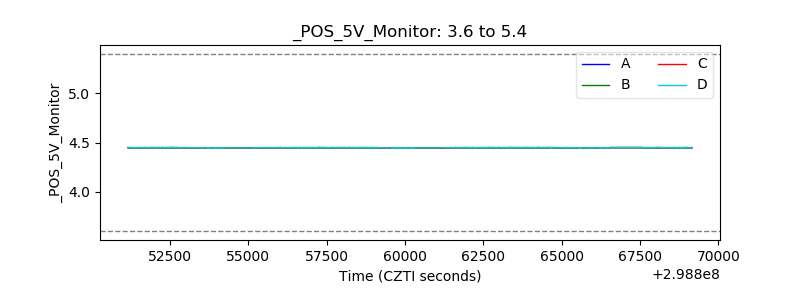 |
| _ROLL_ROT | 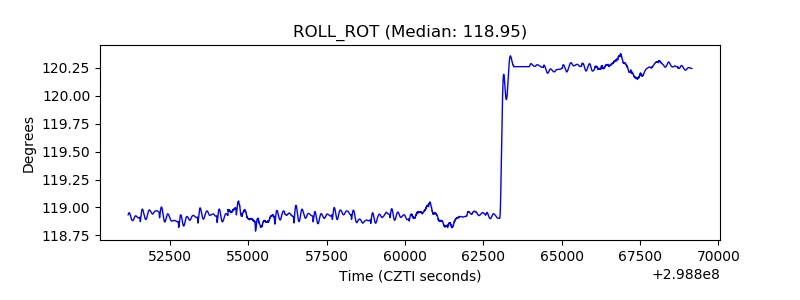 |
| _Roll_DEC | 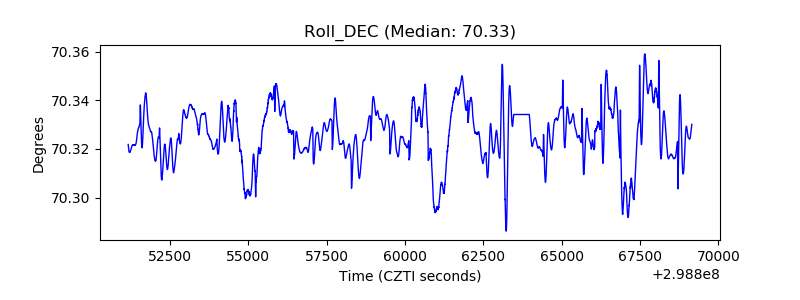 |
| _Roll_RA | 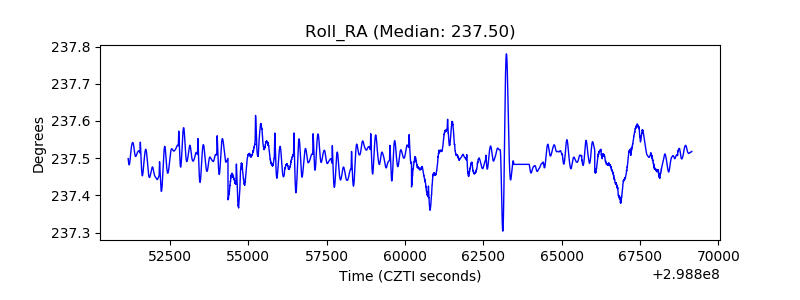 |
| Veto Counter | 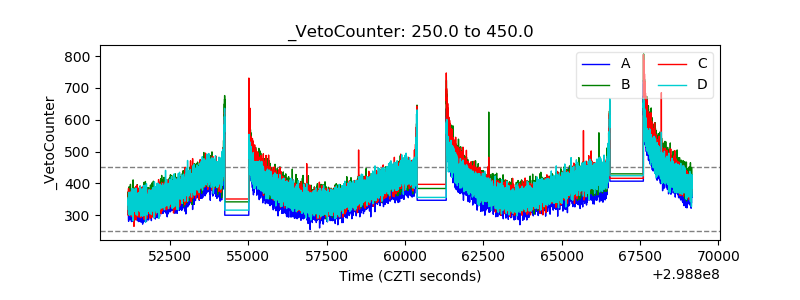 |