| Param | Original file | Final file |
|---|---|---|
| Filename | modeM0/AS1C04_001T01_9000002994_20175cztM0_level2.evt | modeM0/AS1C04_001T01_9000002994_20175cztM0_level2_quad_clean.evt |
| Size (bytes) | 692,072,640 | 125,729,280 |
| Size | 660.0 MB | 119.9 MB |
| Events in quadrant A | 6,787,456 | 792,936 |
| Events in quadrant B | 3,429,138 | 900,274 |
| Events in quadrant C | 4,066,881 | 856,007 |
| Events in quadrant D | 6,238,044 | 805,878 |
| Mode SS | |||
|---|---|---|---|
| Quadrant | BADHDUFLAG | Total packets | Discarded packets |
| A | 0 | 132 | 0 |
| B | 0 | 132 | 0 |
| C | 0 | 132 | 0 |
| D | 0 | 132 | 0 |
| Mode M9 | |||
|---|---|---|---|
| Quadrant | BADHDUFLAG | Total packets | Discarded packets |
| A | 0 | 12 | 0 |
| B | 0 | 12 | 0 |
| C | 0 | 12 | 0 |
| D | 0 | 12 | 0 |
| Mode M0 | |||
|---|---|---|---|
| Quadrant | BADHDUFLAG | Total packets | Discarded packets |
| A | 0 | 24477 | 2 |
| B | 0 | 14287 | 2 |
| C | 0 | 16524 | 2 |
| D | 0 | 22945 | 2 |
| Quadrant | Total seconds | Saturated seconds | Saturation percentage |
|---|---|---|---|
| A | 6480 | 1440 | 22.222222% |
| B | 6480 | 59 | 0.910494% |
| C | 6481 | 98 | 1.512112% |
| D | 6481 | 495 | 7.637710% |
Noise dominated data is calculated using 1-second bins in cleaned event files. If a bin has >2000 counts, and if more than 50% of those come from <1% of pixels, then it is considered to be noise-dominated and hence unusable.
| Quadrant | # 1 sec bins | Bins with >0 counts | Bins with >2000 counts | High rate bins dominated by noise | Noise dominated (total time) | Noise dominated (detector-on time) | Marked lightcurve |
|---|---|---|---|---|---|---|---|
| A | 7685 | 6481 | 951 | 951 | 12.37% | 14.67% | 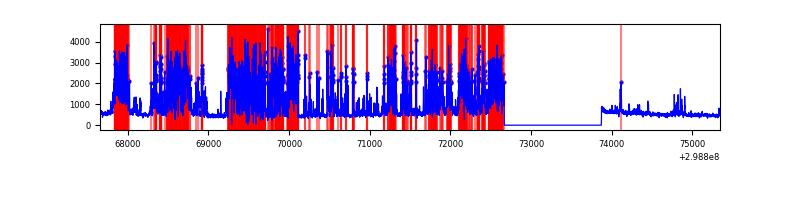 |
| B | 7685 | 6481 | 21 | 21 | 0.27% | 0.32% | 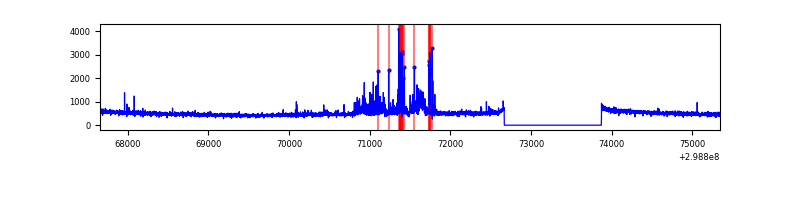 |
| C | 7686 | 6482 | 7 | 7 | 0.09% | 0.11% | 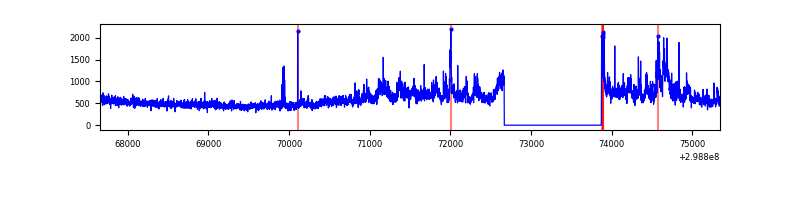 |
| D | 7686 | 6482 | 390 | 390 | 5.07% | 6.02% | 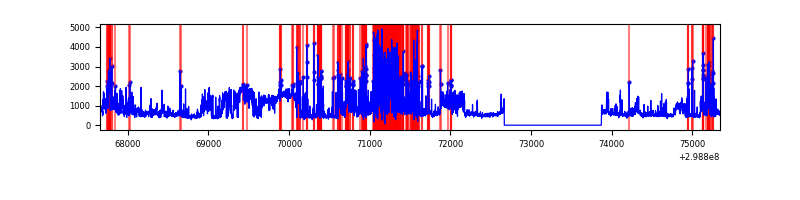 |
Top three noisy pixels from each quadrant. If the there are fewer than three noisy pixels in the level2.evt file, extra rows are filled as -1
| Pixel properties | Quadrant properties | ||||||
|---|---|---|---|---|---|---|---|
| Quadrant | DetID | PixID | Counts | Sigma | Mean | Median | Sigma |
| A | 14 | 238 | 4023892 | 27888.3 | 717 | 702 | 144.3 |
| A | 13 | 254 | 7772 | 49.01 | 717 | 702 | 144.3 |
| A | 0 | 226 | 6156 | 37.81 | 717 | 702 | 144.3 |
| B | 7 | 220 | 194491 | 1301.19 | 791 | 772 | 148.9 |
| B | 0 | 197 | 60166 | 398.94 | 791 | 772 | 148.9 |
| B | 0 | 189 | 29345 | 191.92 | 791 | 772 | 148.9 |
| C | 3 | 233 | 999118 | 5728.35 | 753 | 758 | 174.3 |
| C | 14 | 238 | 119232 | 679.78 | 753 | 758 | 174.3 |
| C | 5 | 4 | 15940 | 87.11 | 753 | 758 | 174.3 |
| D | 1 | 52 | 2883683 | 16193.93 | 740 | 719 | 178.0 |
| D | 1 | 20 | 265191 | 1485.57 | 740 | 719 | 178.0 |
| D | 5 | 222 | 98342 | 548.36 | 740 | 719 | 178.0 |
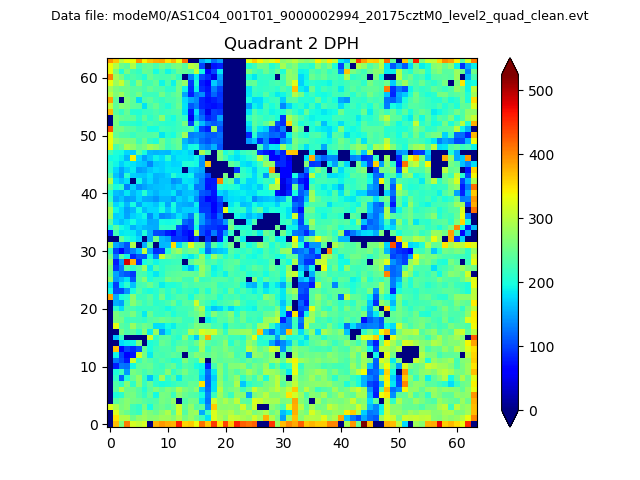
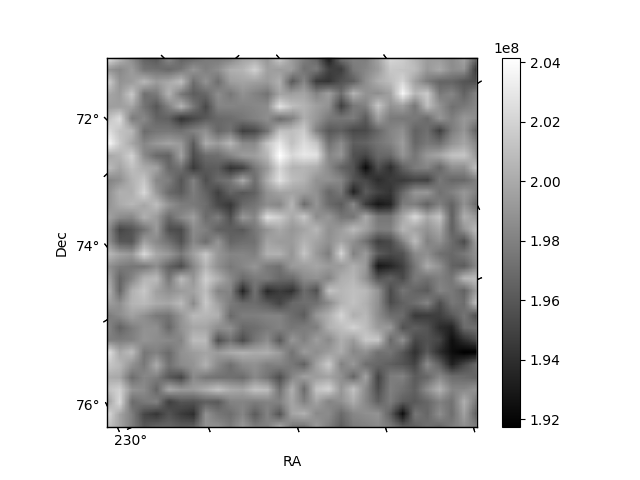
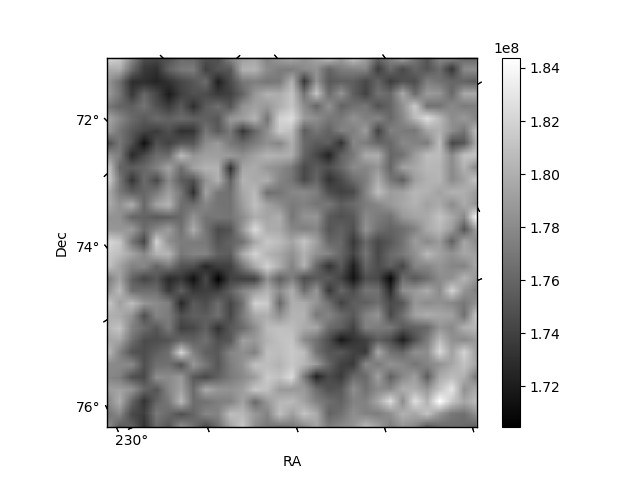
Histogram calculated using DETX and DETY for each event in the final _common_clean file
| Quadrant A | 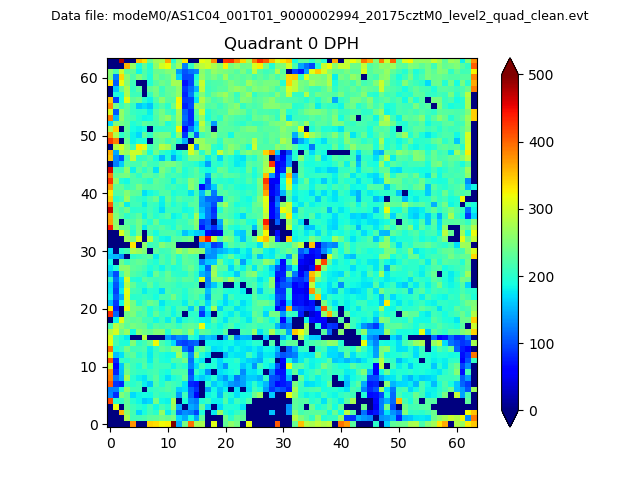 |
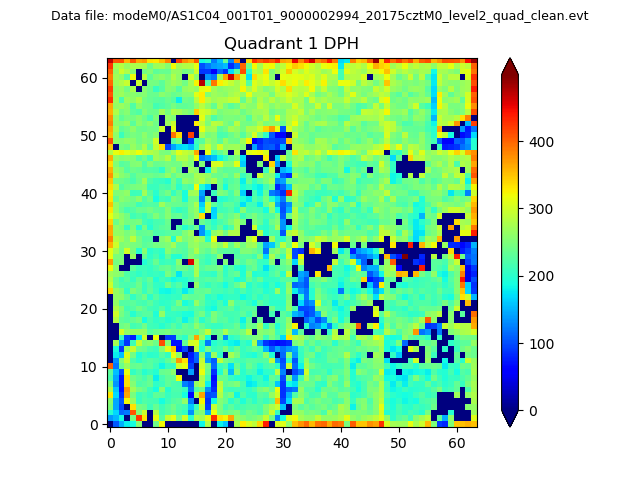 |
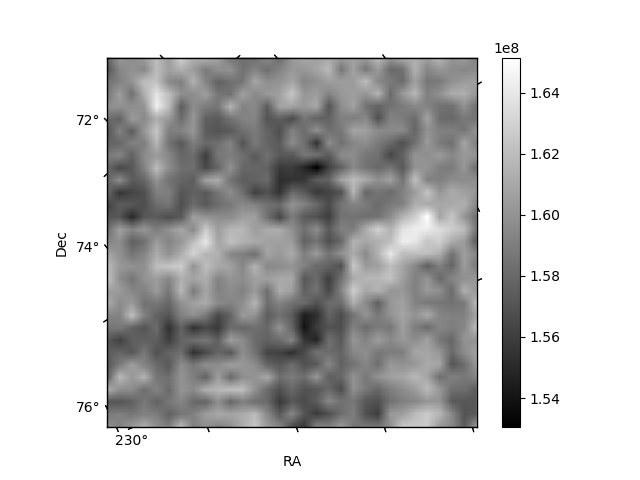
Quadrant B |
|---|---|---|---|
| Quadrant D | 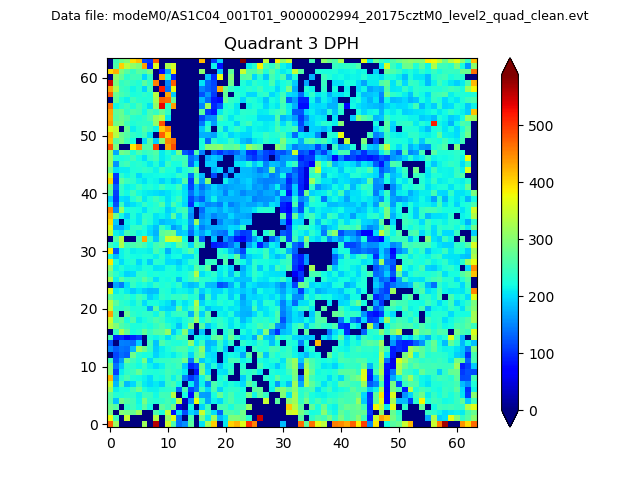 |
 |
Quadrant C |
| Plot type | Count rate plots | Images |
|---|---|---|
| Comparison with Poisson distribution Blue bars denote a histogram of data divided into 1 sec bins. Red curve is a Poisson curve with rate = median count rate of data. |
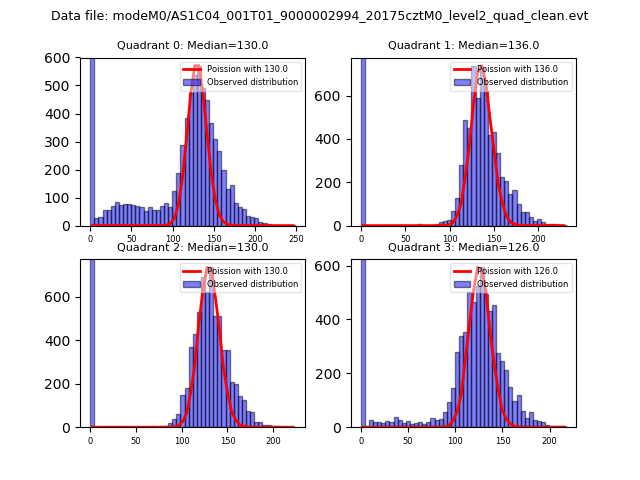 |
 |
| Quadrant-wise count rates Data is divided into 100 sec bins |
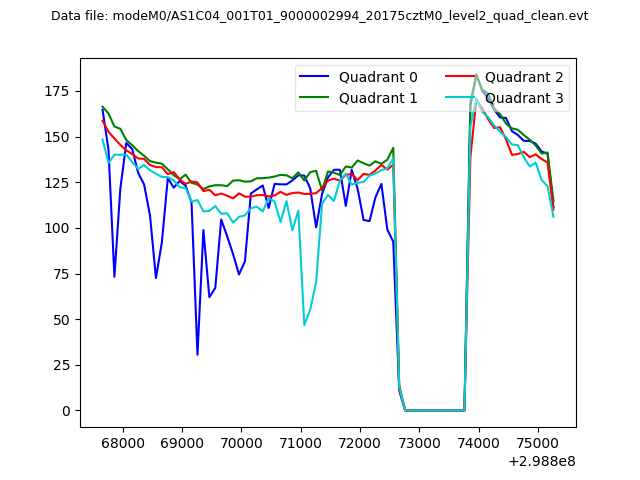 |
|
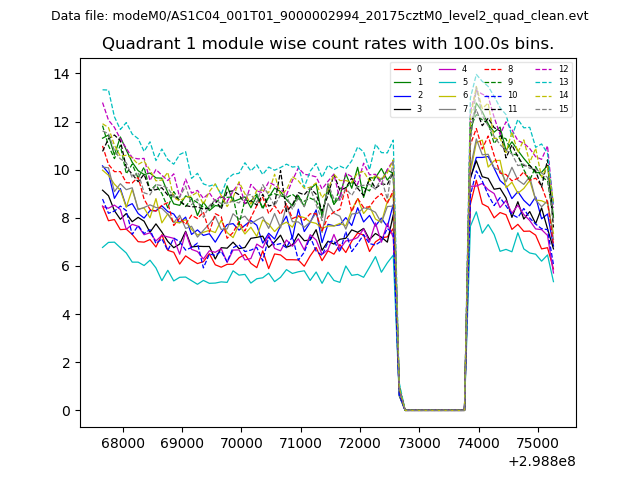
| Module-wise count rates for Quadrant A Data is divided into 100 sec bins |
 |
 |
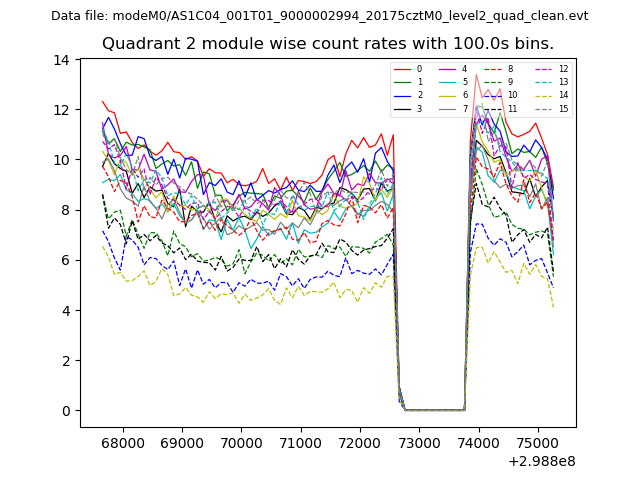
| Module-wise count rates for Quadrant B Data is divided into 100 sec bins |
 |
 |
| Module-wise count rates for Quadrant C Data is divided into 100 sec bins |
 |
 |
| Module-wise count rates for Quadrant D Data is divided into 100 sec bins |
 |
 |
| Parameter | Plot |
|---|---|
| CZT HV Monitor |  |
| D_VDD | 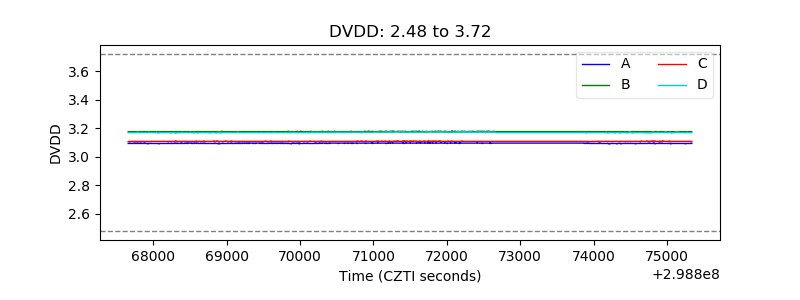 |
| Temperature 1 | 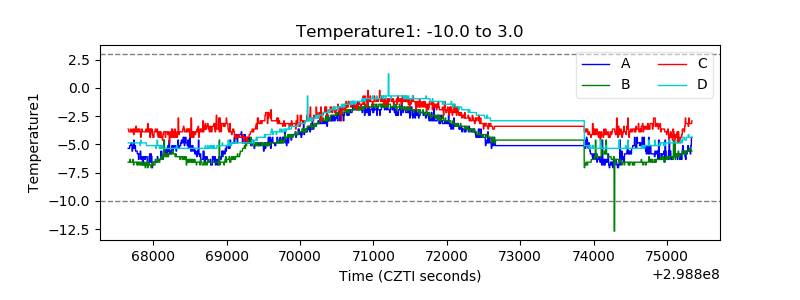 |
| Veto HV Monitor | 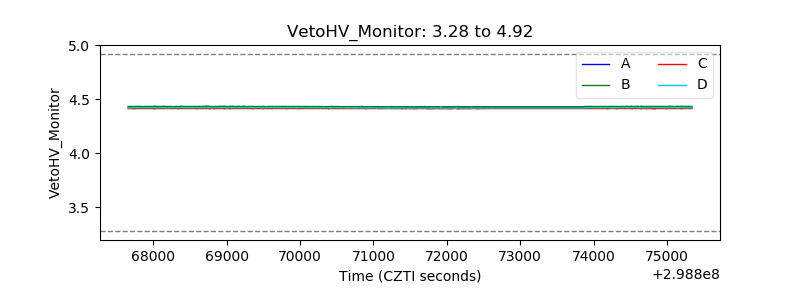 |
| Veto LLD | 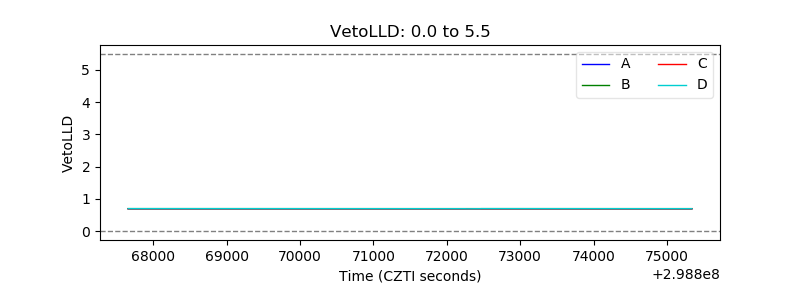 |
| Alpha Counter |  |
| _CPM_Rate | 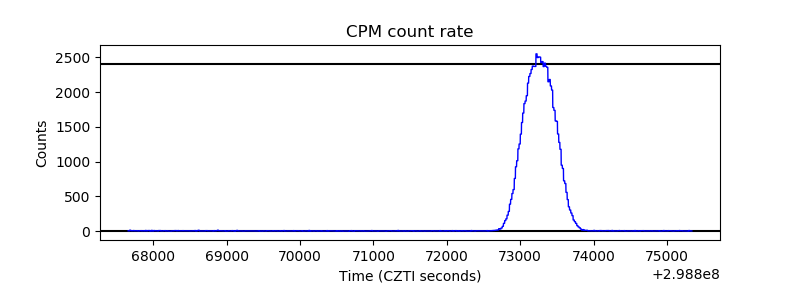 |
| CZT Counter | 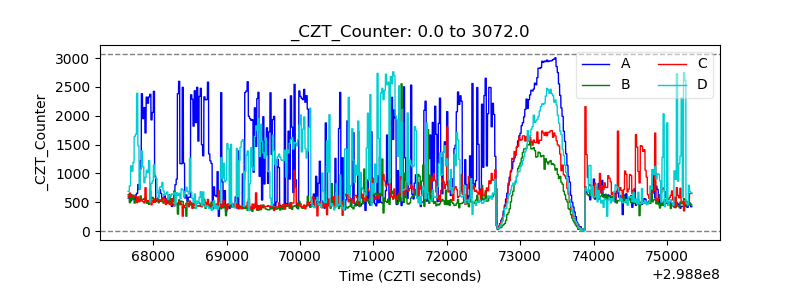 |
| +2.5 Volts monitor |  |
| +5 Volts monitor |  |
| _ROLL_ROT | 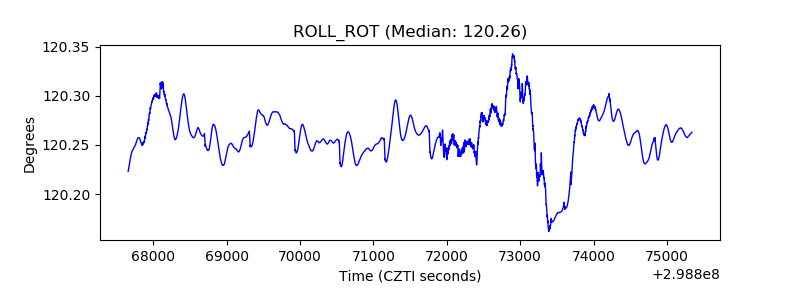 |
| _Roll_DEC | 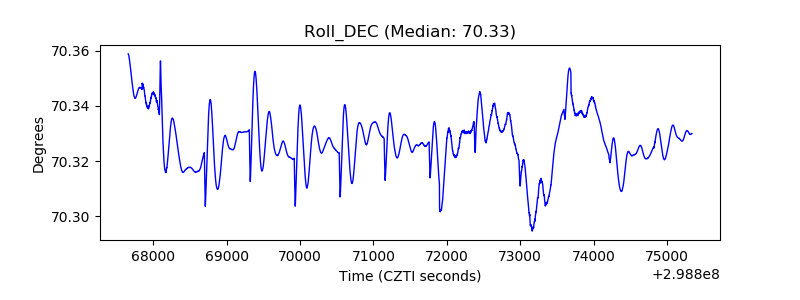 |
| _Roll_RA | 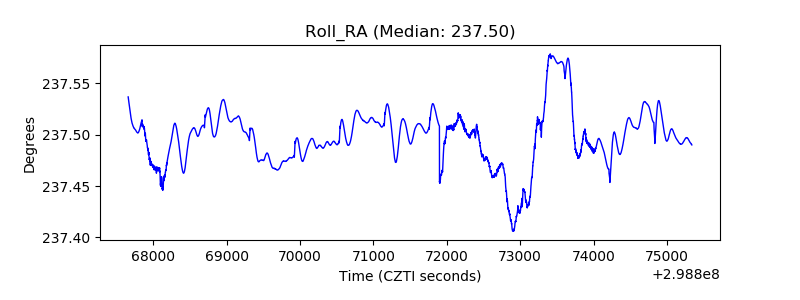 |
| Veto Counter | 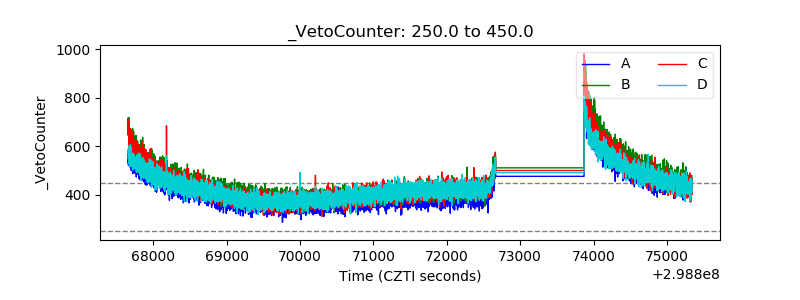 |