| Param | Original file | Final file |
|---|---|---|
| Filename | modeM0/AS1C04_001T01_9000002994_20176cztM0_level2.evt | modeM0/AS1C04_001T01_9000002994_20176cztM0_level2_quad_clean.evt |
| Size (bytes) | 513,838,080 | 132,837,120 |
| Size | 490.0 MB | 126.7 MB |
| Events in quadrant A | 3,676,199 | 919,683 |
| Events in quadrant B | 3,374,370 | 929,247 |
| Events in quadrant C | 3,829,291 | 875,429 |
| Events in quadrant D | 4,258,696 | 863,543 |
| Mode SS | |||
|---|---|---|---|
| Quadrant | BADHDUFLAG | Total packets | Discarded packets |
| A | 0 | 126 | 0 |
| B | 0 | 126 | 0 |
| C | 0 | 126 | 0 |
| D | 0 | 126 | 0 |
| Mode M9 | |||
|---|---|---|---|
| Quadrant | BADHDUFLAG | Total packets | Discarded packets |
| A | 0 | 13 | 0 |
| B | 0 | 13 | 0 |
| C | 0 | 13 | 0 |
| D | 0 | 13 | 0 |
| Mode M0 | |||
|---|---|---|---|
| Quadrant | BADHDUFLAG | Total packets | Discarded packets |
| A | 0 | 14890 | 1 |
| B | 0 | 13872 | 1 |
| C | 0 | 15306 | 2 |
| D | 0 | 16656 | 1 |
| Quadrant | Total seconds | Saturated seconds | Saturation percentage |
|---|---|---|---|
| A | 6244 | 126 | 2.017937% |
| B | 6244 | 84 | 1.345291% |
| C | 6243 | 85 | 1.361525% |
| D | 6243 | 144 | 2.306583% |
Noise dominated data is calculated using 1-second bins in cleaned event files. If a bin has >2000 counts, and if more than 50% of those come from <1% of pixels, then it is considered to be noise-dominated and hence unusable.
| Quadrant | # 1 sec bins | Bins with >0 counts | Bins with >2000 counts | High rate bins dominated by noise | Noise dominated (total time) | Noise dominated (detector-on time) | Marked lightcurve |
|---|---|---|---|---|---|---|---|
| A | 7524 | 6245 | 50 | 50 | 0.66% | 0.80% | 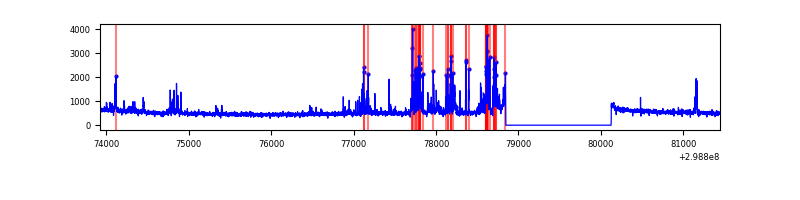 |
| B | 7524 | 6245 | 22 | 22 | 0.29% | 0.35% | 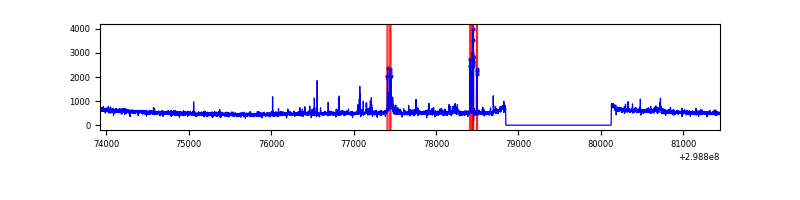 |
| C | 7523 | 6244 | 1 | 1 | 0.01% | 0.02% | 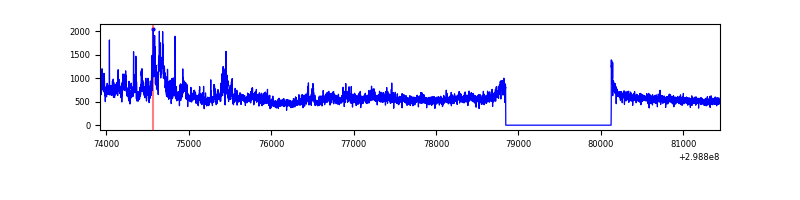 |
| D | 7523 | 6244 | 107 | 107 | 1.42% | 1.71% | 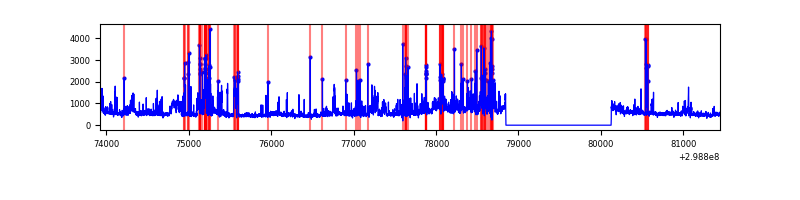 |
Top three noisy pixels from each quadrant. If the there are fewer than three noisy pixels in the level2.evt file, extra rows are filled as -1
| Pixel properties | Quadrant properties | ||||||
|---|---|---|---|---|---|---|---|
| Quadrant | DetID | PixID | Counts | Sigma | Mean | Median | Sigma |
| A | 14 | 238 | 574128 | 3582.23 | 804 | 791 | 160.1 |
| A | 13 | 254 | 9723 | 55.81 | 804 | 791 | 160.1 |
| A | 0 | 226 | 7047 | 39.09 | 804 | 791 | 160.1 |
| B | 5 | 172 | 52544 | 351.09 | 797 | 780 | 147.4 |
| B | 6 | 36 | 50898 | 339.93 | 797 | 780 | 147.4 |
| B | 0 | 189 | 36290 | 240.85 | 797 | 780 | 147.4 |
| C | 3 | 233 | 762935 | 4382.48 | 755 | 760 | 173.9 |
| C | 14 | 238 | 121845 | 696.23 | 755 | 760 | 173.9 |
| C | 13 | 61 | 5304 | 26.13 | 755 | 760 | 173.9 |
| D | 1 | 52 | 829750 | 4510.04 | 768 | 746 | 183.8 |
| D | 7 | 238 | 317598 | 1723.77 | 768 | 746 | 183.8 |
| D | 1 | 20 | 84166 | 453.83 | 768 | 746 | 183.8 |
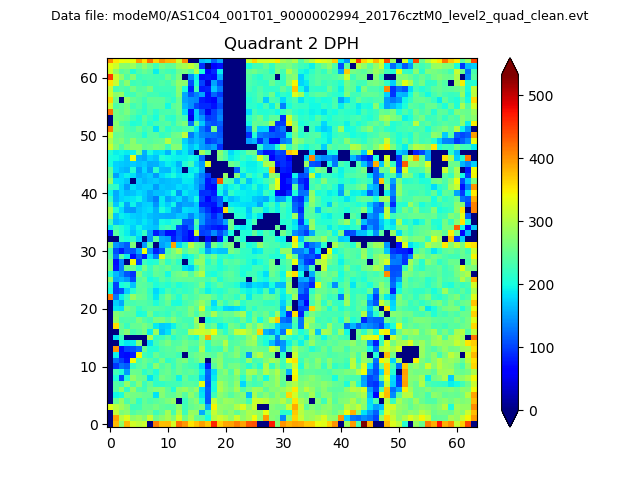
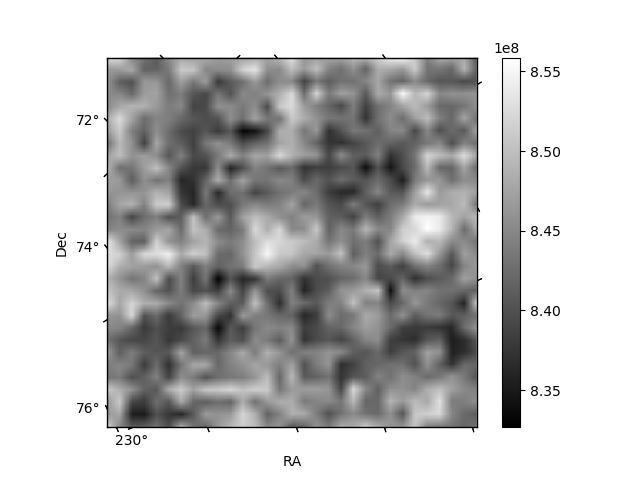
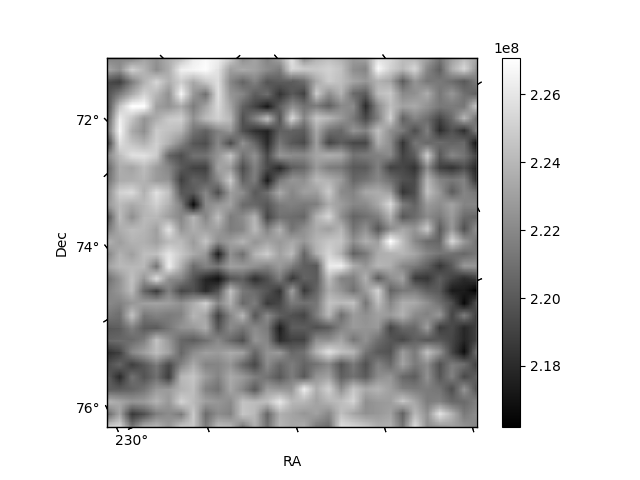
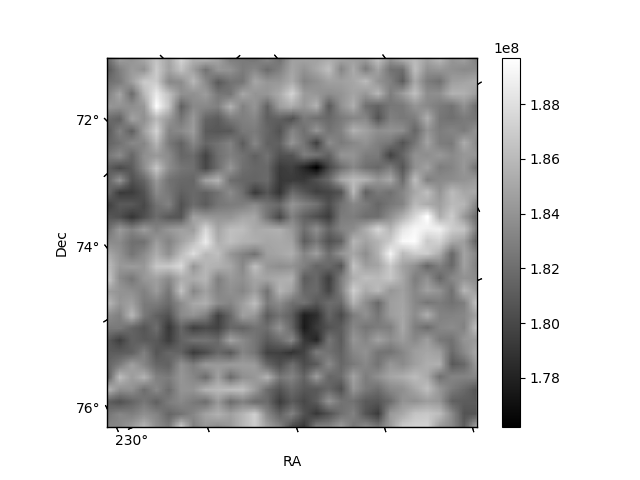
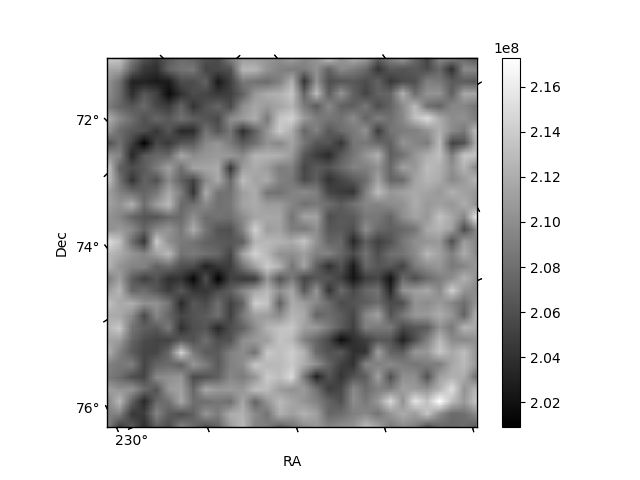
Histogram calculated using DETX and DETY for each event in the final _common_clean file
| Quadrant A | 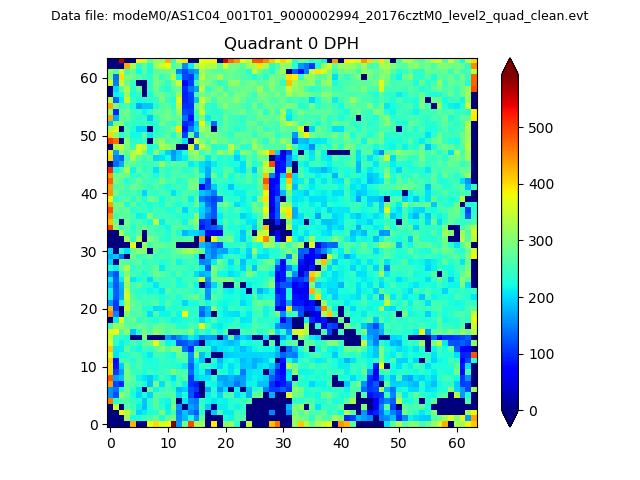 |
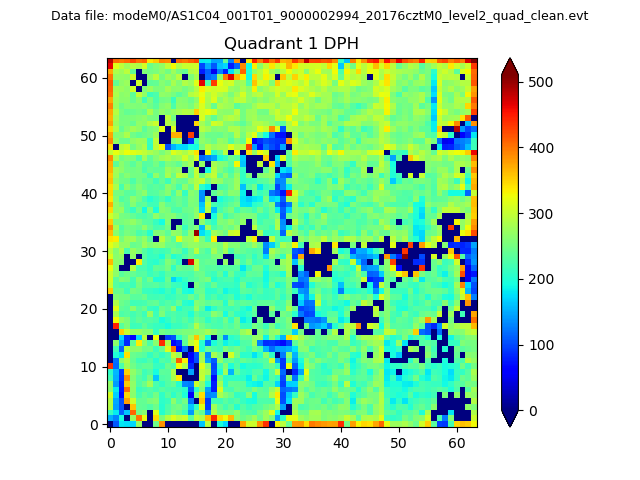 |
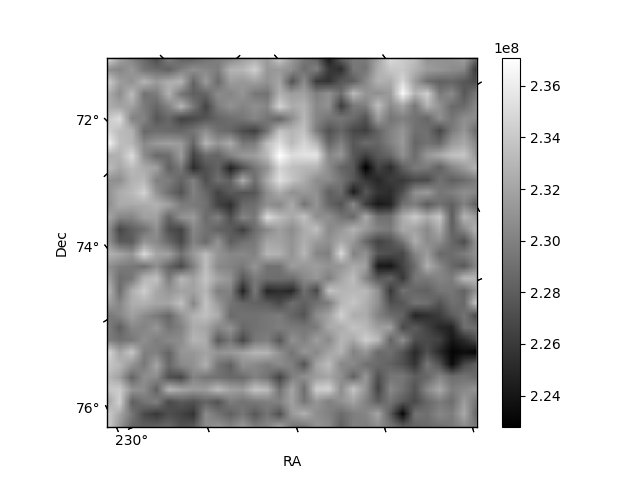
Quadrant B |
|---|---|---|---|
| Quadrant D | 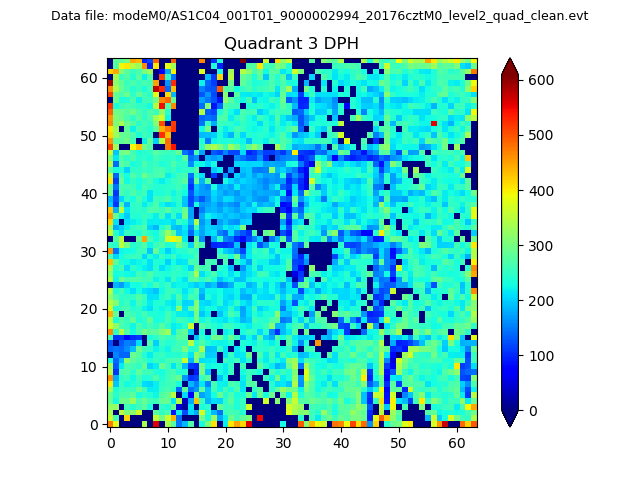 |
 |
Quadrant C |
| Plot type | Count rate plots | Images |
|---|---|---|
| Comparison with Poisson distribution Blue bars denote a histogram of data divided into 1 sec bins. Red curve is a Poisson curve with rate = median count rate of data. |
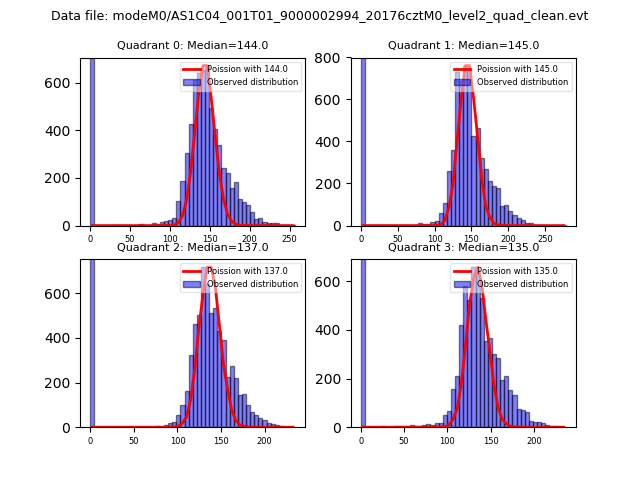 |
 |
| Quadrant-wise count rates Data is divided into 100 sec bins |
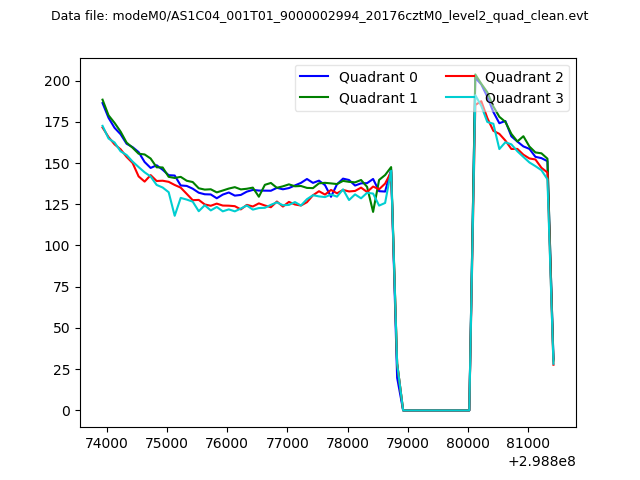 |
|
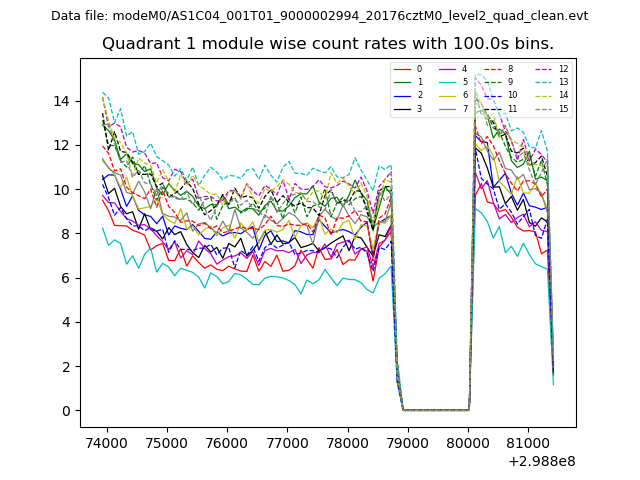
| Module-wise count rates for Quadrant A Data is divided into 100 sec bins |
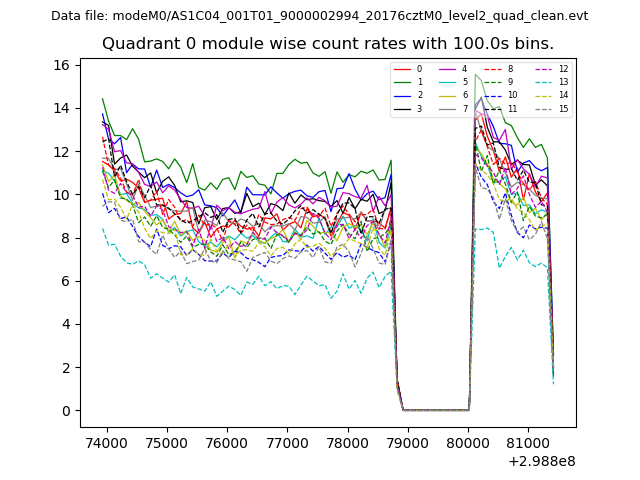 |
 |
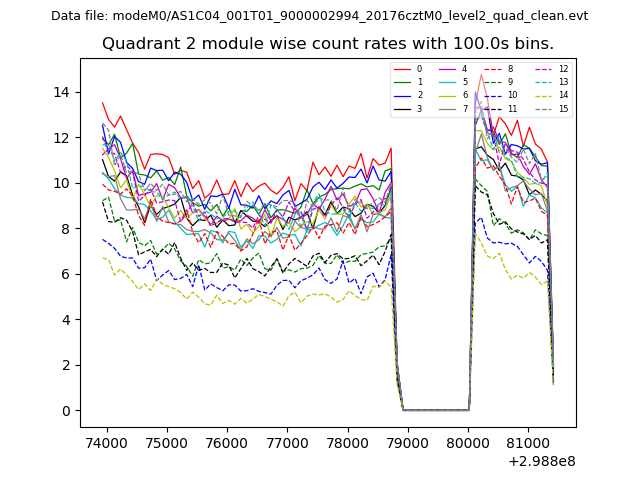
| Module-wise count rates for Quadrant B Data is divided into 100 sec bins |
 |
 |
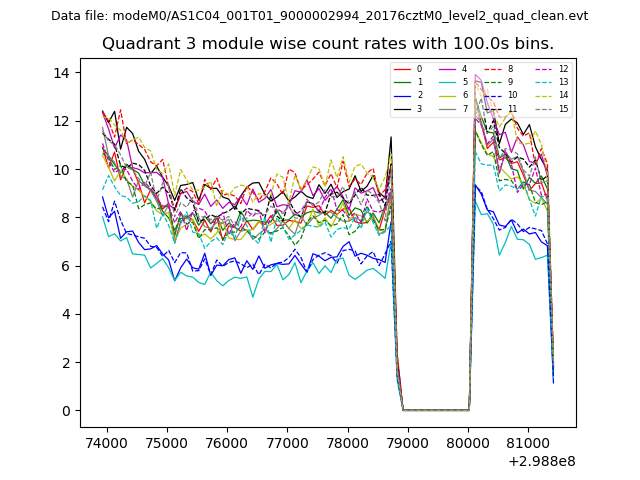
| Module-wise count rates for Quadrant C Data is divided into 100 sec bins |
 |
 |
| Module-wise count rates for Quadrant D Data is divided into 100 sec bins |
 |
 |
| Parameter | Plot |
|---|---|
| CZT HV Monitor | 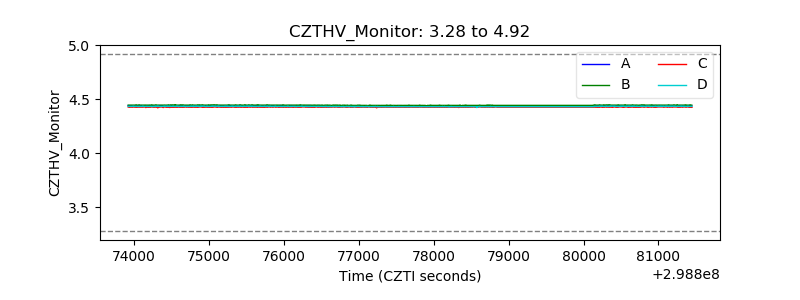 |
| D_VDD | 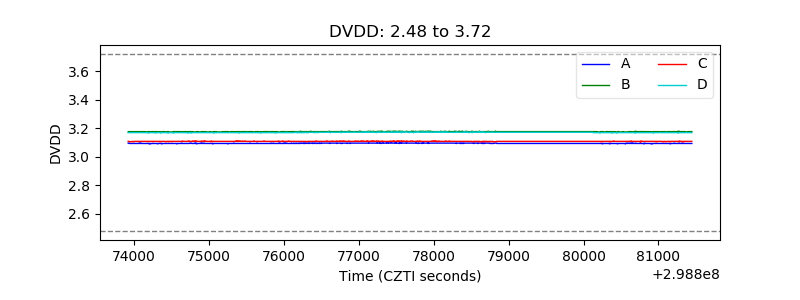 |
| Temperature 1 |  |
| Veto HV Monitor | 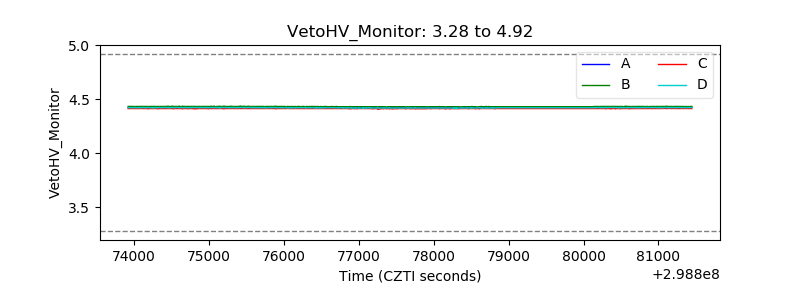 |
| Veto LLD | 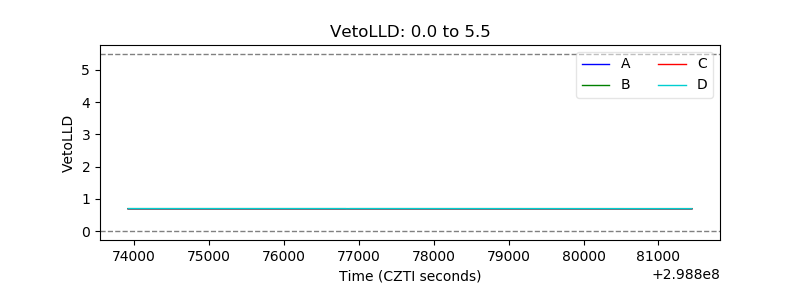 |
| Alpha Counter | 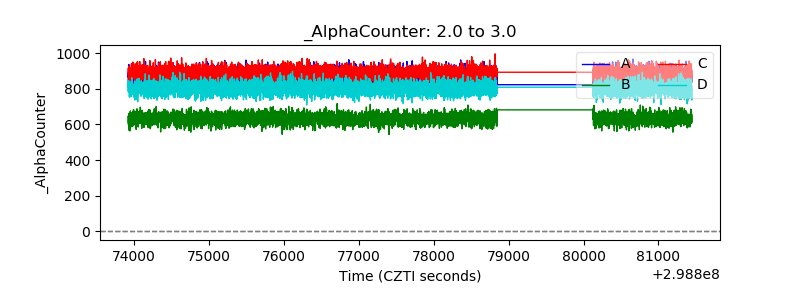 |
| _CPM_Rate | 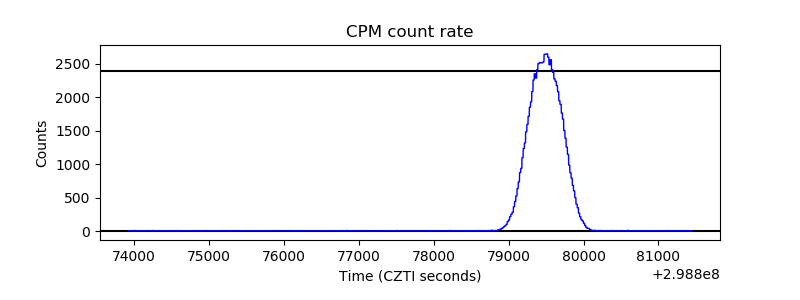 |
| CZT Counter | 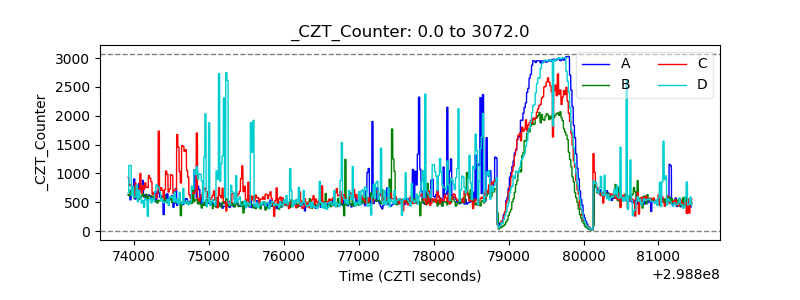 |
| +2.5 Volts monitor | 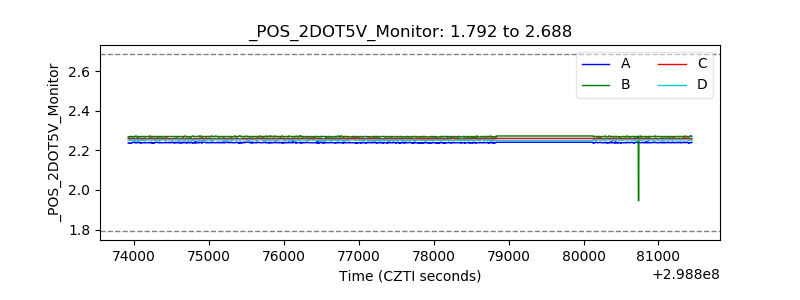 |
| +5 Volts monitor |  |
| _ROLL_ROT |  |
| _Roll_DEC | 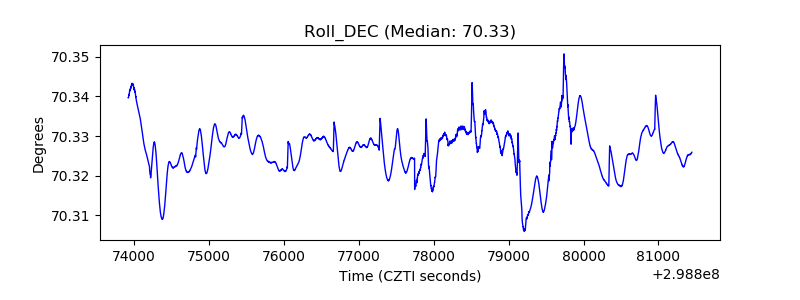 |
| _Roll_RA | 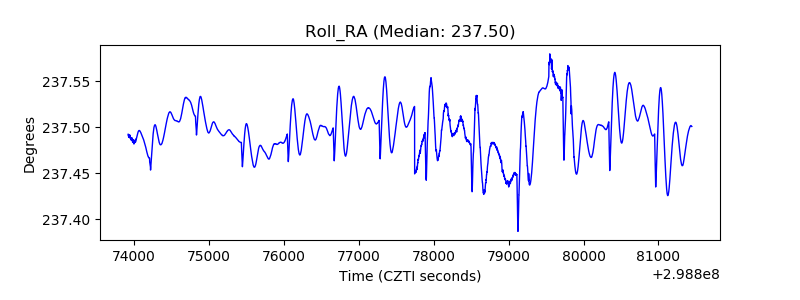 |
| Veto Counter |  |