| Param | Original file | Final file |
|---|---|---|
| Filename | modeM0/AS1C04_001T01_9000002994_20180cztM0_level2.evt | modeM0/AS1C04_001T01_9000002994_20180cztM0_level2_quad_clean.evt |
| Size (bytes) | 2,034,380,160 | 416,859,840 |
| Size | 1.9 GB | 397.5 MB |
| Events in quadrant A | 20,989,854 | 2,658,849 |
| Events in quadrant B | 11,096,061 | 2,978,364 |
| Events in quadrant C | 12,395,547 | 2,823,236 |
| Events in quadrant D | 15,721,264 | 2,724,007 |
| Mode SS | |||
|---|---|---|---|
| Quadrant | BADHDUFLAG | Total packets | Discarded packets |
| A | 0 | 430 | 0 |
| B | 0 | 430 | 0 |
| C | 0 | 430 | 0 |
| D | 0 | 430 | 0 |
| Mode M9 | |||
|---|---|---|---|
| Quadrant | BADHDUFLAG | Total packets | Discarded packets |
| A | 0 | 46 | 0 |
| B | 0 | 46 | 0 |
| C | 0 | 46 | 0 |
| D | 0 | 46 | 0 |
| Mode M0 | |||
|---|---|---|---|
| Quadrant | BADHDUFLAG | Total packets | Discarded packets |
| A | 0 | 75798 | 5 |
| B | 0 | 45708 | 6 |
| C | 0 | 50188 | 5 |
| D | 0 | 60510 | 5 |
| Quadrant | Total seconds | Saturated seconds | Saturation percentage |
|---|---|---|---|
| A | 20906 | 4610 | 22.051086% |
| B | 20906 | 440 | 2.104659% |
| C | 20906 | 503 | 2.406008% |
| D | 20906 | 1613 | 7.715488% |
Noise dominated data is calculated using 1-second bins in cleaned event files. If a bin has >2000 counts, and if more than 50% of those come from <1% of pixels, then it is considered to be noise-dominated and hence unusable.
| Quadrant | # 1 sec bins | Bins with >0 counts | Bins with >2000 counts | High rate bins dominated by noise | Noise dominated (total time) | Noise dominated (detector-on time) | Marked lightcurve |
|---|---|---|---|---|---|---|---|
| A | 25637 | 20912 | 2972 | 2972 | 11.59% | 14.21% | 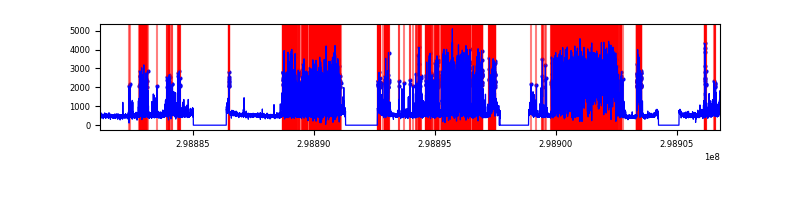 |
| B | 25637 | 20912 | 40 | 40 | 0.16% | 0.19% | 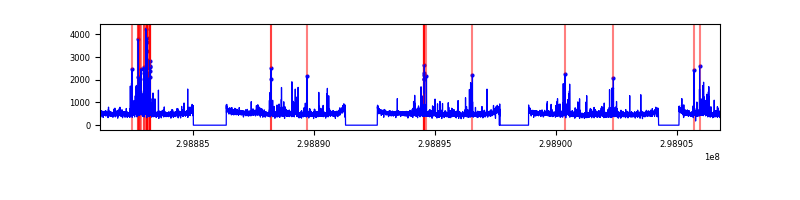 |
| C | 25637 | 20912 | 1 | 1 | 0.00% | 0.00% | 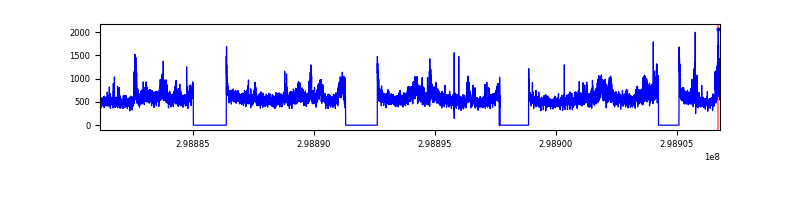 |
| D | 25637 | 20912 | 1082 | 1082 | 4.22% | 5.17% | 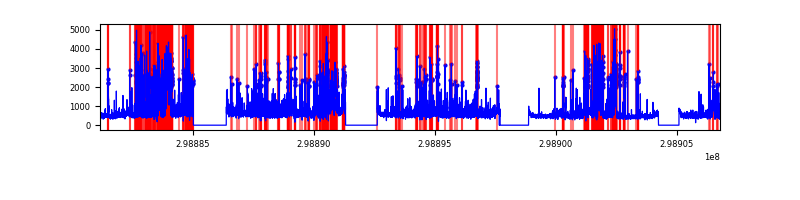 |
Top three noisy pixels from each quadrant. If the there are fewer than three noisy pixels in the level2.evt file, extra rows are filled as -1
| Pixel properties | Quadrant properties | ||||||
|---|---|---|---|---|---|---|---|
| Quadrant | DetID | PixID | Counts | Sigma | Mean | Median | Sigma |
| A | 14 | 238 | 11628396 | 24361.64 | 2398 | 2348 | 477.2 |
| A | 4 | 2 | 126345 | 259.83 | 2398 | 2348 | 477.2 |
| A | 13 | 254 | 25846 | 49.24 | 2398 | 2348 | 477.2 |
| B | 7 | 220 | 318027 | 660.96 | 2601 | 2537 | 477.3 |
| B | 0 | 197 | 210320 | 435.31 | 2601 | 2537 | 477.3 |
| B | 0 | 190 | 122735 | 251.82 | 2601 | 2537 | 477.3 |
| C | 3 | 233 | 2295816 | 4038.64 | 2490 | 2506 | 567.8 |
| C | 14 | 238 | 395999 | 692.96 | 2490 | 2506 | 567.8 |
| C | 13 | 61 | 17440 | 26.3 | 2490 | 2506 | 567.8 |
| D | 7 | 238 | 2355489 | 3963.32 | 2495 | 2428 | 593.7 |
| D | 1 | 52 | 2179304 | 3666.57 | 2495 | 2428 | 593.7 |
| D | 9 | 1 | 893067 | 1500.13 | 2495 | 2428 | 593.7 |
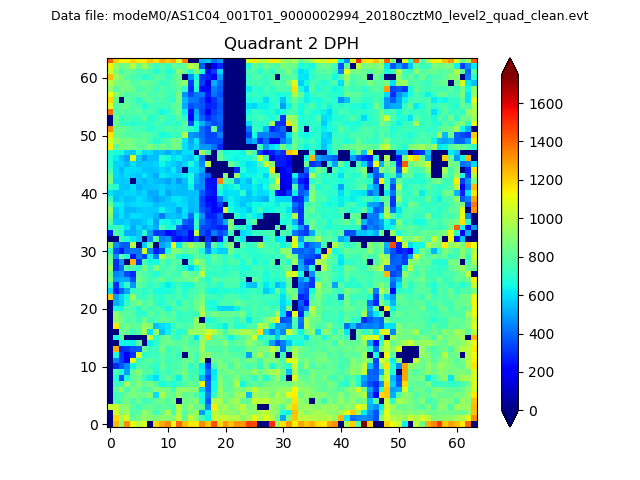
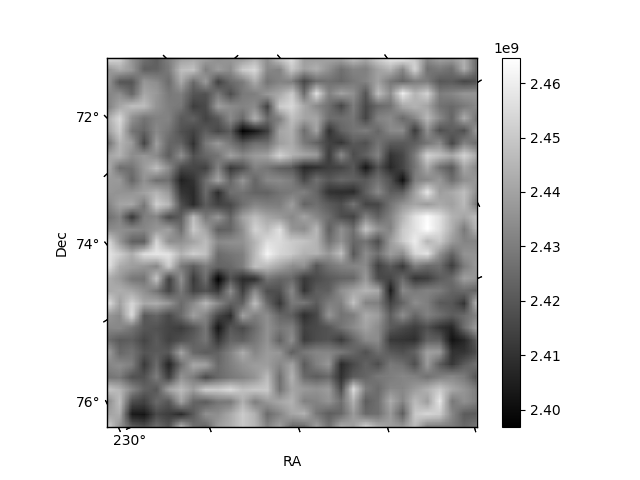
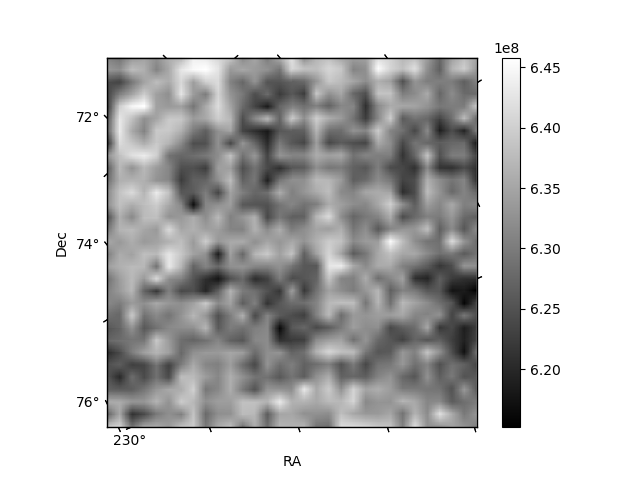
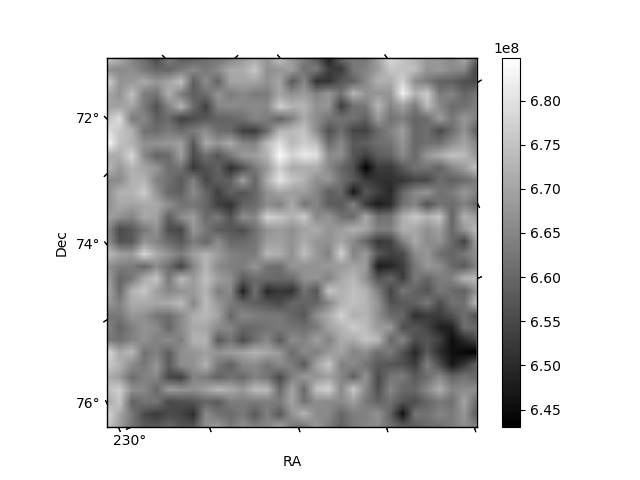
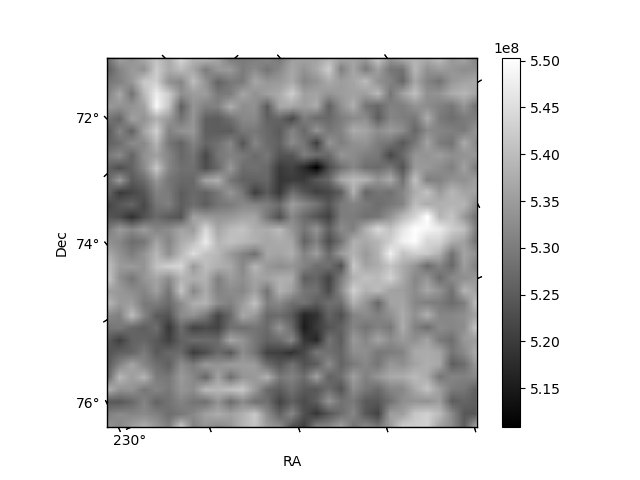
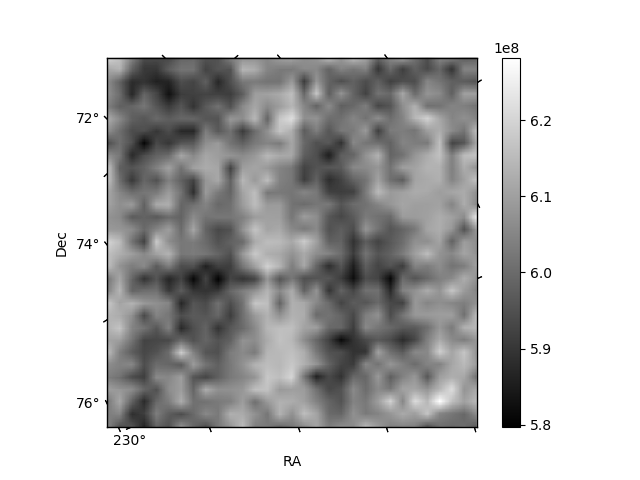
Histogram calculated using DETX and DETY for each event in the final _common_clean file
| Quadrant A | 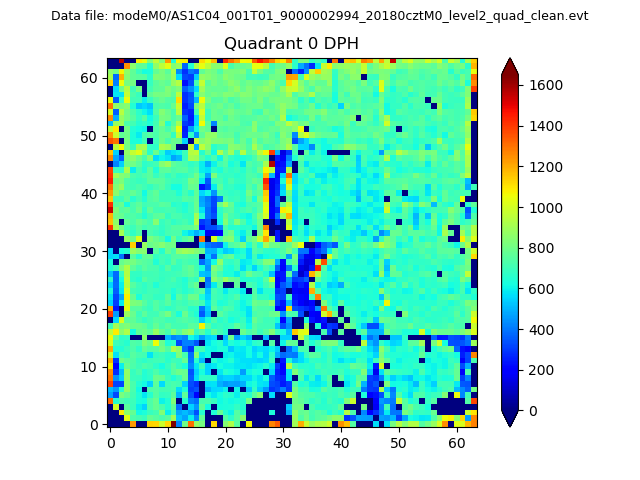 |
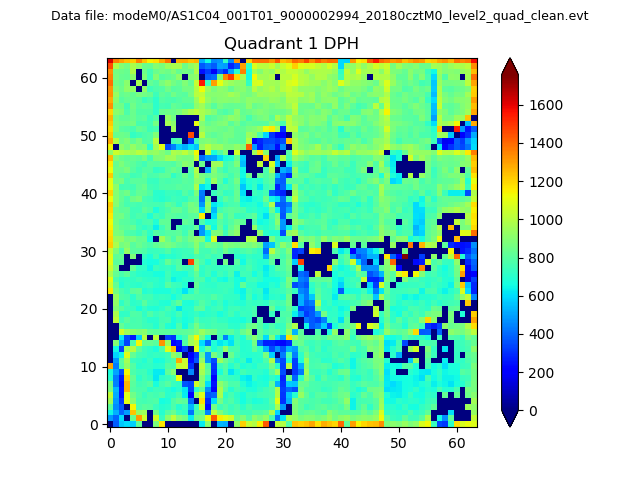 |
Quadrant B |
|---|---|---|---|
| Quadrant D | 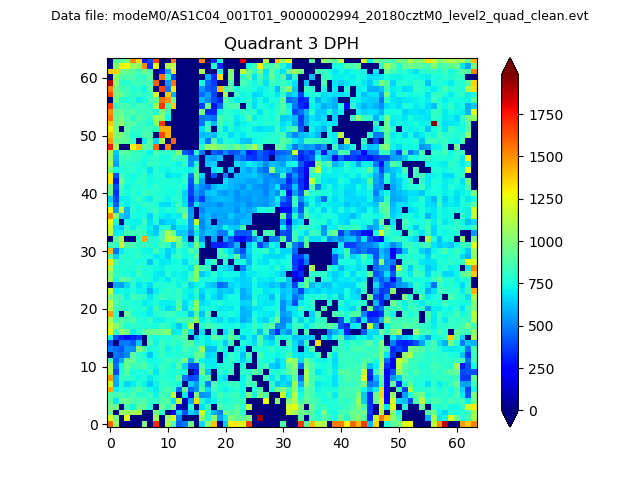 |
 |
Quadrant C |
| Plot type | Count rate plots | Images |
|---|---|---|
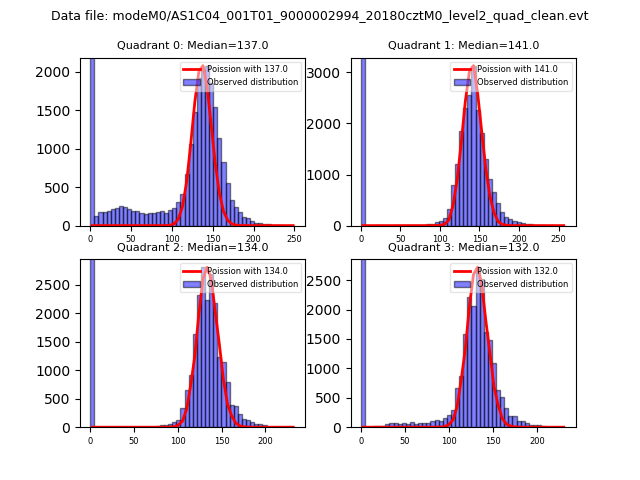
| Comparison with Poisson distribution Blue bars denote a histogram of data divided into 1 sec bins. Red curve is a Poisson curve with rate = median count rate of data. |
 |
 |
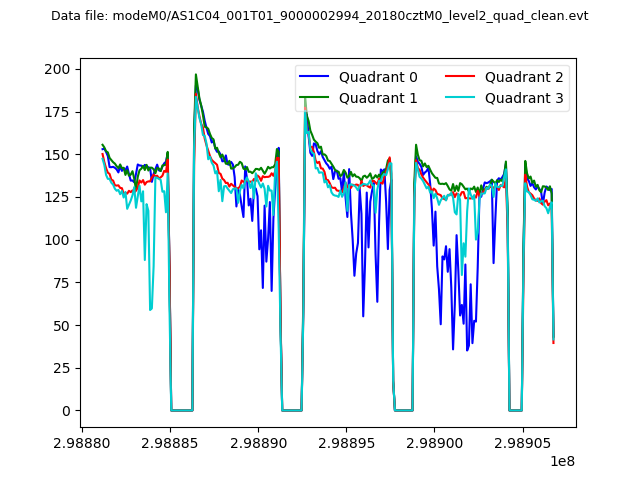
| Quadrant-wise count rates Data is divided into 100 sec bins |
 |
|
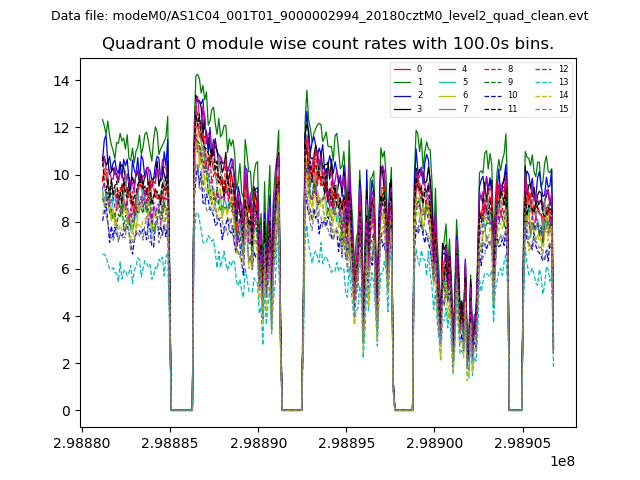
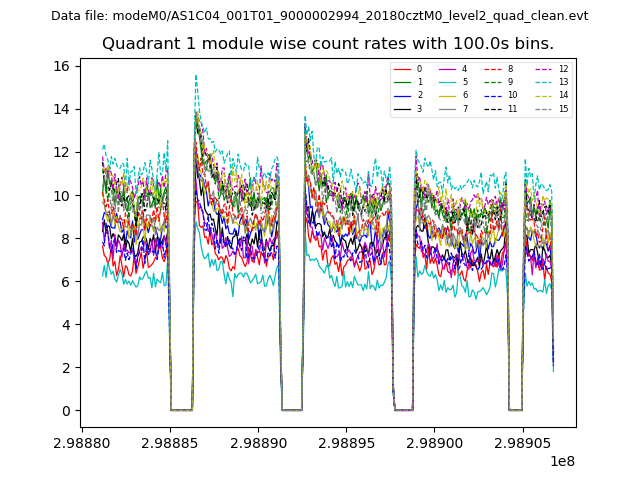
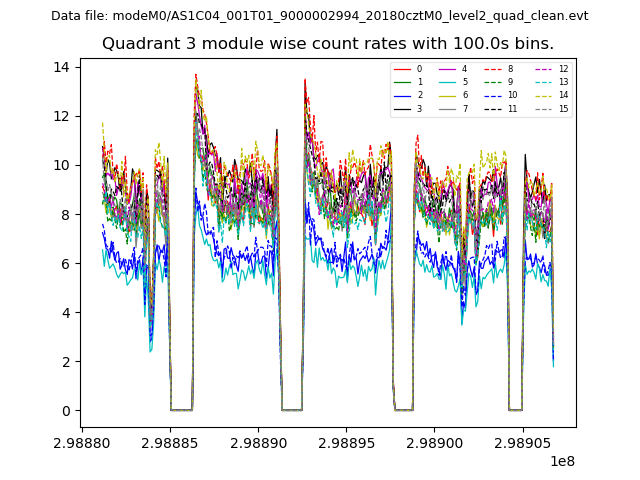
| Module-wise count rates for Quadrant A Data is divided into 100 sec bins |
 |
 |
| Module-wise count rates for Quadrant B Data is divided into 100 sec bins |
 |
 |
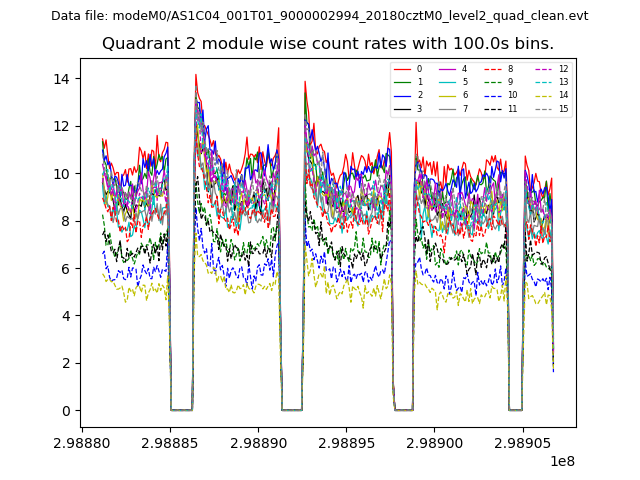
| Module-wise count rates for Quadrant C Data is divided into 100 sec bins |
 |
 |
| Module-wise count rates for Quadrant D Data is divided into 100 sec bins |
 |
 |
| Parameter | Plot |
|---|---|
| CZT HV Monitor | 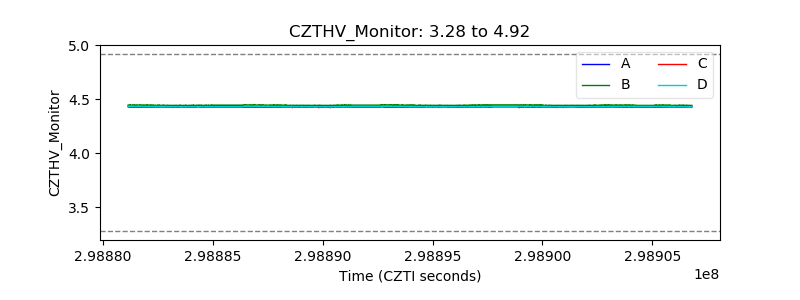 |
| D_VDD | 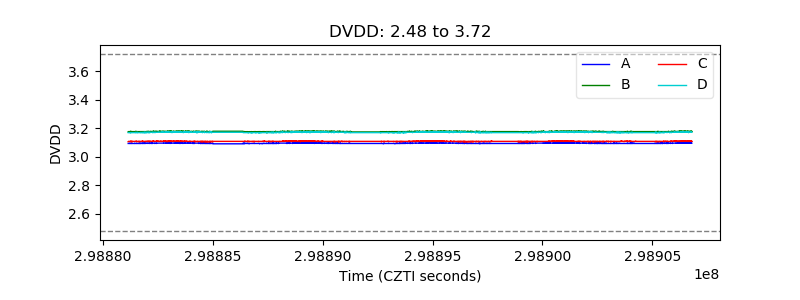 |
| Temperature 1 | 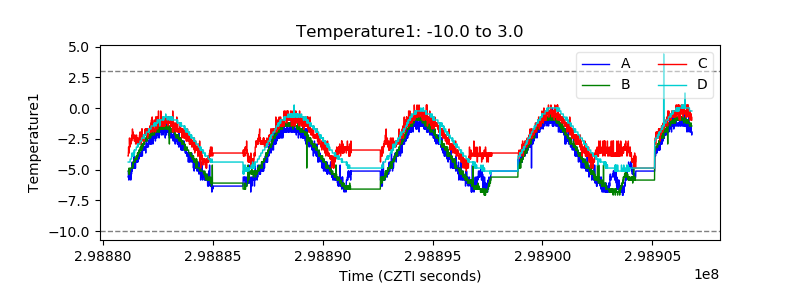 |
| Veto HV Monitor |  |
| Veto LLD | 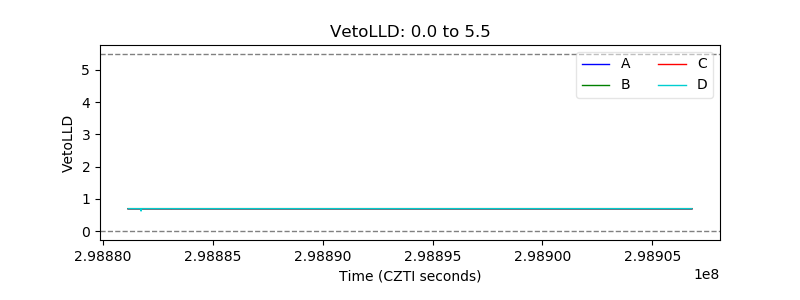 |
| Alpha Counter | 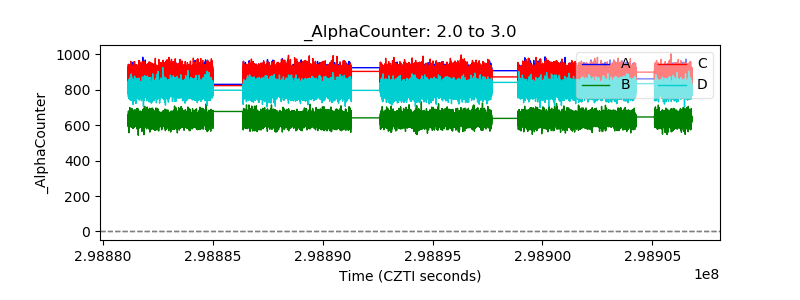 |
| _CPM_Rate | 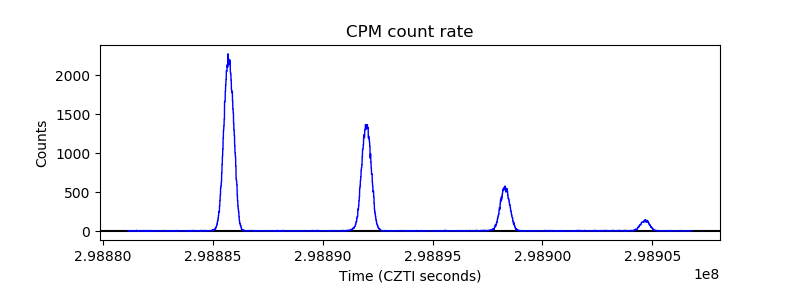 |
| CZT Counter | 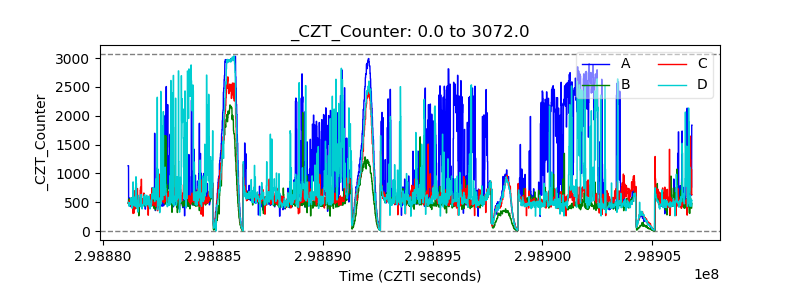 |
| +2.5 Volts monitor |  |
| +5 Volts monitor |  |
| _ROLL_ROT | 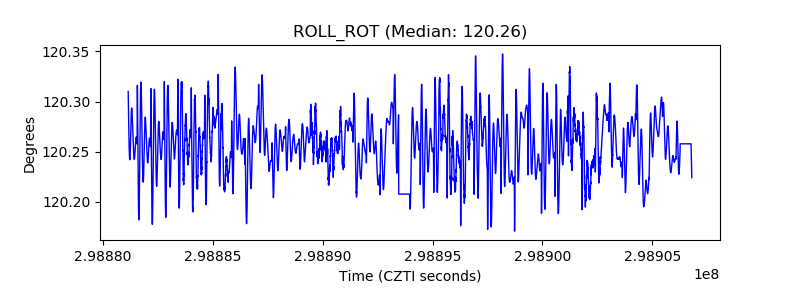 |
| _Roll_DEC | 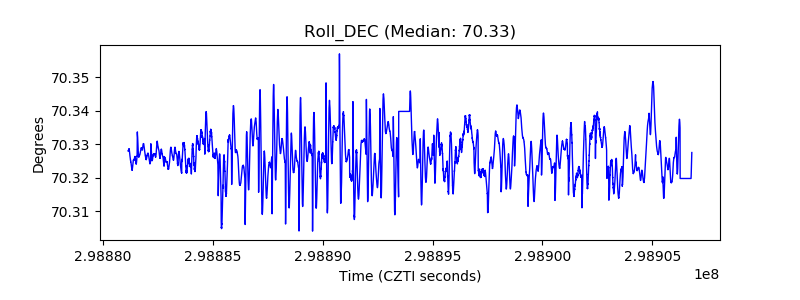 |
| _Roll_RA | 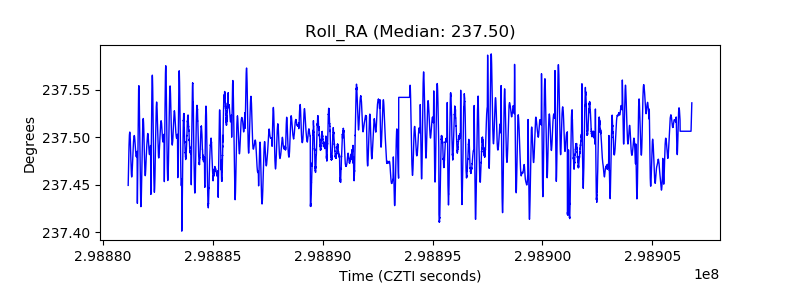 |
| Veto Counter | 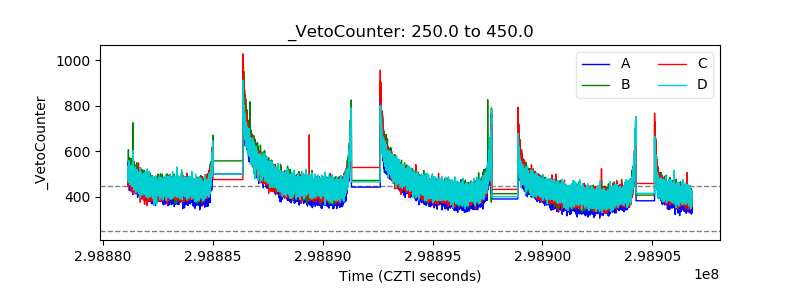 |