| Param | Original file | Final file |
|---|---|---|
| Filename | modeM0/AS1C04_001T01_9000002994_20181cztM0_level2.evt | modeM0/AS1C04_001T01_9000002994_20181cztM0_level2_quad_clean.evt |
| Size (bytes) | 1,048,579,200 | 213,816,960 |
| Size | 1000.0 MB | 203.9 MB |
| Events in quadrant A | 11,076,773 | 1,331,723 |
| Events in quadrant B | 5,693,363 | 1,495,704 |
| Events in quadrant C | 6,881,779 | 1,435,094 |
| Events in quadrant D | 7,331,079 | 1,420,486 |
| Mode SS | |||
|---|---|---|---|
| Quadrant | BADHDUFLAG | Total packets | Discarded packets |
| A | 0 | 232 | 0 |
| B | 0 | 232 | 0 |
| C | 0 | 232 | 0 |
| D | 0 | 232 | 0 |
| Mode M9 | |||
|---|---|---|---|
| Quadrant | BADHDUFLAG | Total packets | Discarded packets |
| A | 0 | 14 | 0 |
| B | 0 | 14 | 0 |
| C | 0 | 14 | 0 |
| D | 0 | 14 | 0 |
| Mode M0 | |||
|---|---|---|---|
| Quadrant | BADHDUFLAG | Total packets | Discarded packets |
| A | 0 | 40450 | 2 |
| B | 0 | 24317 | 2 |
| C | 0 | 27816 | 2 |
| D | 0 | 29544 | 2 |
| Quadrant | Total seconds | Saturated seconds | Saturation percentage |
|---|---|---|---|
| A | 11454 | 2325 | 20.298586% |
| B | 11454 | 170 | 1.484198% |
| C | 11454 | 302 | 2.636633% |
| D | 11454 | 588 | 5.133578% |
Noise dominated data is calculated using 1-second bins in cleaned event files. If a bin has >2000 counts, and if more than 50% of those come from <1% of pixels, then it is considered to be noise-dominated and hence unusable.
| Quadrant | # 1 sec bins | Bins with >0 counts | Bins with >2000 counts | High rate bins dominated by noise | Noise dominated (total time) | Noise dominated (detector-on time) | Marked lightcurve |
|---|---|---|---|---|---|---|---|
| A | 12785 | 11457 | 1824 | 1824 | 14.27% | 15.92% | 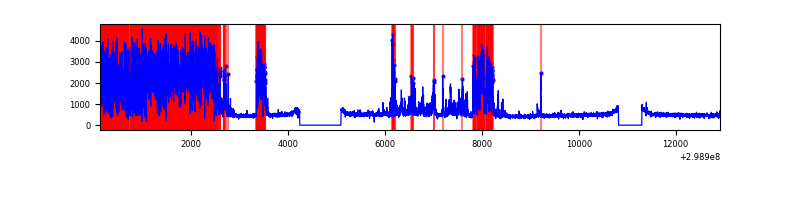 |
| B | 12785 | 11457 | 6 | 6 | 0.05% | 0.05% | 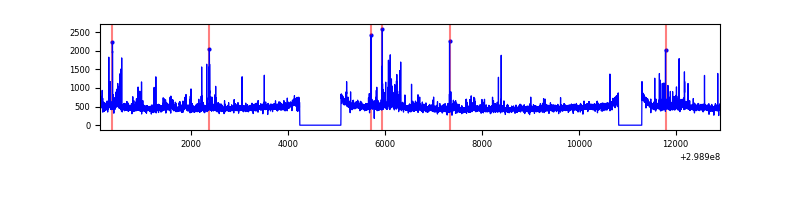 |
| C | 12785 | 11457 | 1 | 1 | 0.01% | 0.01% | 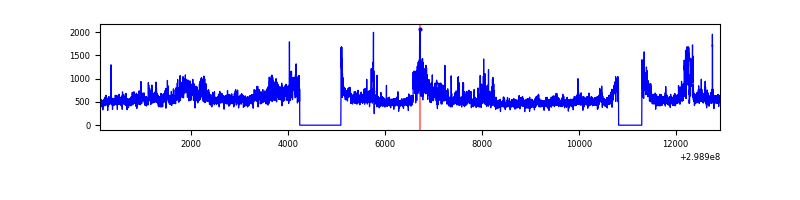 |
| D | 12785 | 11457 | 410 | 410 | 3.21% | 3.58% | 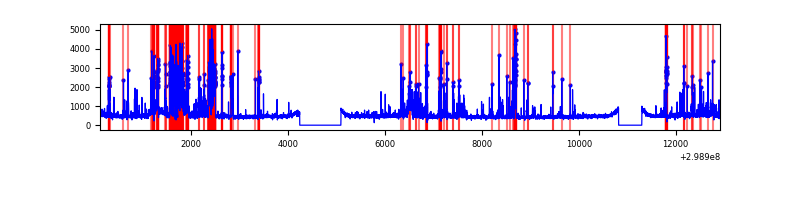 |
Top three noisy pixels from each quadrant. If the there are fewer than three noisy pixels in the level2.evt file, extra rows are filled as -1
| Pixel properties | Quadrant properties | ||||||
|---|---|---|---|---|---|---|---|
| Quadrant | DetID | PixID | Counts | Sigma | Mean | Median | Sigma |
| A | 14 | 238 | 6167434 | 24957.53 | 1237 | 1210 | 247.1 |
| A | 4 | 2 | 137790 | 552.8 | 1237 | 1210 | 247.1 |
| A | 13 | 254 | 15513 | 57.89 | 1237 | 1210 | 247.1 |
| B | 0 | 197 | 160314 | 633.13 | 1356 | 1324 | 251.1 |
| B | 0 | 190 | 64054 | 249.8 | 1356 | 1324 | 251.1 |
| B | 7 | 220 | 45044 | 174.1 | 1356 | 1324 | 251.1 |
| C | 3 | 233 | 1582927 | 5247.91 | 1305 | 1310 | 301.4 |
| C | 14 | 238 | 203529 | 670.98 | 1305 | 1310 | 301.4 |
| C | 13 | 61 | 9157 | 26.04 | 1305 | 1310 | 301.4 |
| D | 7 | 238 | 1114537 | 3511.58 | 1319 | 1282 | 317.0 |
| D | 9 | 1 | 377052 | 1185.31 | 1319 | 1282 | 317.0 |
| D | 15 | 0 | 238988 | 749.81 | 1319 | 1282 | 317.0 |
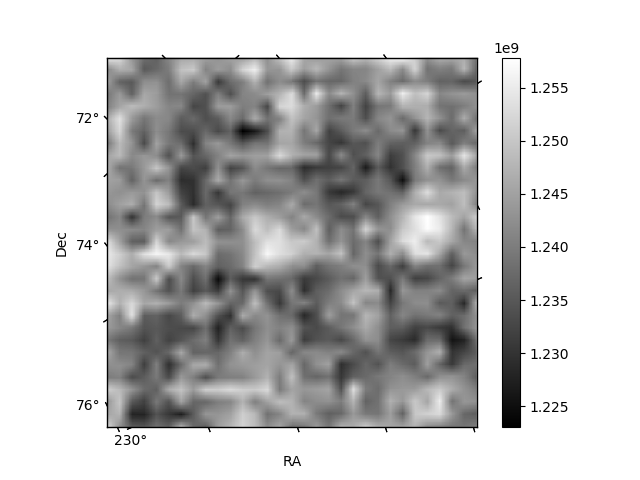
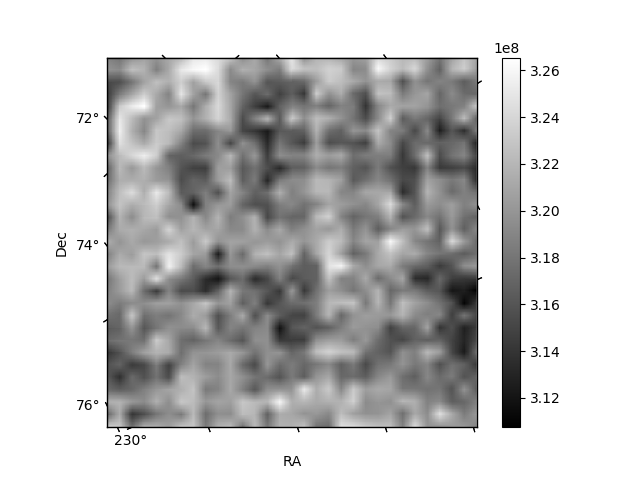
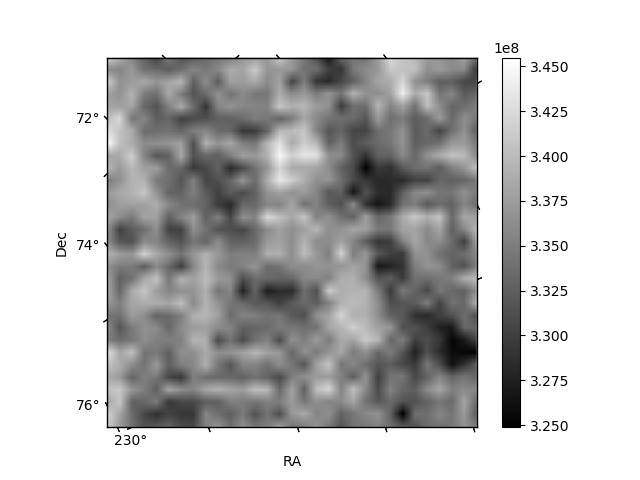
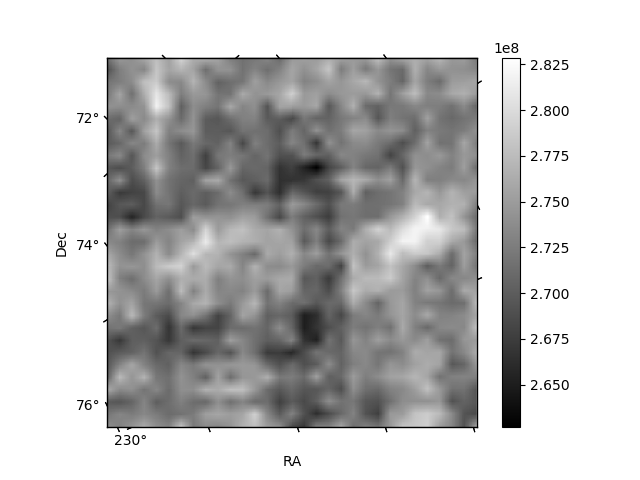
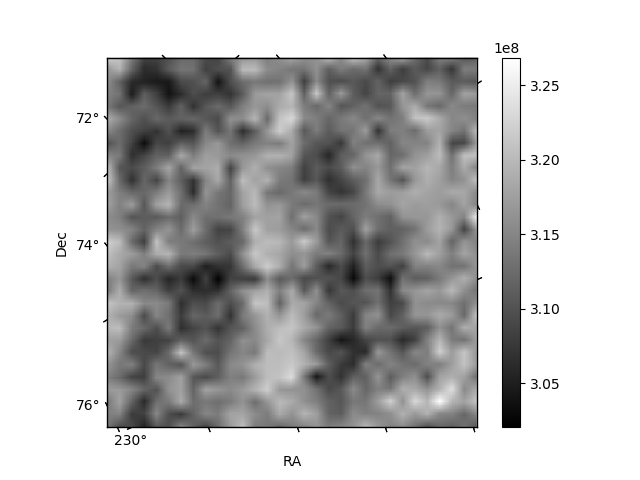
Histogram calculated using DETX and DETY for each event in the final _common_clean file
| Quadrant A | 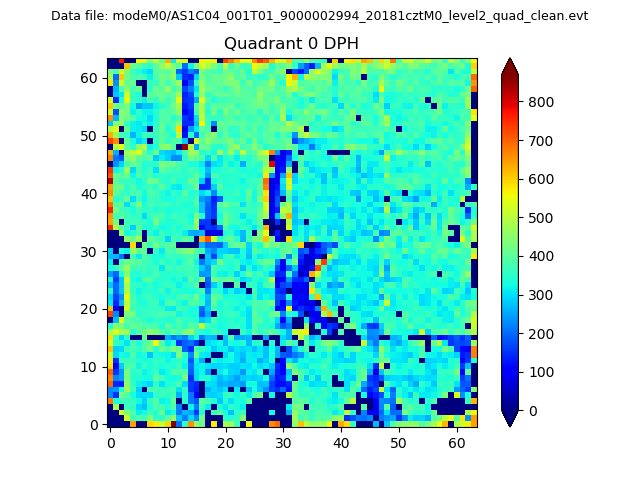 |
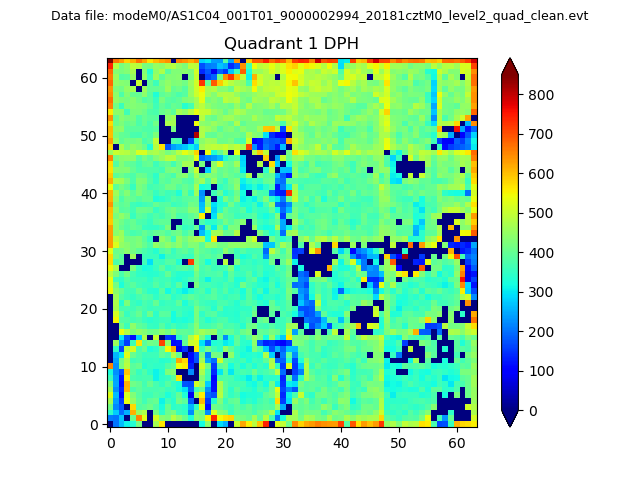 |
Quadrant B |
|---|---|---|---|
| Quadrant D | 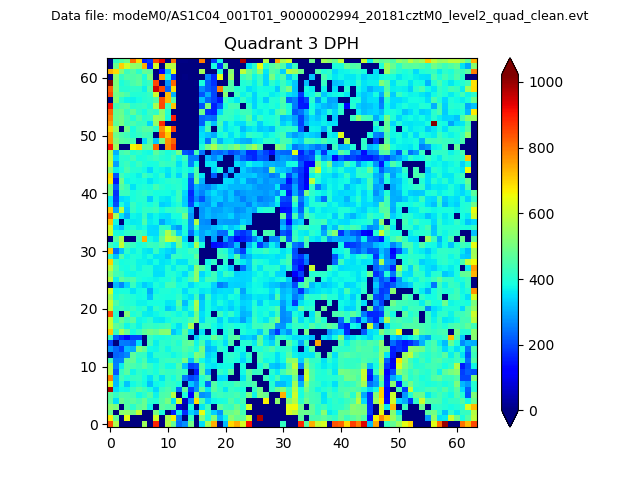 |
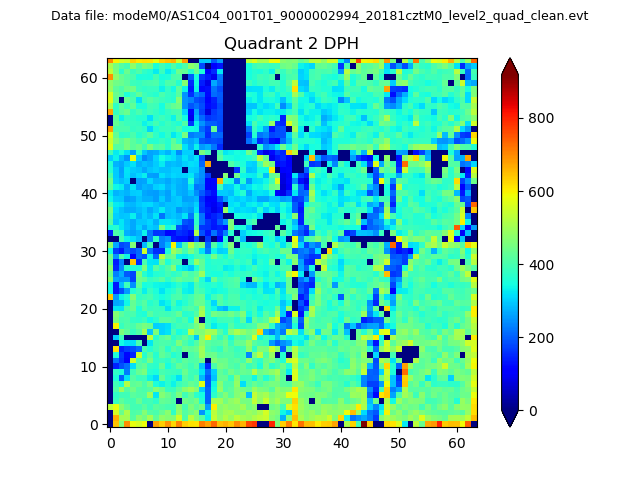 |
Quadrant C |
| Plot type | Count rate plots | Images |
|---|---|---|
| Comparison with Poisson distribution Blue bars denote a histogram of data divided into 1 sec bins. Red curve is a Poisson curve with rate = median count rate of data. |
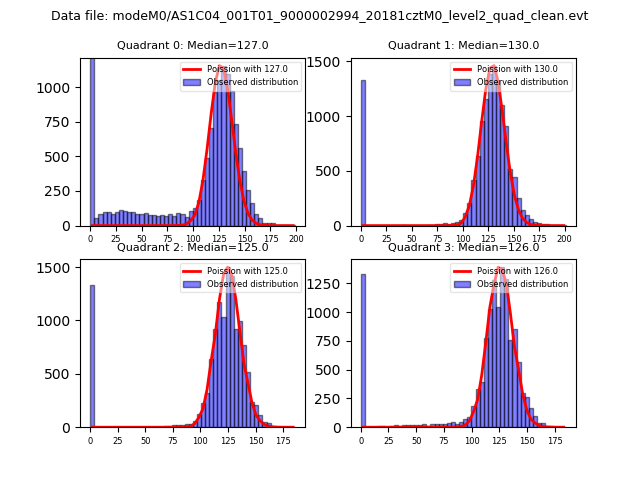 |
 |
| Quadrant-wise count rates Data is divided into 100 sec bins |
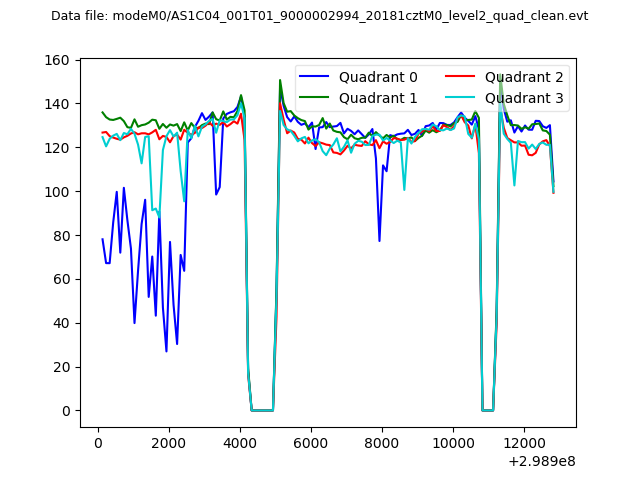 |
|
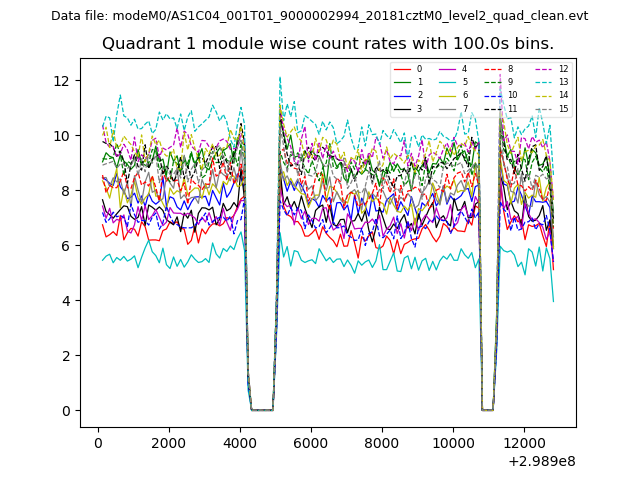
| Module-wise count rates for Quadrant A Data is divided into 100 sec bins |
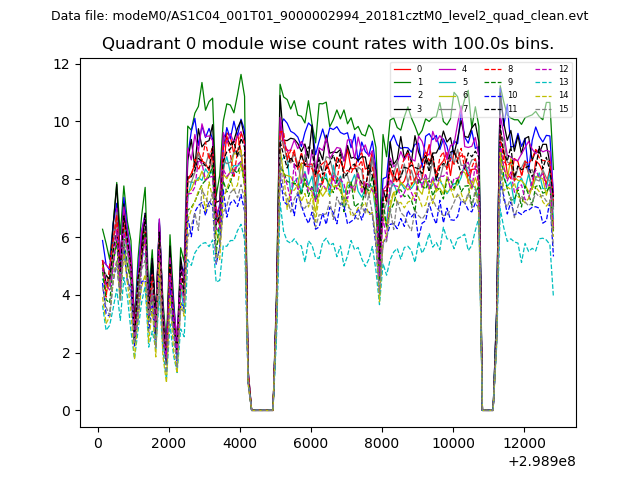 |
 |
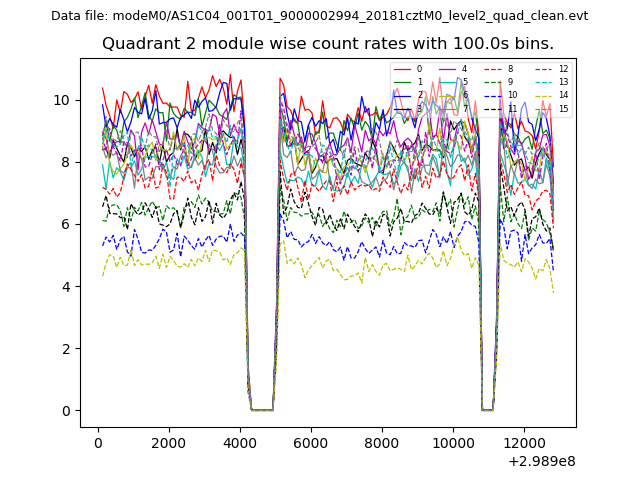
| Module-wise count rates for Quadrant B Data is divided into 100 sec bins |
 |
 |
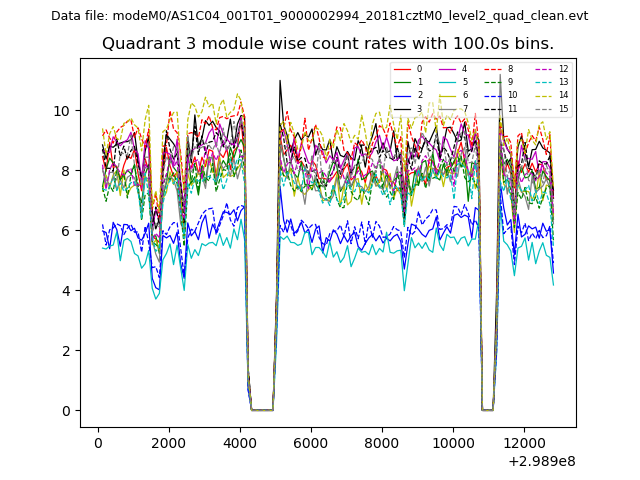
| Module-wise count rates for Quadrant C Data is divided into 100 sec bins |
 |
 |
| Module-wise count rates for Quadrant D Data is divided into 100 sec bins |
 |
 |
| Parameter | Plot |
|---|---|
| CZT HV Monitor | 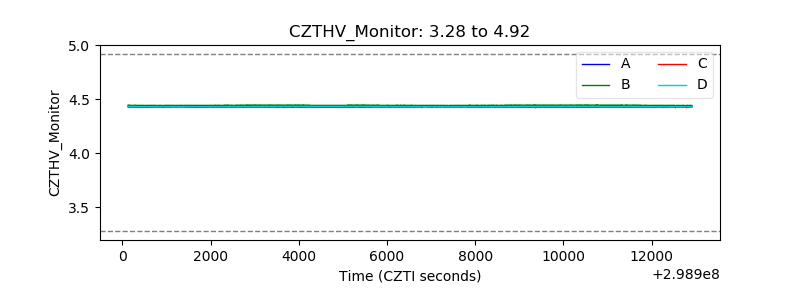 |
| D_VDD | 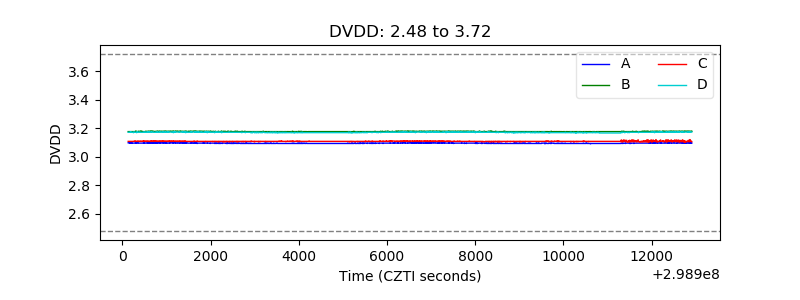 |
| Temperature 1 | 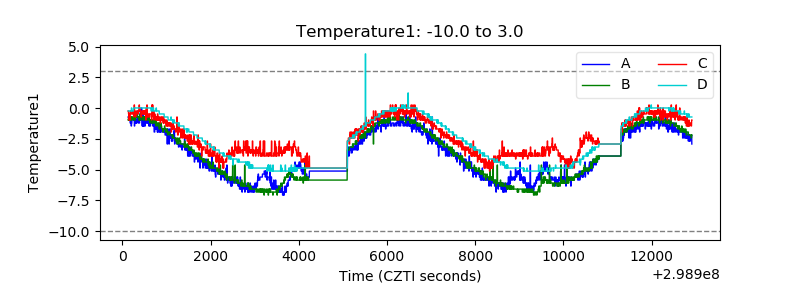 |
| Veto HV Monitor | 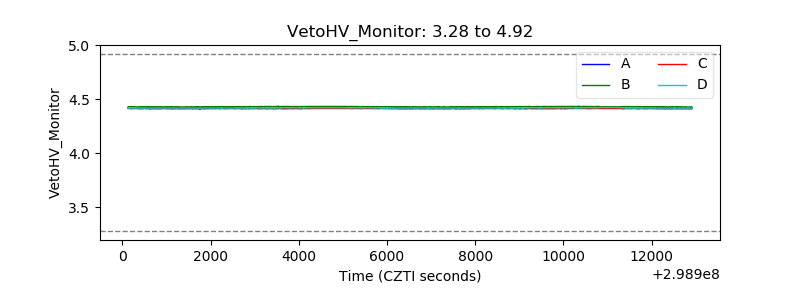 |
| Veto LLD | 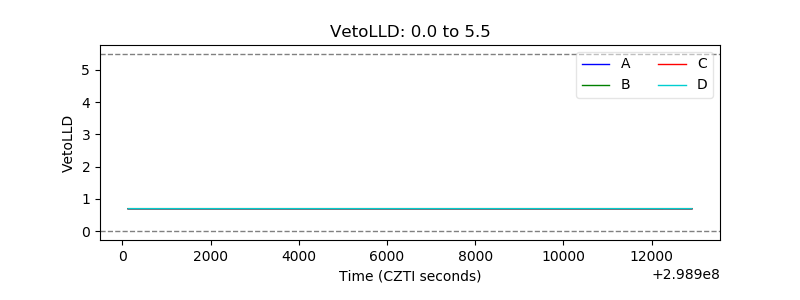 |
| Alpha Counter | 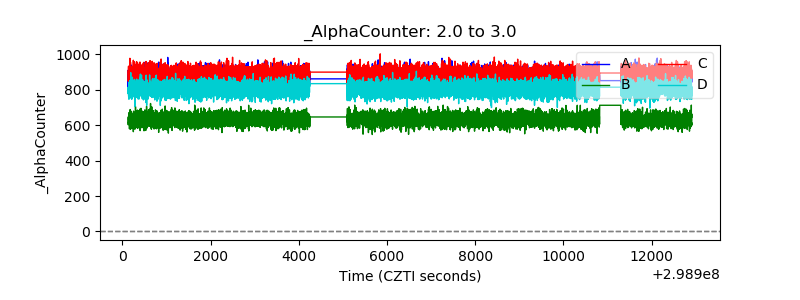 |
| _CPM_Rate | 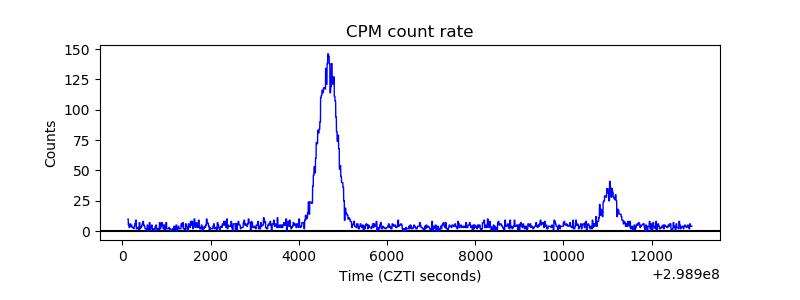 |
| CZT Counter | 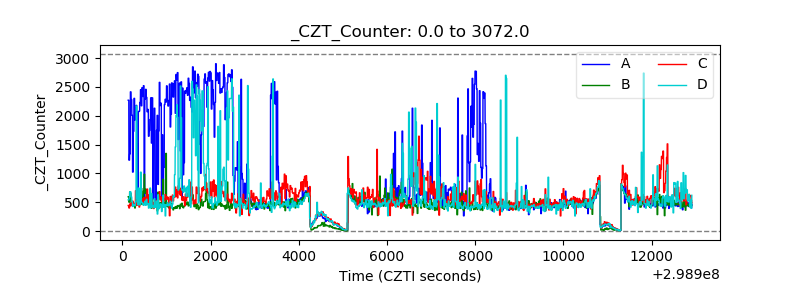 |
| +2.5 Volts monitor |  |
| +5 Volts monitor | 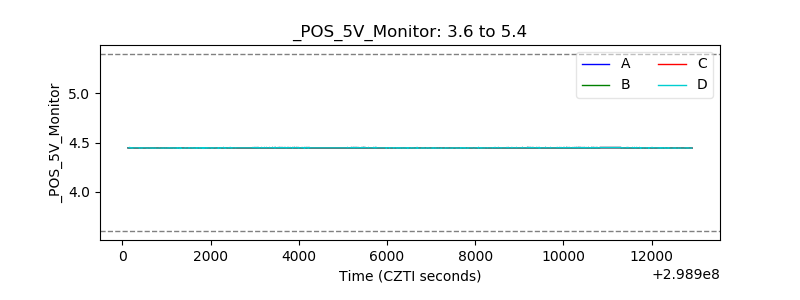 |
| _ROLL_ROT | 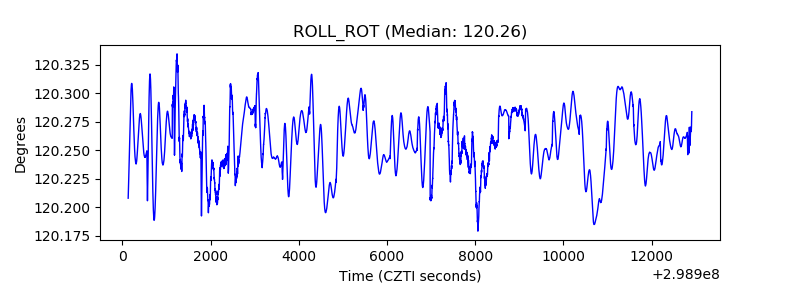 |
| _Roll_DEC | 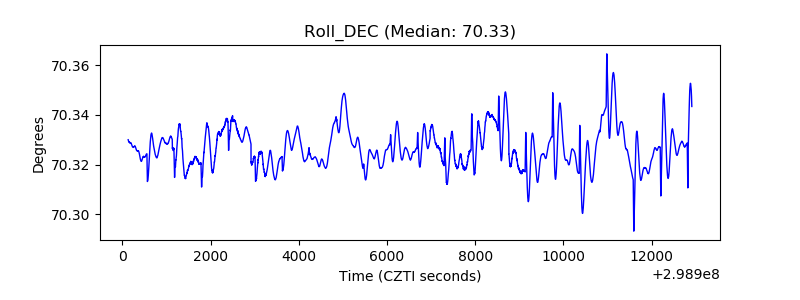 |
| _Roll_RA | 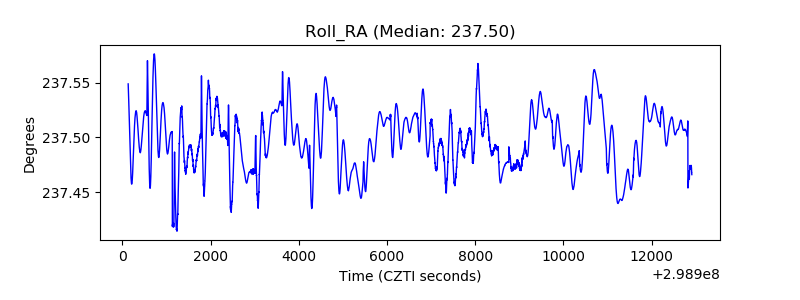 |
| Veto Counter | 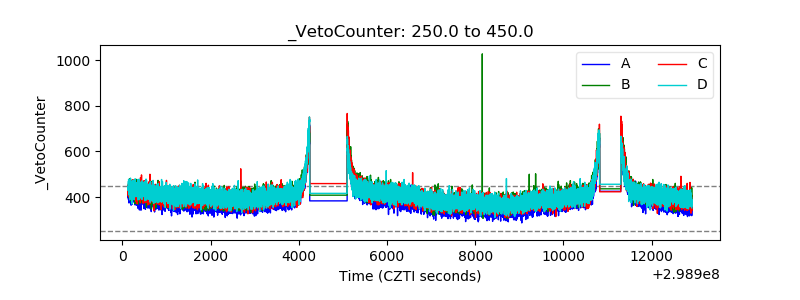 |