| Param | Original file | Final file |
|---|---|---|
| Filename | modeM0/AS1C04_001T01_9000002994_20182cztM0_level2.evt | modeM0/AS1C04_001T01_9000002994_20182cztM0_level2_quad_clean.evt |
| Size (bytes) | 544,049,280 | 137,318,400 |
| Size | 518.8 MB | 131.0 MB |
| Events in quadrant A | 3,467,452 | 938,395 |
| Events in quadrant B | 3,697,326 | 931,812 |
| Events in quadrant C | 4,492,357 | 892,759 |
| Events in quadrant D | 4,322,581 | 886,310 |
| Mode SS | |||
|---|---|---|---|
| Quadrant | BADHDUFLAG | Total packets | Discarded packets |
| A | 0 | 148 | 0 |
| B | 0 | 148 | 0 |
| C | 0 | 148 | 0 |
| D | 0 | 148 | 0 |
| Mode M9 | |||
|---|---|---|---|
| Quadrant | BADHDUFLAG | Total packets | Discarded packets |
| A | 0 | 2 | 0 |
| B | 0 | 2 | 0 |
| C | 0 | 2 | 0 |
| D | 0 | 2 | 0 |
| Mode M0 | |||
|---|---|---|---|
| Quadrant | BADHDUFLAG | Total packets | Discarded packets |
| A | 0 | 15252 | 1 |
| B | 0 | 15730 | 1 |
| C | 0 | 18264 | 1 |
| D | 0 | 17836 | 1 |
| Quadrant | Total seconds | Saturated seconds | Saturation percentage |
|---|---|---|---|
| A | 7324 | 107 | 1.460950% |
| B | 7324 | 150 | 2.048061% |
| C | 7323 | 208 | 2.840366% |
| D | 7324 | 210 | 2.867286% |
Noise dominated data is calculated using 1-second bins in cleaned event files. If a bin has >2000 counts, and if more than 50% of those come from <1% of pixels, then it is considered to be noise-dominated and hence unusable.
| Quadrant | # 1 sec bins | Bins with >0 counts | Bins with >2000 counts | High rate bins dominated by noise | Noise dominated (total time) | Noise dominated (detector-on time) | Marked lightcurve |
|---|---|---|---|---|---|---|---|
| A | 7549 | 7326 | 2 | 2 | 0.03% | 0.03% | 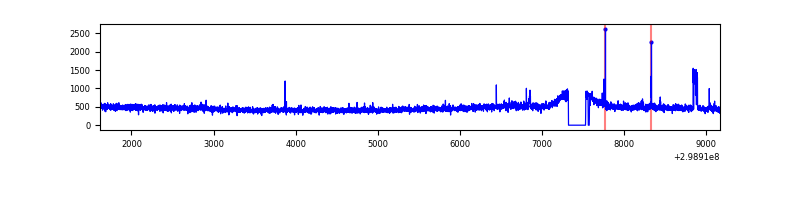 |
| B | 7549 | 7326 | 15 | 15 | 0.20% | 0.20% | 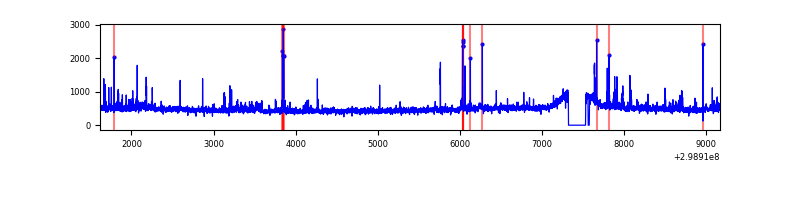 |
| C | 7548 | 7325 | 2 | 2 | 0.03% | 0.03% | 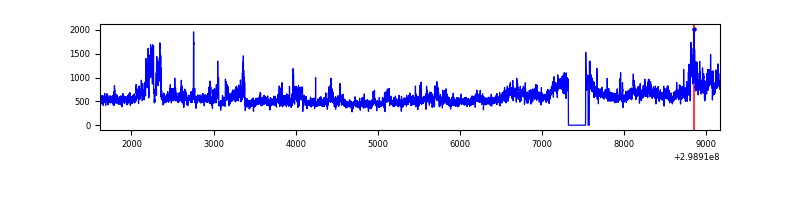 |
| D | 7549 | 7326 | 91 | 91 | 1.21% | 1.24% | 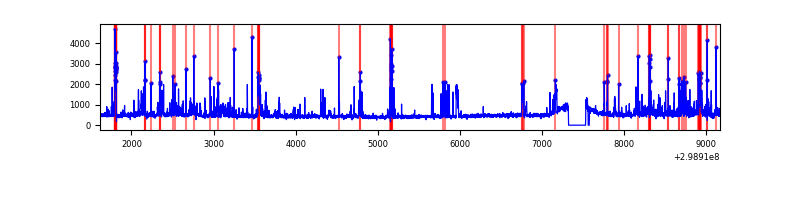 |
Top three noisy pixels from each quadrant. If the there are fewer than three noisy pixels in the level2.evt file, extra rows are filled as -1
| Pixel properties | Quadrant properties | ||||||
|---|---|---|---|---|---|---|---|
| Quadrant | DetID | PixID | Counts | Sigma | Mean | Median | Sigma |
| A | 14 | 111 | 45121 | 250.74 | 877 | 858 | 176.5 |
| A | 14 | 238 | 29245 | 160.81 | 877 | 858 | 176.5 |
| A | 13 | 254 | 11170 | 58.42 | 877 | 858 | 176.5 |
| B | 0 | 197 | 139015 | 830.54 | 871 | 850 | 166.4 |
| B | 0 | 190 | 40721 | 239.67 | 871 | 850 | 166.4 |
| B | 5 | 172 | 37940 | 222.95 | 871 | 850 | 166.4 |
| C | 3 | 233 | 1073098 | 5478.62 | 839 | 843 | 195.7 |
| C | 14 | 238 | 129777 | 658.78 | 839 | 843 | 195.7 |
| C | 8 | 128 | 10147 | 47.54 | 839 | 843 | 195.7 |
| D | 15 | 0 | 249198 | 1194.69 | 858 | 831 | 207.9 |
| D | 1 | 52 | 214530 | 1027.93 | 858 | 831 | 207.9 |
| D | 7 | 238 | 140888 | 673.7 | 858 | 831 | 207.9 |
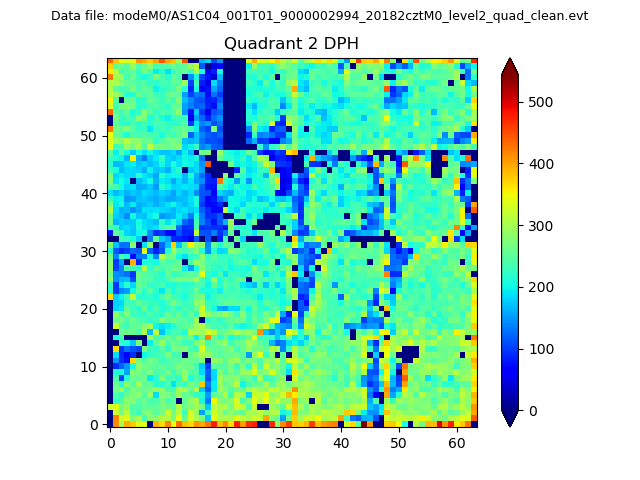
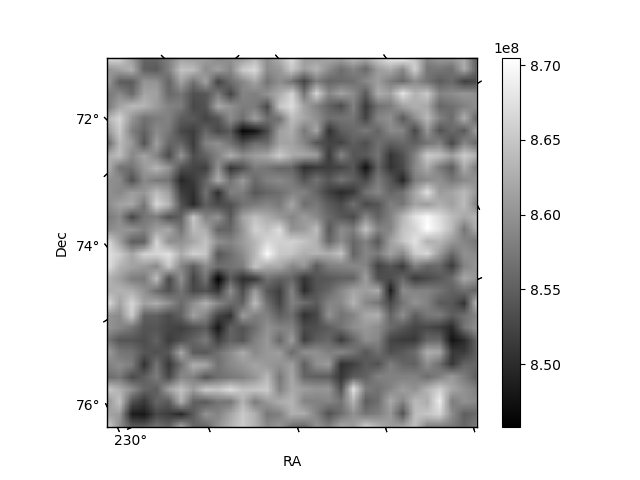
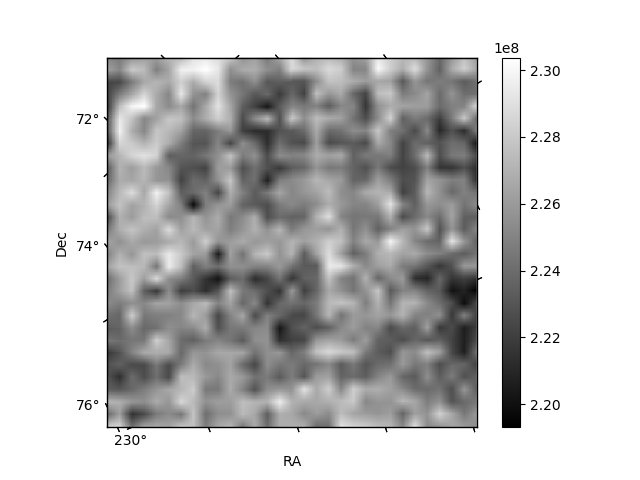
Histogram calculated using DETX and DETY for each event in the final _common_clean file
| Quadrant A | 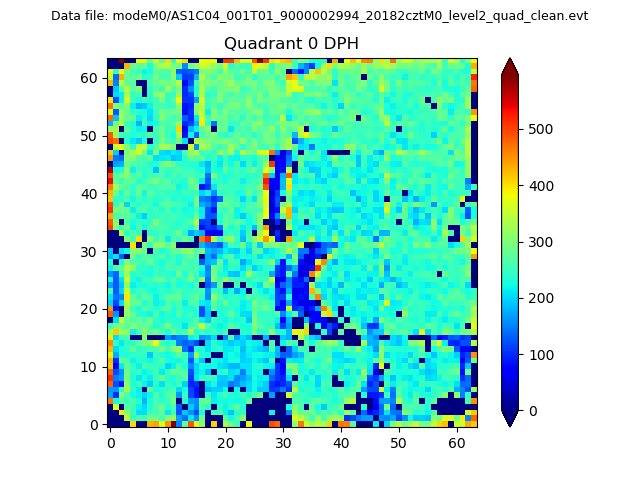 |
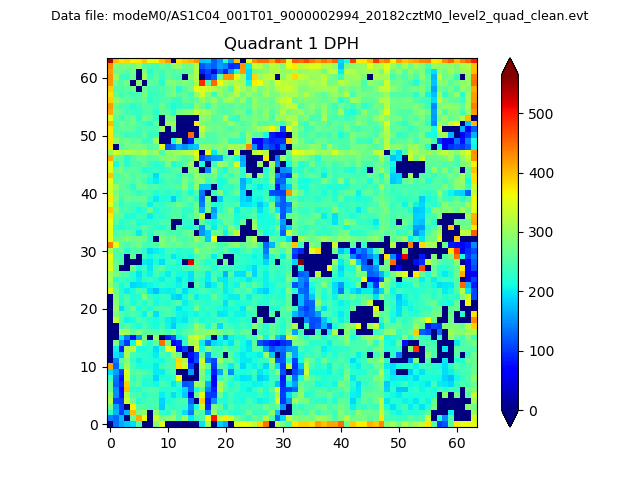 |
Quadrant B |
|---|---|---|---|
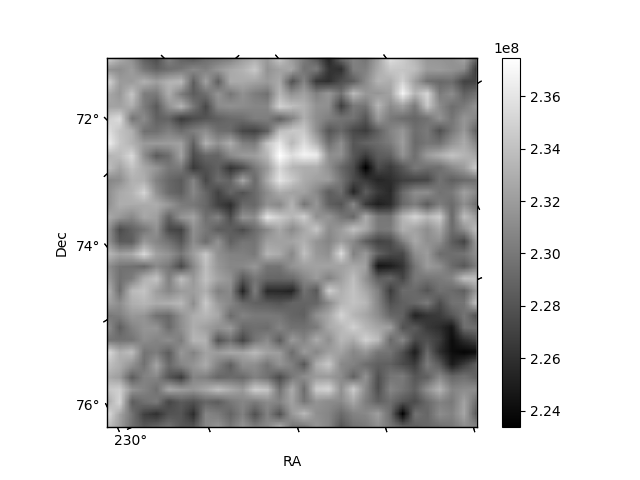
| Quadrant D | 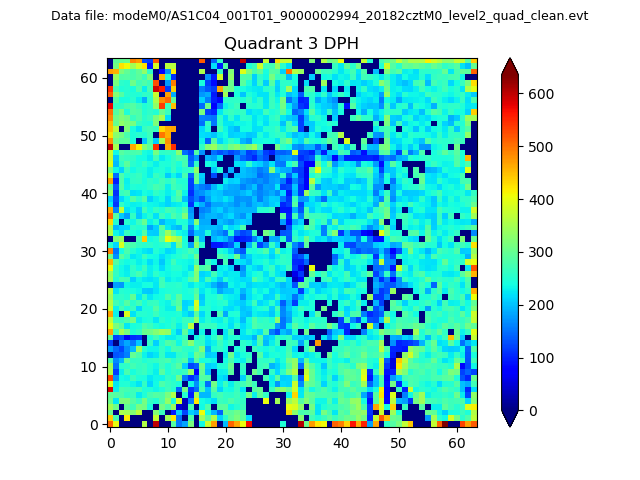 |
 |
Quadrant C |
| Plot type | Count rate plots | Images |
|---|---|---|
| Comparison with Poisson distribution Blue bars denote a histogram of data divided into 1 sec bins. Red curve is a Poisson curve with rate = median count rate of data. |
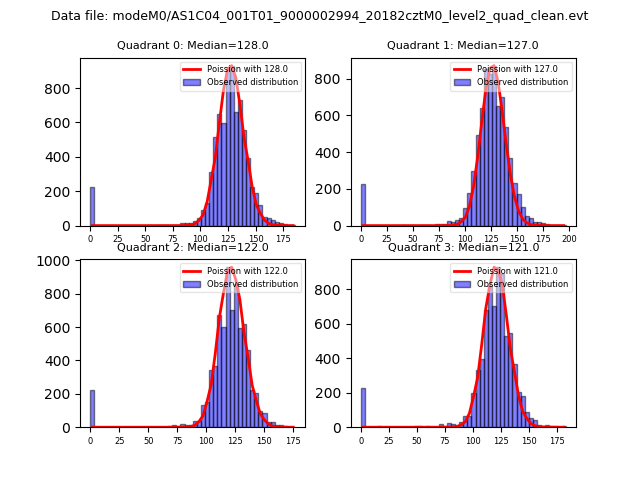 |
 |
| Quadrant-wise count rates Data is divided into 100 sec bins |
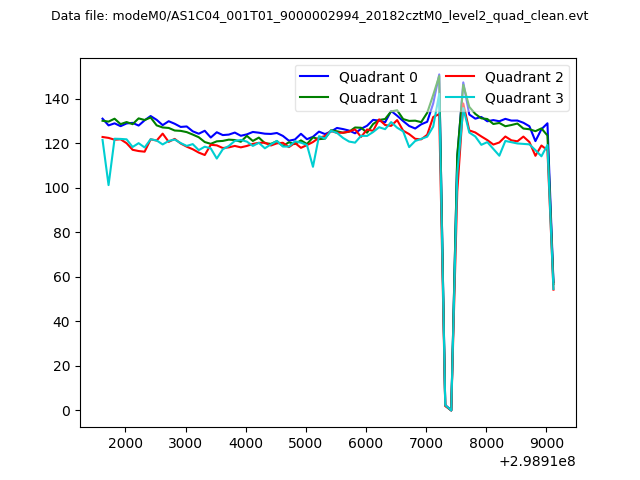 |
|
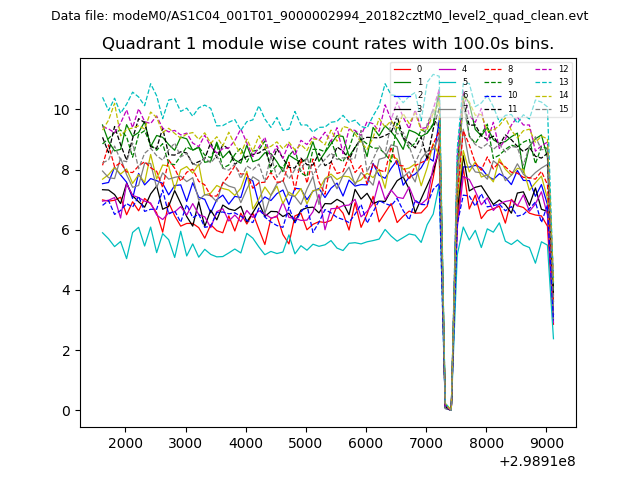
| Module-wise count rates for Quadrant A Data is divided into 100 sec bins |
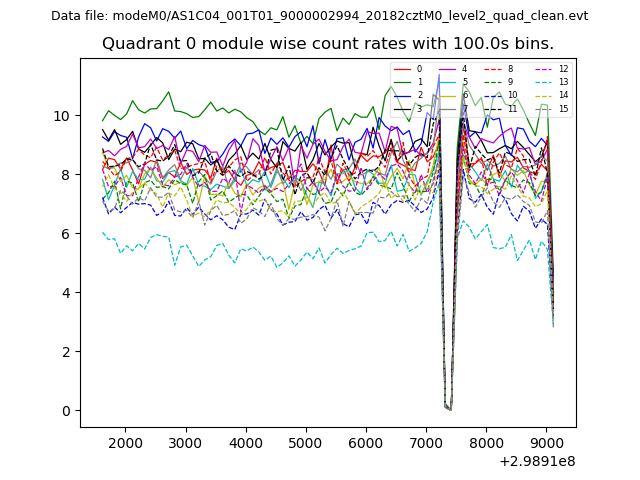 |
 |
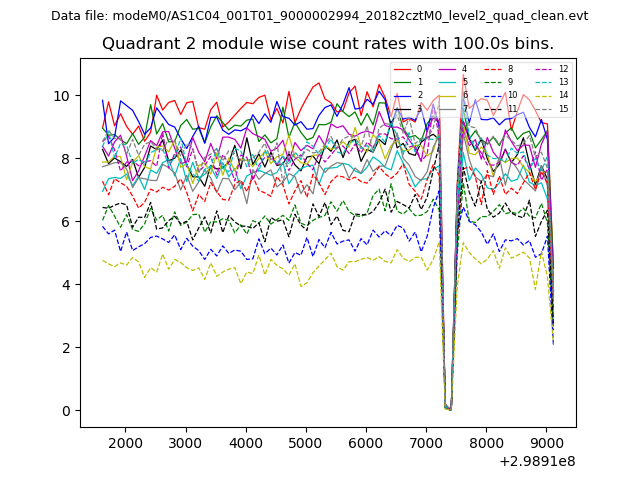
| Module-wise count rates for Quadrant B Data is divided into 100 sec bins |
 |
 |
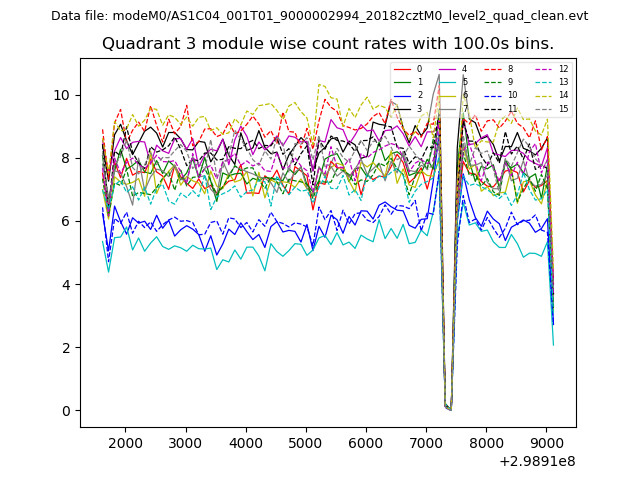
| Module-wise count rates for Quadrant C Data is divided into 100 sec bins |
 |
 |
| Module-wise count rates for Quadrant D Data is divided into 100 sec bins |
 |
 |
| Parameter | Plot |
|---|---|
| CZT HV Monitor | 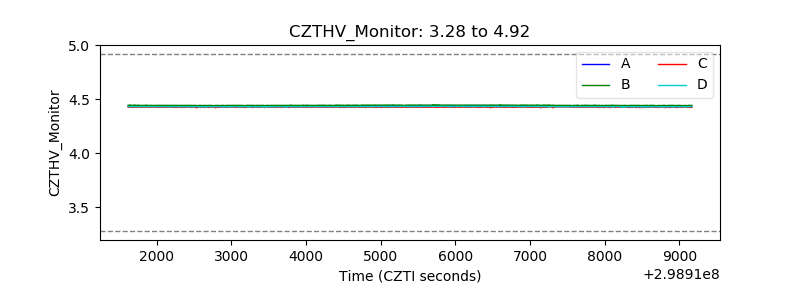 |
| D_VDD | 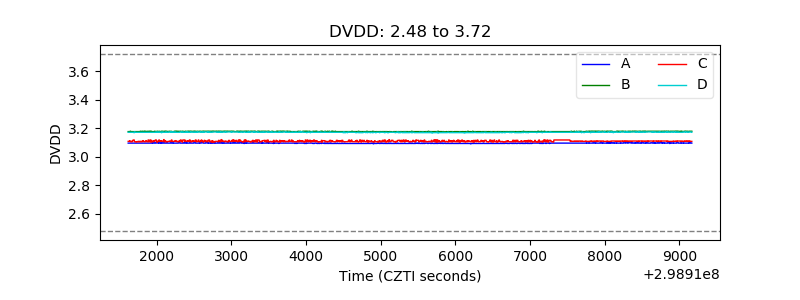 |
| Temperature 1 | 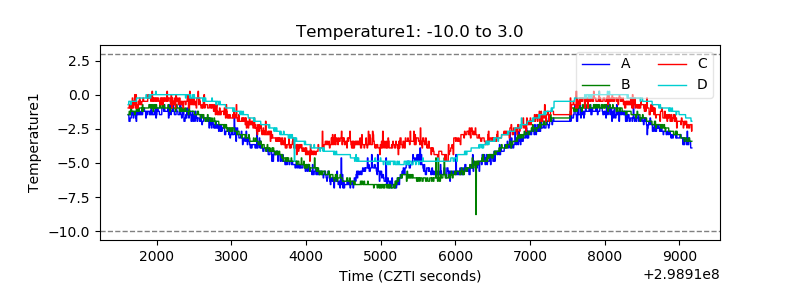 |
| Veto HV Monitor | 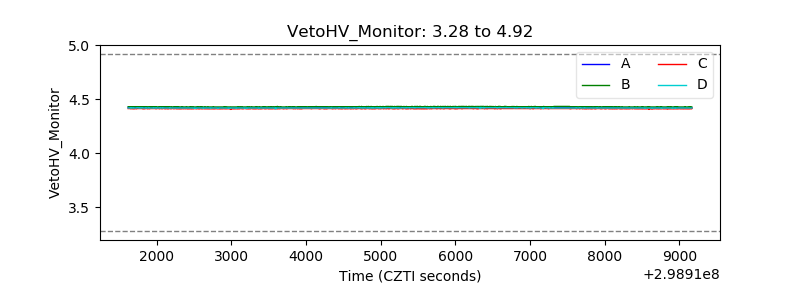 |
| Veto LLD | 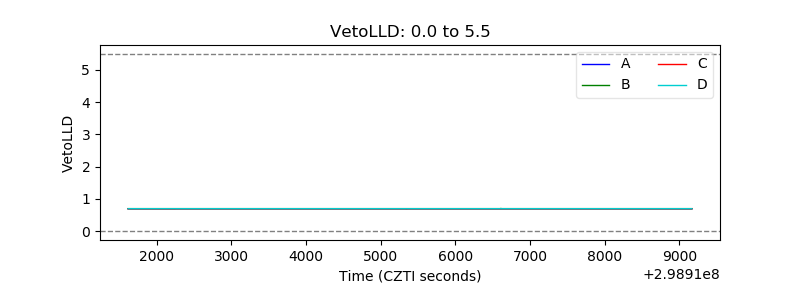 |
| Alpha Counter | 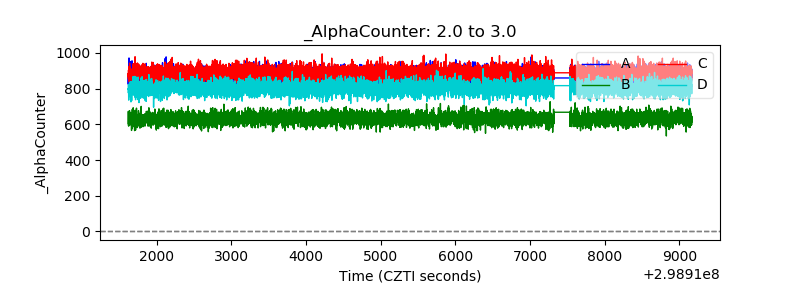 |
| _CPM_Rate | 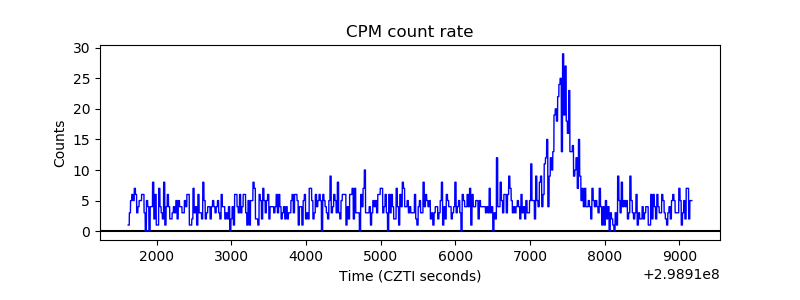 |
| CZT Counter | 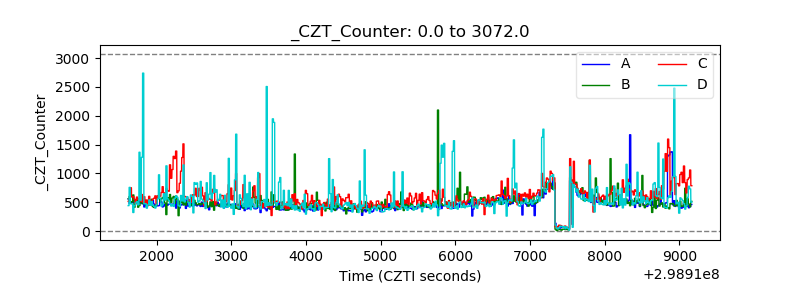 |
| +2.5 Volts monitor |  |
| +5 Volts monitor |  |
| _ROLL_ROT | 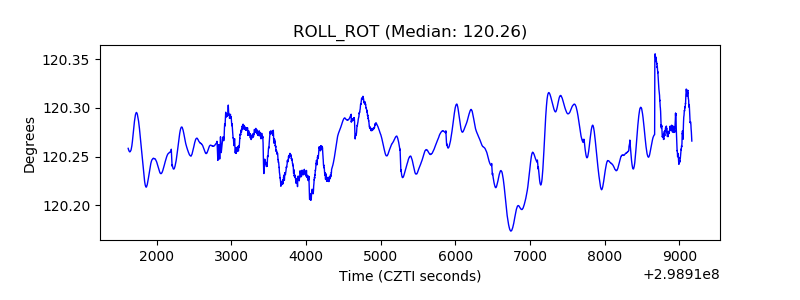 |
| _Roll_DEC |  |
| _Roll_RA | 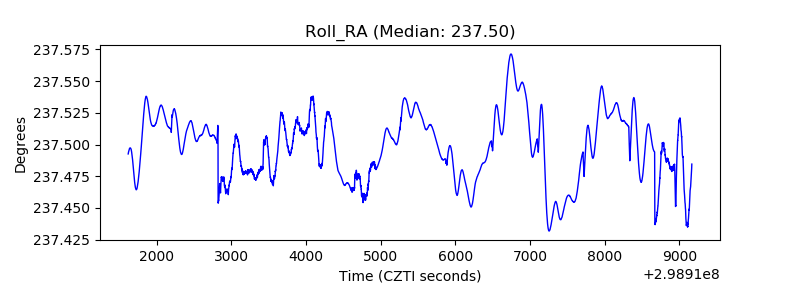 |
| Veto Counter | 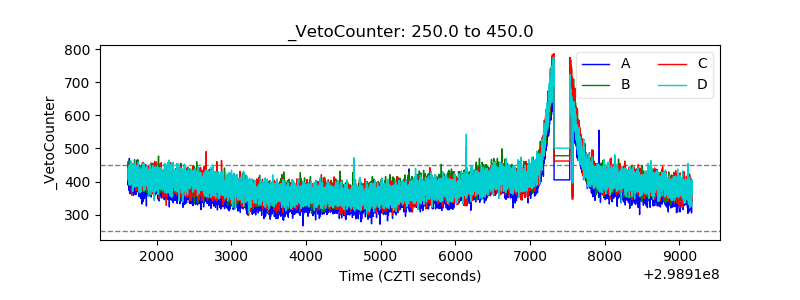 |