| Param | Original file | Final file |
|---|---|---|
| Filename | modeM0/AS1C04_001T01_9000002994_20185cztM0_level2.evt | modeM0/AS1C04_001T01_9000002994_20185cztM0_level2_quad_clean.evt |
| Size (bytes) | 914,158,080 | 233,464,320 |
| Size | 871.8 MB | 222.6 MB |
| Events in quadrant A | 5,776,854 | 1,583,353 |
| Events in quadrant B | 6,479,997 | 1,568,786 |
| Events in quadrant C | 7,713,086 | 1,526,816 |
| Events in quadrant D | 6,858,443 | 1,517,240 |
| Mode SS | |||
|---|---|---|---|
| Quadrant | BADHDUFLAG | Total packets | Discarded packets |
| A | 0 | 256 | 0 |
| B | 0 | 256 | 0 |
| C | 0 | 256 | 0 |
| D | 0 | 256 | 0 |
| Mode M9 | |||
|---|---|---|---|
| Quadrant | BADHDUFLAG | Total packets | Discarded packets |
| A | 0 | 13 | 0 |
| B | 0 | 13 | 0 |
| C | 0 | 13 | 0 |
| D | 0 | 13 | 0 |
| Mode M0 | |||
|---|---|---|---|
| Quadrant | BADHDUFLAG | Total packets | Discarded packets |
| A | 0 | 25965 | 2 |
| B | 0 | 27946 | 2 |
| C | 0 | 31457 | 2 |
| D | 0 | 29540 | 3 |
| Quadrant | Total seconds | Saturated seconds | Saturation percentage |
|---|---|---|---|
| A | 12673 | 41 | 0.323522% |
| B | 12674 | 138 | 1.088843% |
| C | 12674 | 212 | 1.672716% |
| D | 12673 | 212 | 1.672848% |
Noise dominated data is calculated using 1-second bins in cleaned event files. If a bin has >2000 counts, and if more than 50% of those come from <1% of pixels, then it is considered to be noise-dominated and hence unusable.
| Quadrant | # 1 sec bins | Bins with >0 counts | Bins with >2000 counts | High rate bins dominated by noise | Noise dominated (total time) | Noise dominated (detector-on time) | Marked lightcurve |
|---|---|---|---|---|---|---|---|
| A | 13918 | 12675 | 9 | 9 | 0.06% | 0.07% | 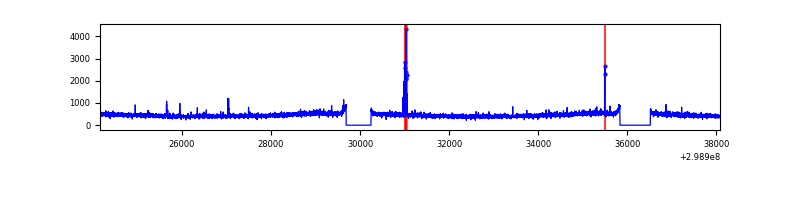 |
| B | 13919 | 12676 | 44 | 44 | 0.32% | 0.35% | 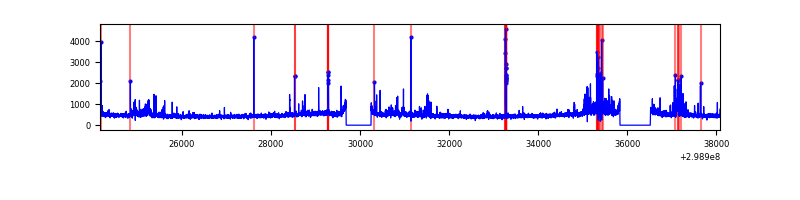 |
| C | 13919 | 12676 | 13 | 13 | 0.09% | 0.10% | 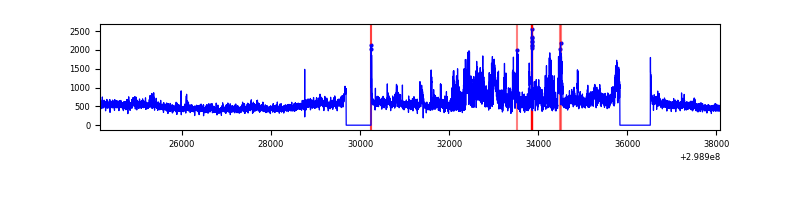 |
| D | 13918 | 12675 | 120 | 120 | 0.86% | 0.95% | 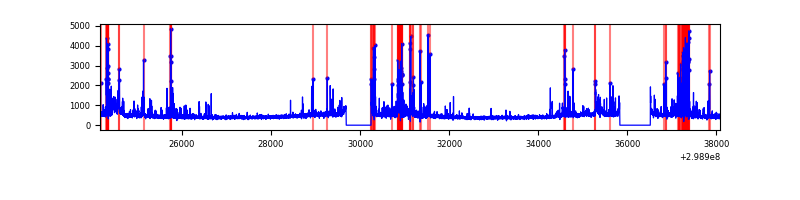 |
Top three noisy pixels from each quadrant. If the there are fewer than three noisy pixels in the level2.evt file, extra rows are filled as -1
| Pixel properties | Quadrant properties | ||||||
|---|---|---|---|---|---|---|---|
| Quadrant | DetID | PixID | Counts | Sigma | Mean | Median | Sigma |
| A | 4 | 2 | 81103 | 267.03 | 1470 | 1432 | 298.4 |
| A | 0 | 253 | 18664 | 57.76 | 1470 | 1432 | 298.4 |
| A | 13 | 254 | 18043 | 55.67 | 1470 | 1432 | 298.4 |
| B | 0 | 197 | 249155 | 894.95 | 1460 | 1419 | 276.8 |
| B | 7 | 220 | 145343 | 519.93 | 1460 | 1419 | 276.8 |
| B | 4 | 171 | 84525 | 300.22 | 1460 | 1419 | 276.8 |
| C | 3 | 233 | 1971592 | 5973.49 | 1414 | 1420 | 329.8 |
| C | 14 | 238 | 217974 | 656.58 | 1414 | 1420 | 329.8 |
| C | 13 | 61 | 9807 | 25.43 | 1414 | 1420 | 329.8 |
| D | 9 | 1 | 556929 | 1599.27 | 1437 | 1395 | 347.4 |
| D | 7 | 238 | 324295 | 929.57 | 1437 | 1395 | 347.4 |
| D | 13 | 172 | 115325 | 327.98 | 1437 | 1395 | 347.4 |
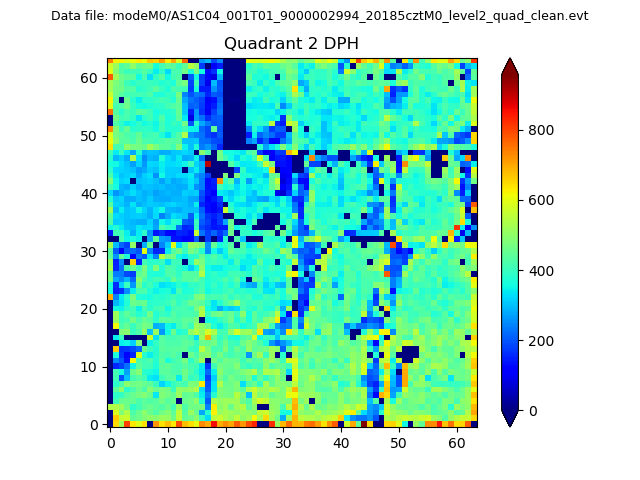
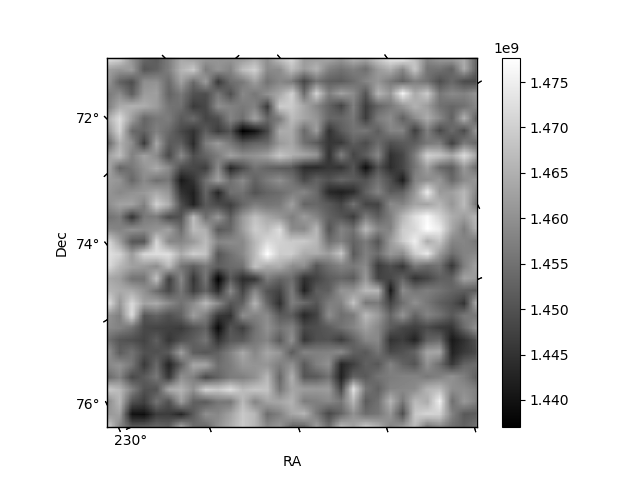
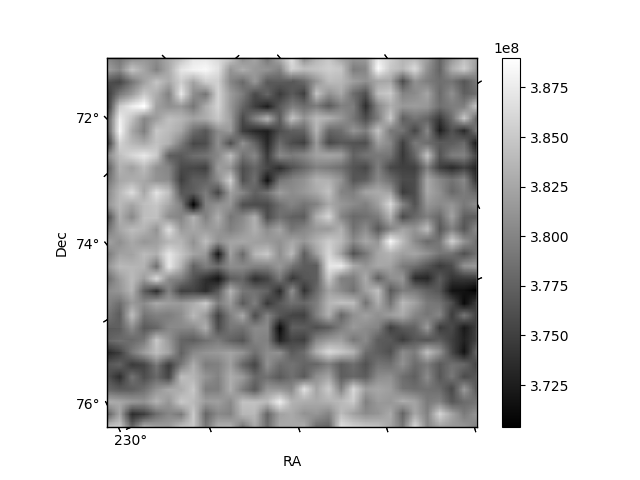
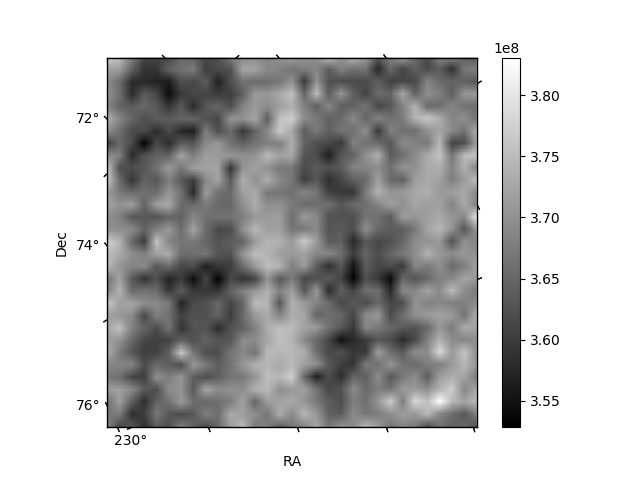
Histogram calculated using DETX and DETY for each event in the final _common_clean file
| Quadrant A | 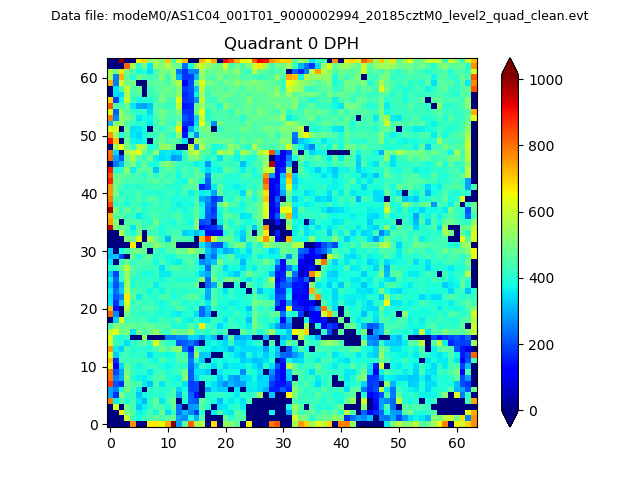 |
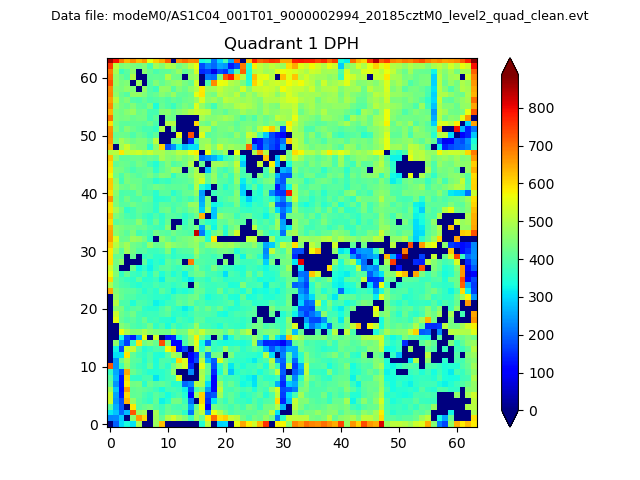 |
Quadrant B |
|---|---|---|---|
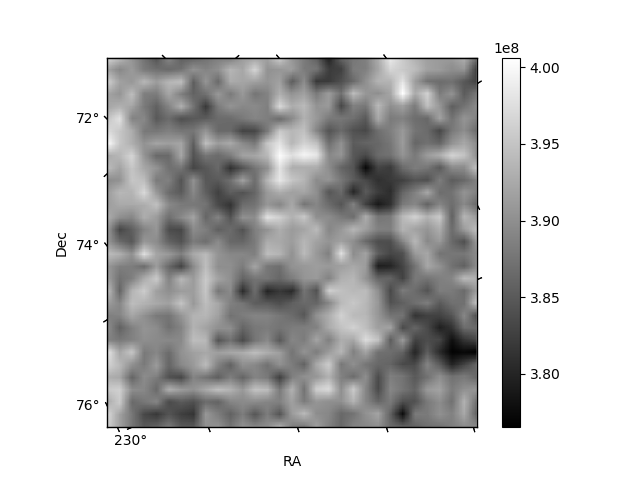
| Quadrant D | 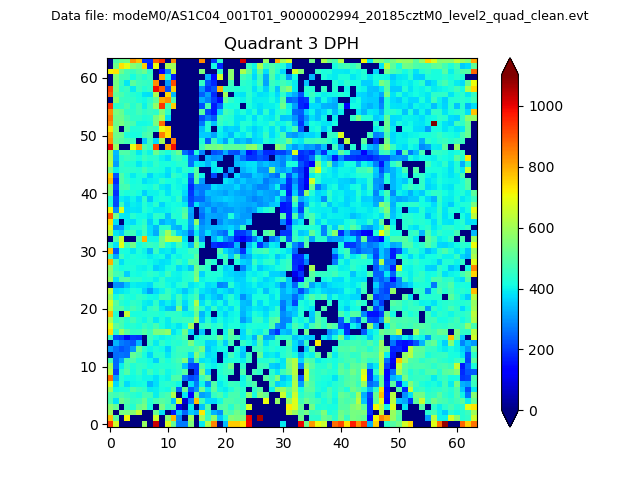 |
 |
Quadrant C |
| Plot type | Count rate plots | Images |
|---|---|---|
| Comparison with Poisson distribution Blue bars denote a histogram of data divided into 1 sec bins. Red curve is a Poisson curve with rate = median count rate of data. |
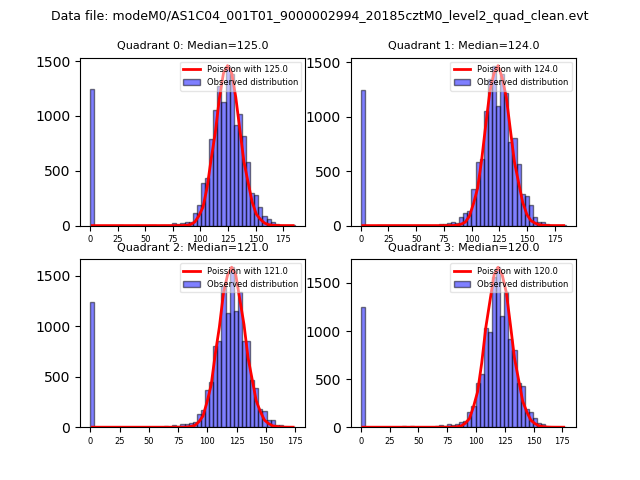 |
 |
| Quadrant-wise count rates Data is divided into 100 sec bins |
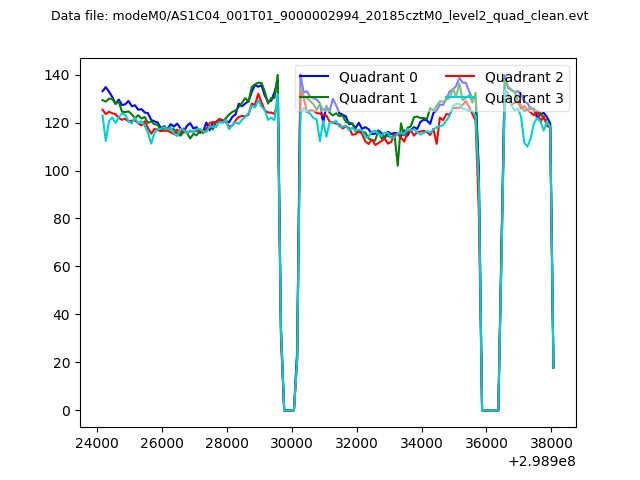 |
|
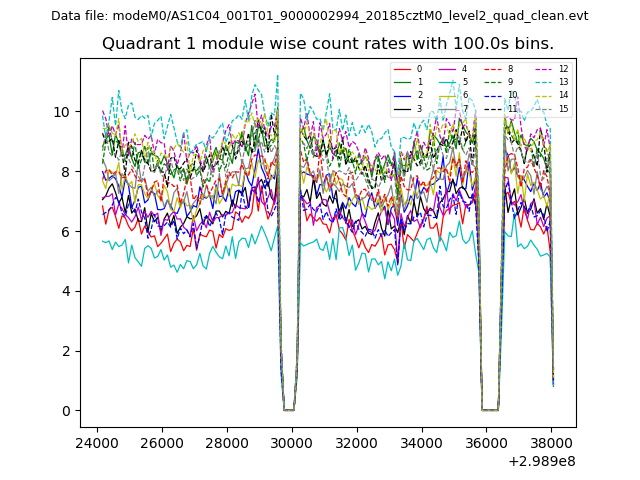
| Module-wise count rates for Quadrant A Data is divided into 100 sec bins |
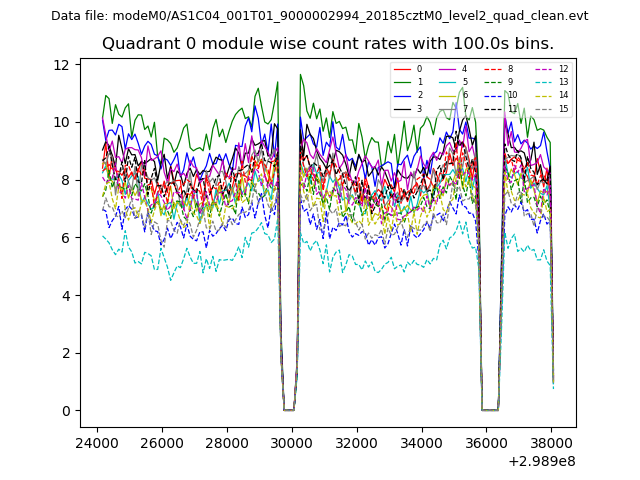 |
 |
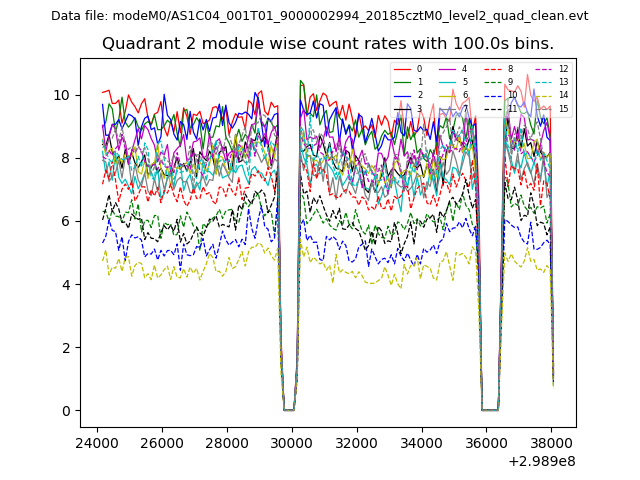
| Module-wise count rates for Quadrant B Data is divided into 100 sec bins |
 |
 |
| Module-wise count rates for Quadrant C Data is divided into 100 sec bins |
 |
 |
| Module-wise count rates for Quadrant D Data is divided into 100 sec bins |
 |
 |
| Parameter | Plot |
|---|---|
| CZT HV Monitor | 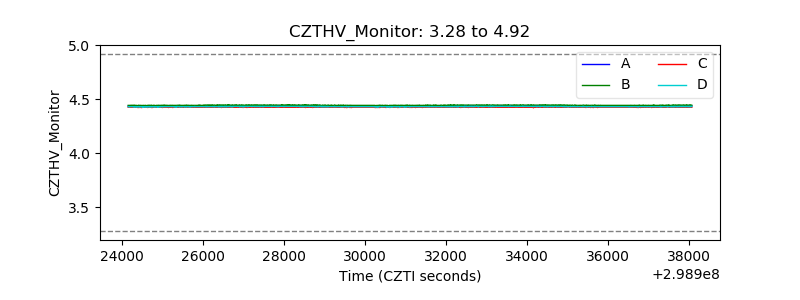 |
| D_VDD | 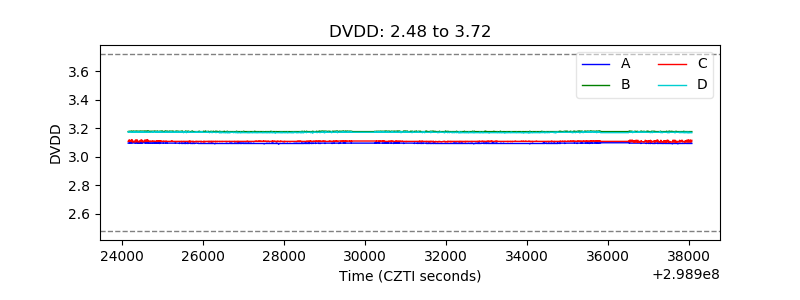 |
| Temperature 1 | 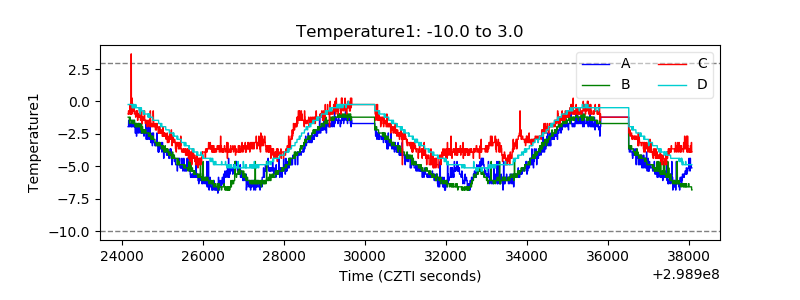 |
| Veto HV Monitor | 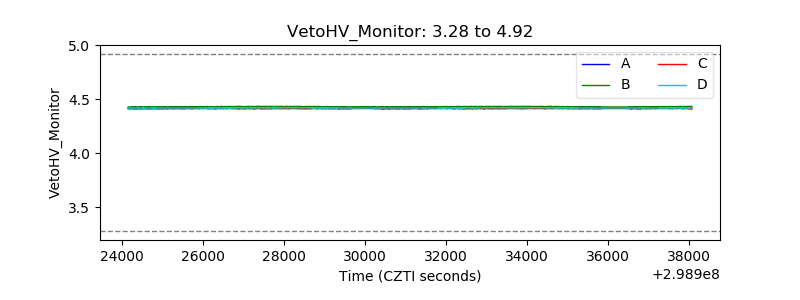 |
| Veto LLD | 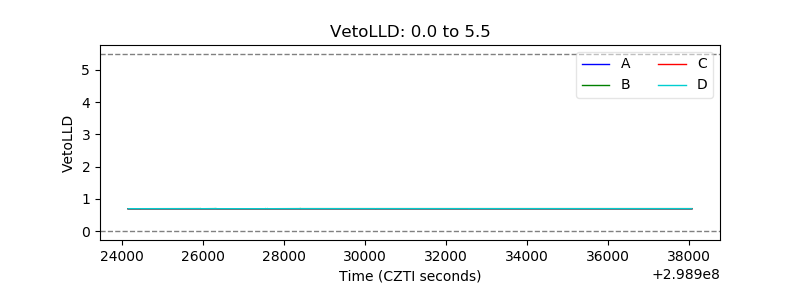 |
| Alpha Counter | 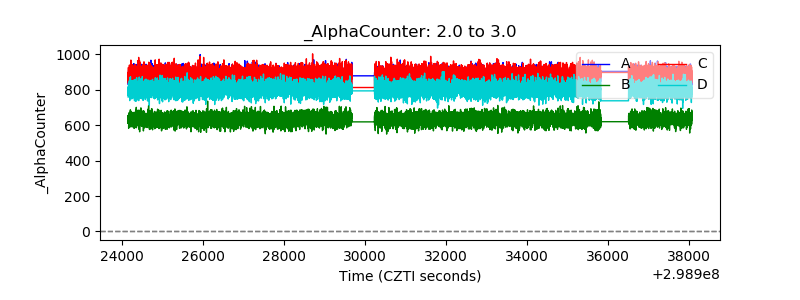 |
| _CPM_Rate | 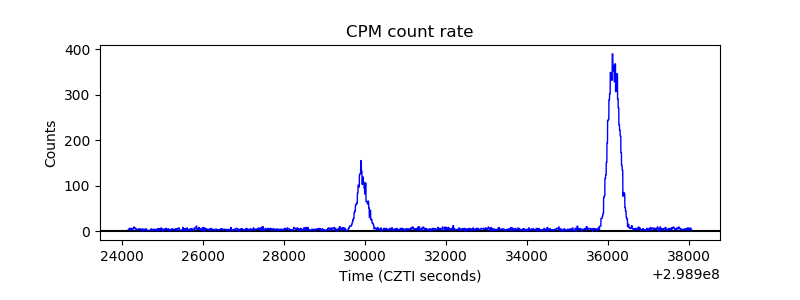 |
| CZT Counter | 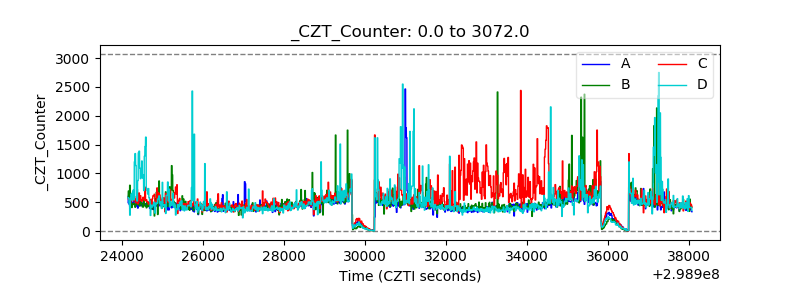 |
| +2.5 Volts monitor |  |
| +5 Volts monitor |  |
| _ROLL_ROT | 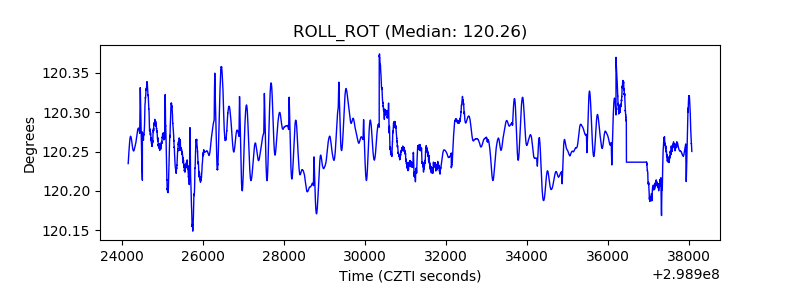 |
| _Roll_DEC | 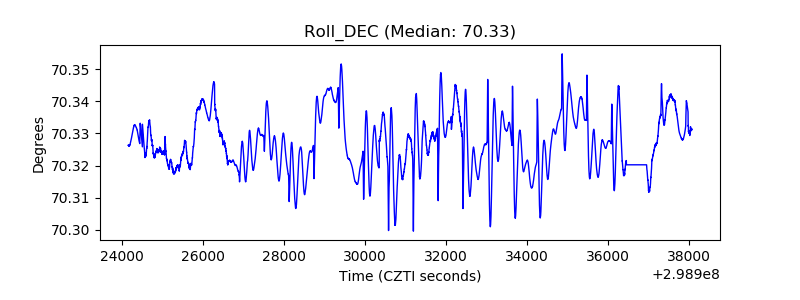 |
| _Roll_RA | 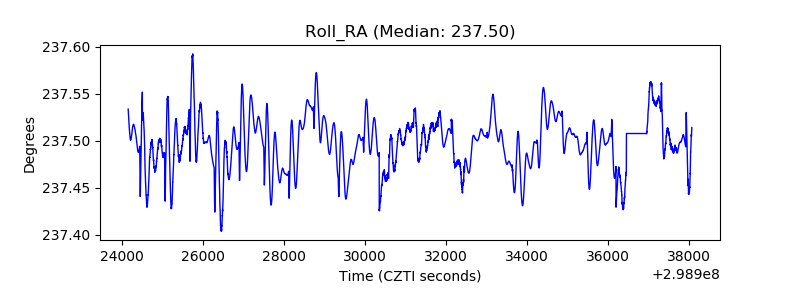 |
| Veto Counter | 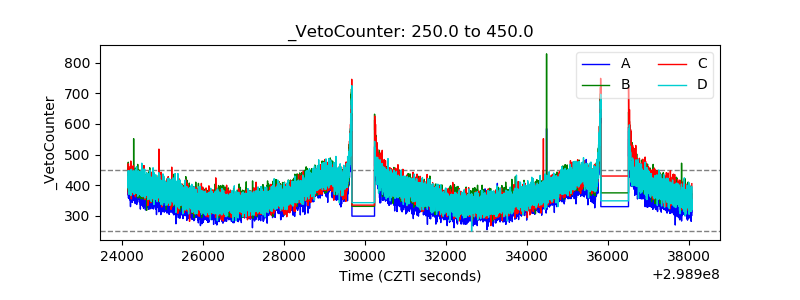 |