| Param | Original file | Final file |
|---|---|---|
| Filename | modeM0/AS1C04_001T01_9000002994_20186cztM0_level2.evt | modeM0/AS1C04_001T01_9000002994_20186cztM0_level2_quad_clean.evt |
| Size (bytes) | 474,937,920 | 128,687,040 |
| Size | 452.9 MB | 122.7 MB |
| Events in quadrant A | 3,136,003 | 869,703 |
| Events in quadrant B | 3,568,834 | 865,174 |
| Events in quadrant C | 3,681,702 | 847,020 |
| Events in quadrant D | 3,527,371 | 834,187 |
| Mode SS | |||
|---|---|---|---|
| Quadrant | BADHDUFLAG | Total packets | Discarded packets |
| A | 0 | 140 | 0 |
| B | 0 | 140 | 0 |
| C | 0 | 140 | 0 |
| D | 0 | 140 | 0 |
| Mode M9 | |||
|---|---|---|---|
| Quadrant | BADHDUFLAG | Total packets | Discarded packets |
| A | 0 | 14 | 0 |
| B | 0 | 15 | 0 |
| C | 0 | 15 | 0 |
| D | 0 | 15 | 0 |
| Mode M0 | |||
|---|---|---|---|
| Quadrant | BADHDUFLAG | Total packets | Discarded packets |
| A | 0 | 14059 | 2 |
| B | 0 | 15340 | 2 |
| C | 0 | 15546 | 2 |
| D | 0 | 15523 | 2 |
| Quadrant | Total seconds | Saturated seconds | Saturation percentage |
|---|---|---|---|
| A | 6915 | 15 | 0.216920% |
| B | 6915 | 73 | 1.055676% |
| C | 6915 | 79 | 1.142444% |
| D | 6914 | 101 | 1.460804% |
Noise dominated data is calculated using 1-second bins in cleaned event files. If a bin has >2000 counts, and if more than 50% of those come from <1% of pixels, then it is considered to be noise-dominated and hence unusable.
| Quadrant | # 1 sec bins | Bins with >0 counts | Bins with >2000 counts | High rate bins dominated by noise | Noise dominated (total time) | Noise dominated (detector-on time) | Marked lightcurve |
|---|---|---|---|---|---|---|---|
| A | 7775 | 6916 | 1 | 1 | 0.01% | 0.01% | 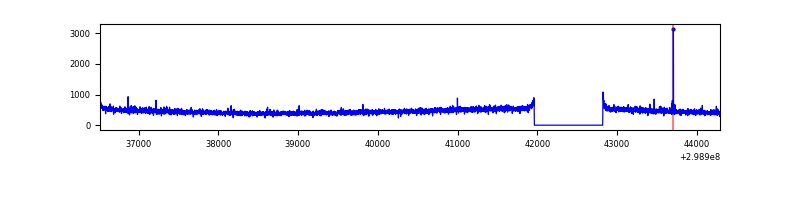 |
| B | 7775 | 6916 | 30 | 30 | 0.39% | 0.43% | 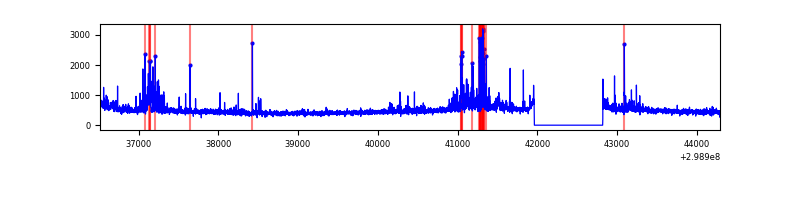 |
| C | 7775 | 6916 | 0 | 0 | 0.00% | 0.00% | 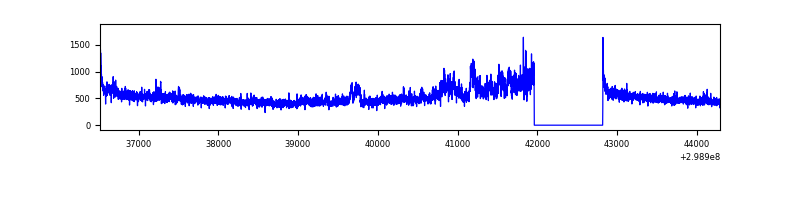 |
| D | 7774 | 6915 | 69 | 69 | 0.89% | 1.00% | 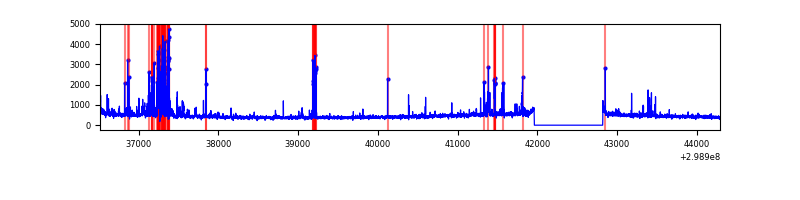 |
Top three noisy pixels from each quadrant. If the there are fewer than three noisy pixels in the level2.evt file, extra rows are filled as -1
| Pixel properties | Quadrant properties | ||||||
|---|---|---|---|---|---|---|---|
| Quadrant | DetID | PixID | Counts | Sigma | Mean | Median | Sigma |
| A | 0 | 253 | 22991 | 136.78 | 803 | 786 | 162.3 |
| A | 14 | 238 | 12192 | 70.26 | 803 | 786 | 162.3 |
| A | 13 | 254 | 9097 | 51.2 | 803 | 786 | 162.3 |
| B | 7 | 220 | 136604 | 886.25 | 801 | 779 | 153.3 |
| B | 0 | 197 | 122777 | 796.03 | 801 | 779 | 153.3 |
| B | 4 | 171 | 49393 | 317.2 | 801 | 779 | 153.3 |
| C | 3 | 233 | 502112 | 2770.83 | 778 | 782 | 180.9 |
| C | 14 | 238 | 120967 | 664.26 | 778 | 782 | 180.9 |
| C | 8 | 128 | 13283 | 69.09 | 778 | 782 | 180.9 |
| D | 9 | 1 | 274249 | 1421.6 | 787 | 764 | 192.4 |
| D | 15 | 0 | 94183 | 485.6 | 787 | 764 | 192.4 |
| D | 7 | 238 | 68561 | 352.41 | 787 | 764 | 192.4 |
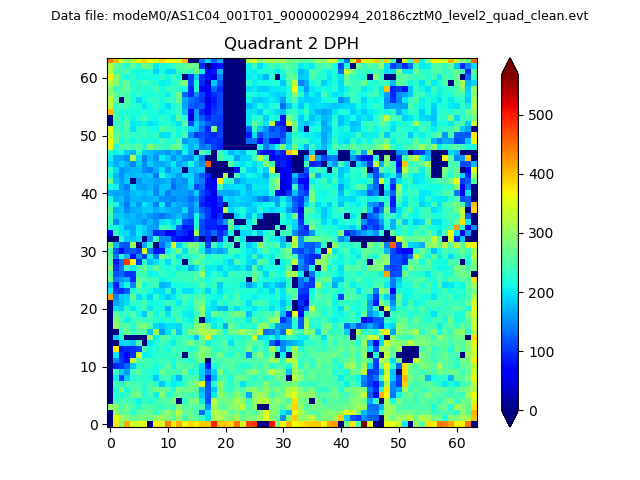
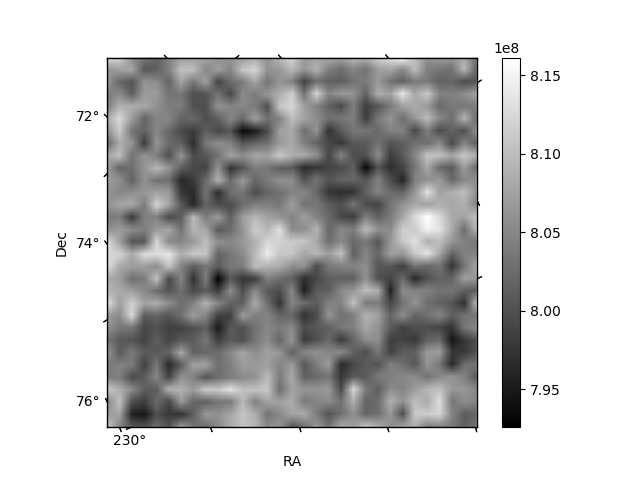
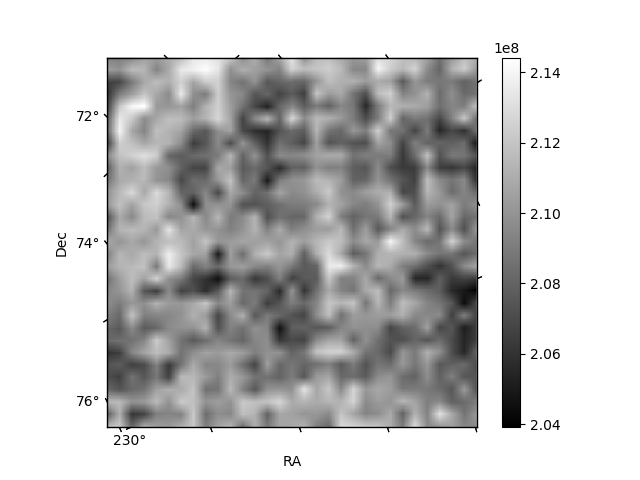
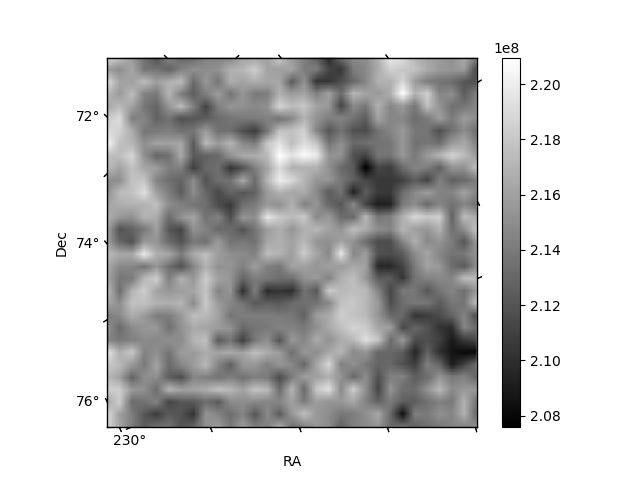
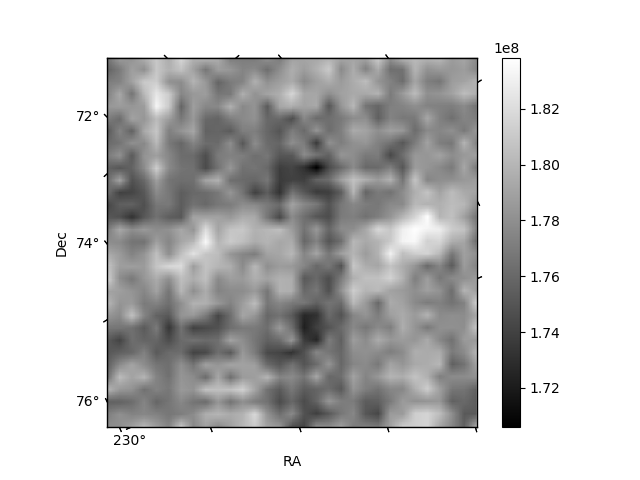
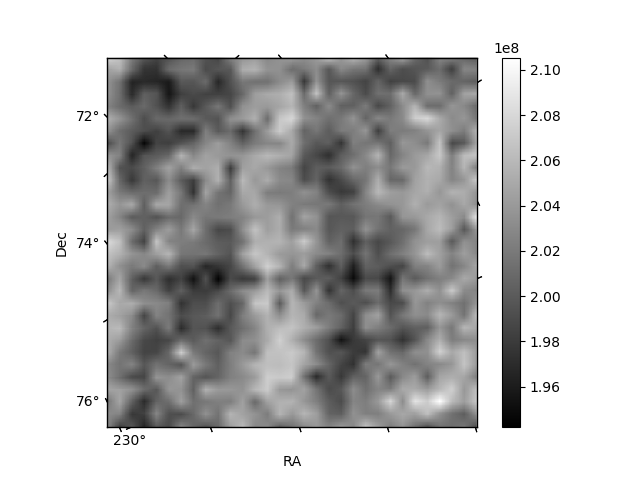
Histogram calculated using DETX and DETY for each event in the final _common_clean file
| Quadrant A | 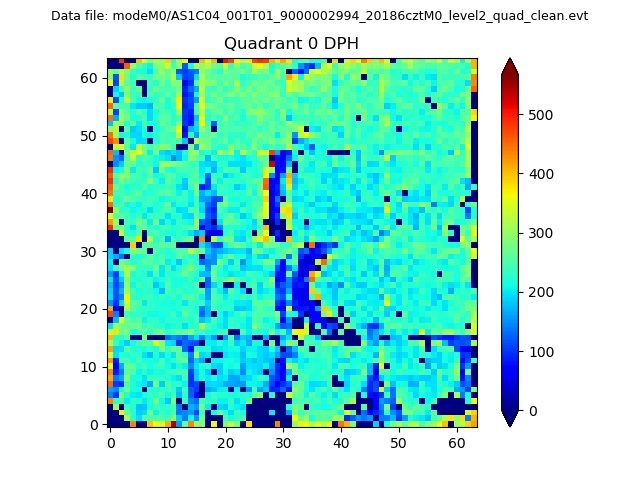 |
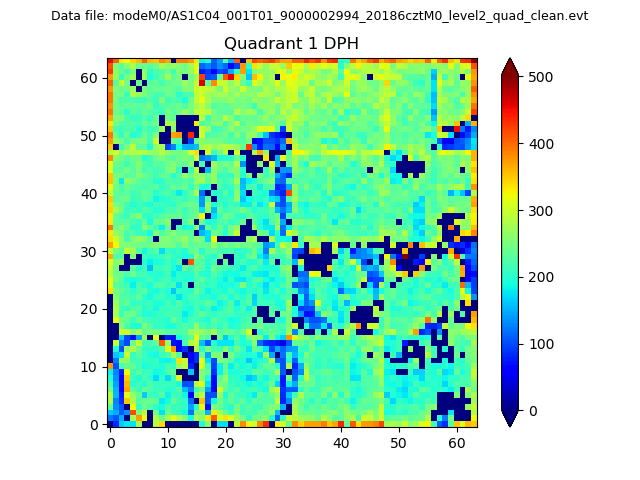 |
Quadrant B |
|---|---|---|---|
| Quadrant D | 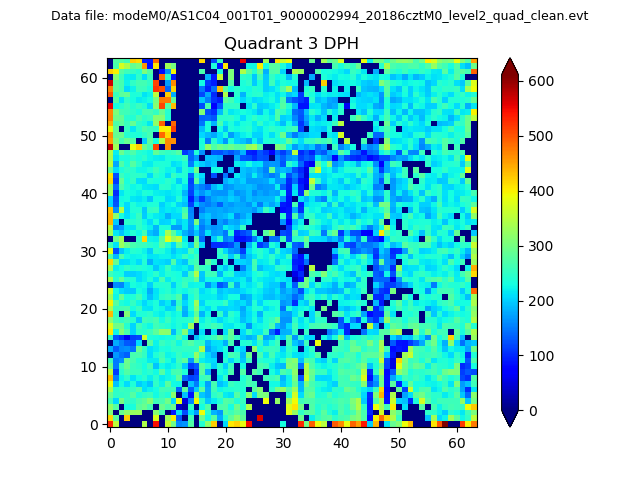 |
 |
Quadrant C |
| Plot type | Count rate plots | Images |
|---|---|---|
| Comparison with Poisson distribution Blue bars denote a histogram of data divided into 1 sec bins. Red curve is a Poisson curve with rate = median count rate of data. |
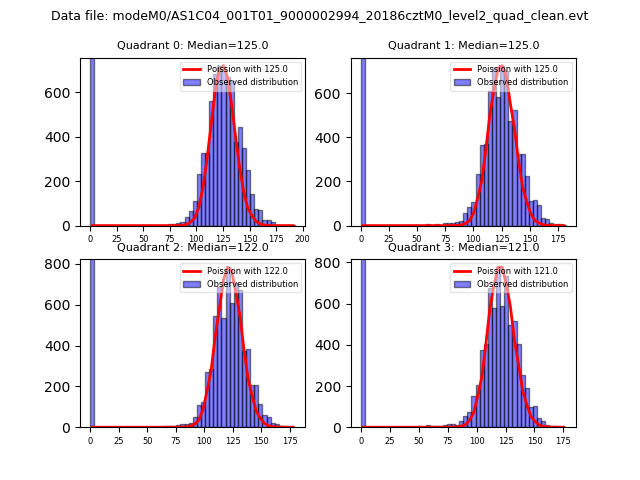 |
 |
| Quadrant-wise count rates Data is divided into 100 sec bins |
 |
|
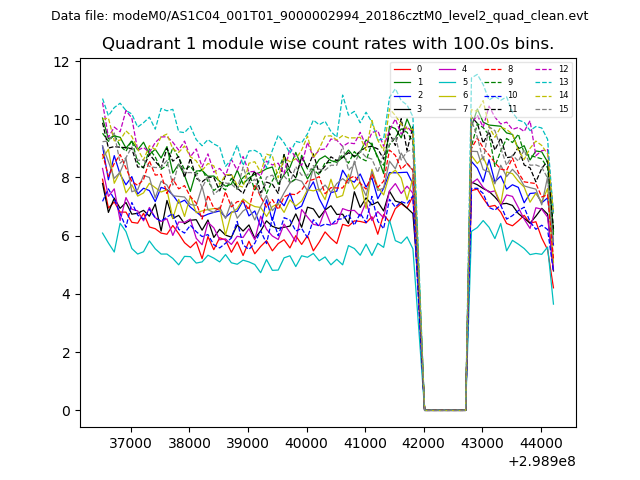
| Module-wise count rates for Quadrant A Data is divided into 100 sec bins |
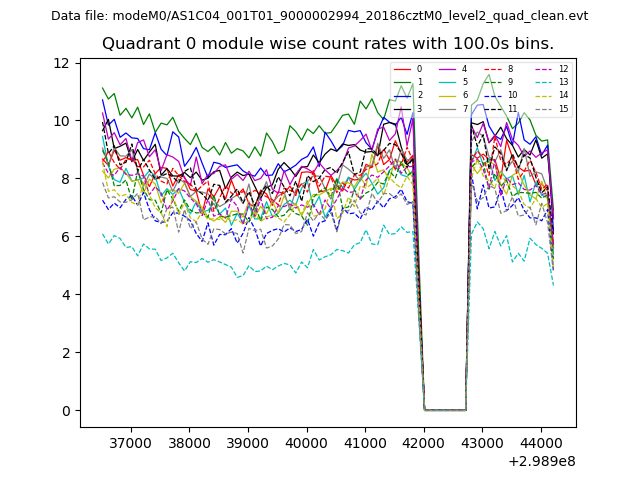 |
 |
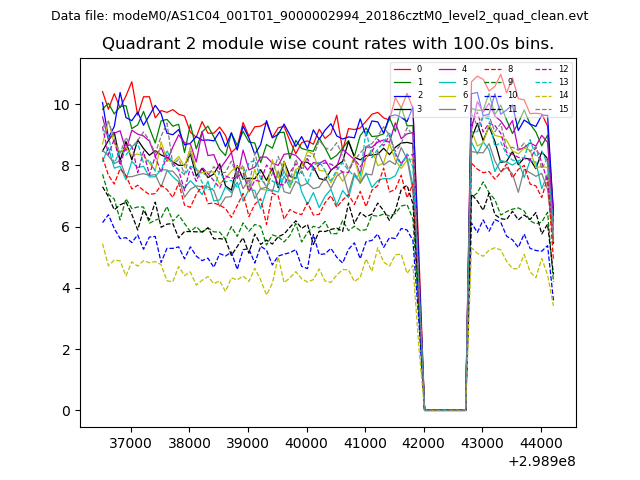
| Module-wise count rates for Quadrant B Data is divided into 100 sec bins |
 |
 |
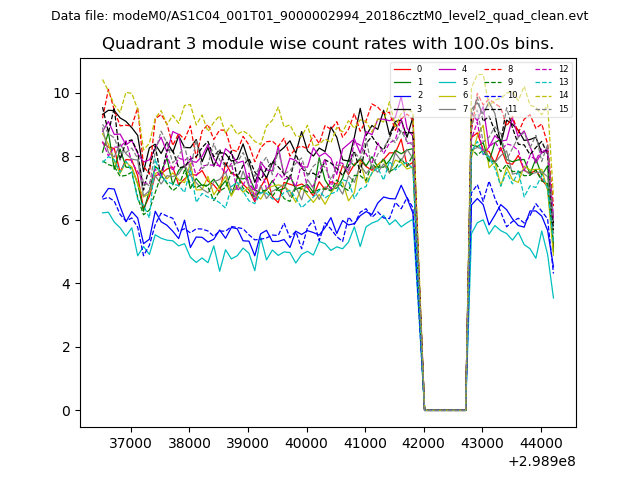
| Module-wise count rates for Quadrant C Data is divided into 100 sec bins |
 |
 |
| Module-wise count rates for Quadrant D Data is divided into 100 sec bins |
 |
 |
| Parameter | Plot |
|---|---|
| CZT HV Monitor | 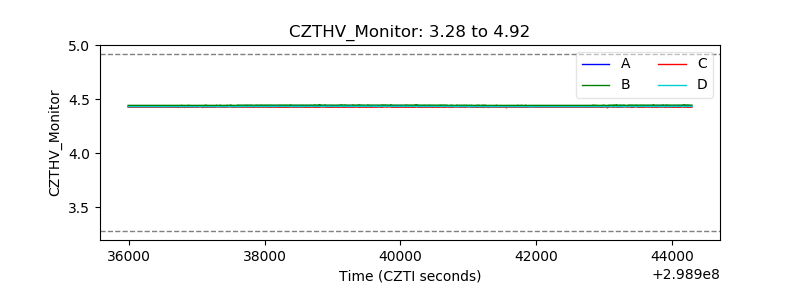 |
| D_VDD | 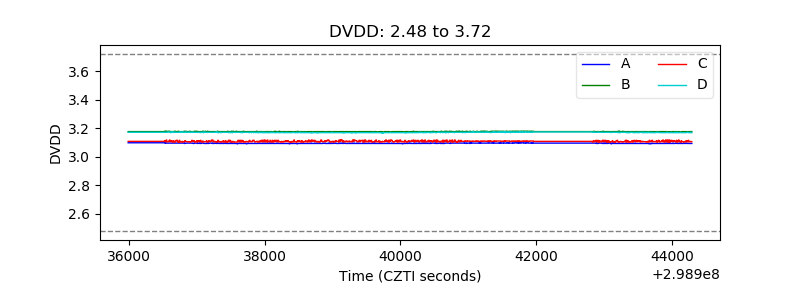 |
| Temperature 1 | 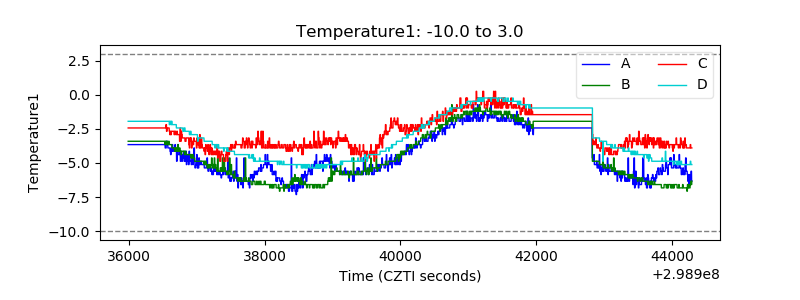 |
| Veto HV Monitor | 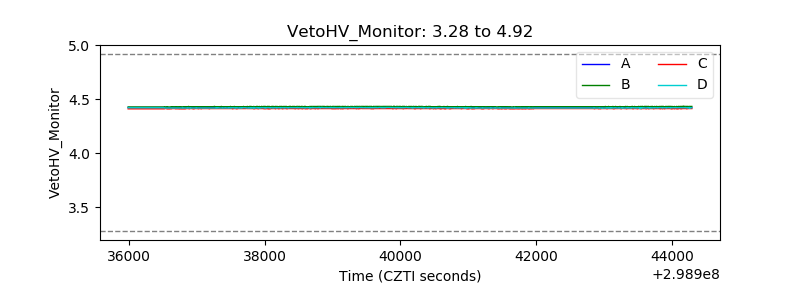 |
| Veto LLD | 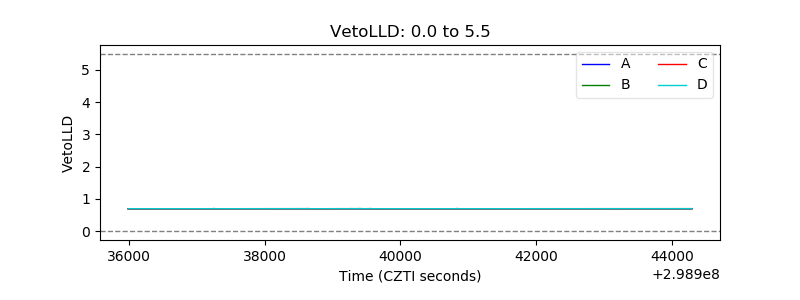 |
| Alpha Counter | 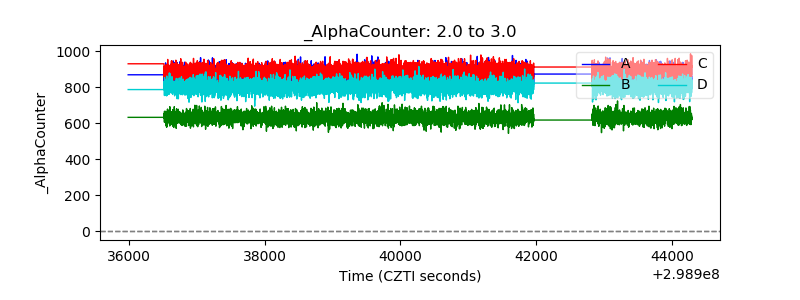 |
| _CPM_Rate | 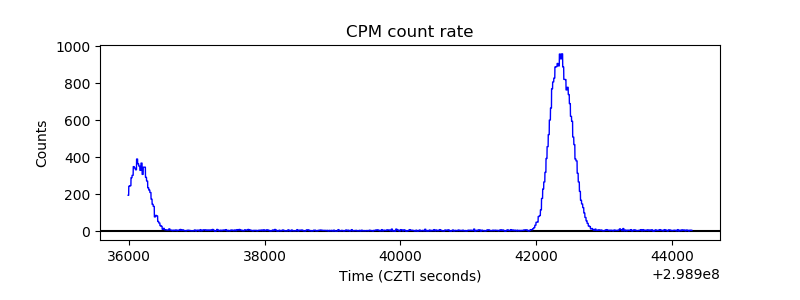 |
| CZT Counter | 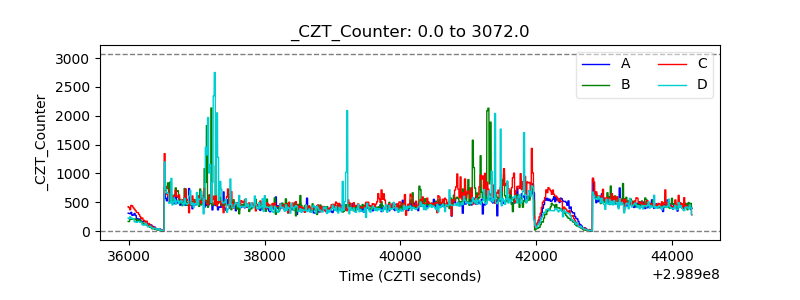 |
| +2.5 Volts monitor |  |
| +5 Volts monitor |  |
| _ROLL_ROT | 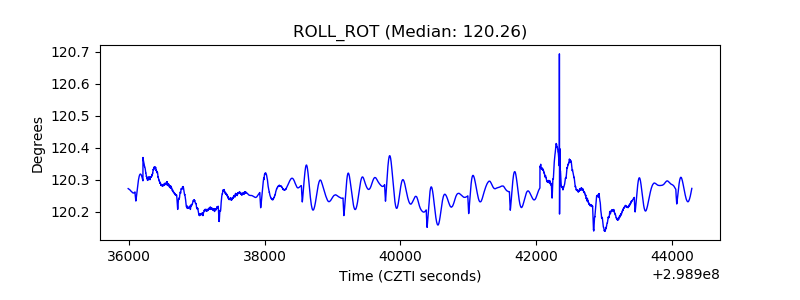 |
| _Roll_DEC | 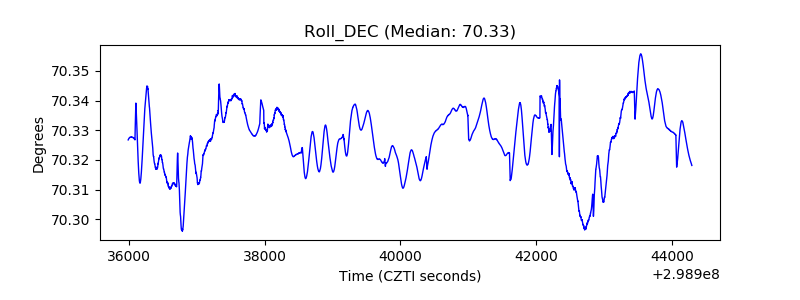 |
| _Roll_RA | 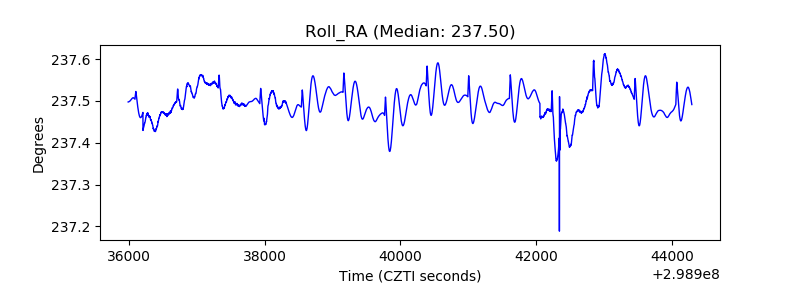 |
| Veto Counter | 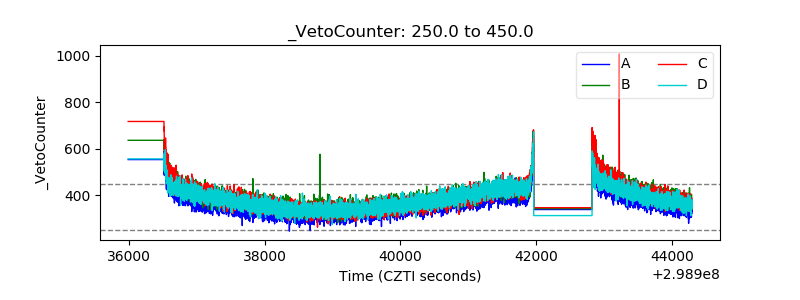 |