| Param | Original file | Final file |
|---|---|---|
| Filename | modeM0/AS1C04_001T01_9000002994_20189cztM0_level2.evt | modeM0/AS1C04_001T01_9000002994_20189cztM0_level2_quad_clean.evt |
| Size (bytes) | 431,208,000 | 127,497,600 |
| Size | 411.2 MB | 121.6 MB |
| Events in quadrant A | 3,028,891 | 868,306 |
| Events in quadrant B | 3,188,874 | 874,558 |
| Events in quadrant C | 3,074,135 | 841,689 |
| Events in quadrant D | 3,325,431 | 824,176 |
| Mode SS | |||
|---|---|---|---|
| Quadrant | BADHDUFLAG | Total packets | Discarded packets |
| A | 0 | 132 | 0 |
| B | 0 | 132 | 0 |
| C | 0 | 132 | 0 |
| D | 0 | 132 | 0 |
| Mode M9 | |||
|---|---|---|---|
| Quadrant | BADHDUFLAG | Total packets | Discarded packets |
| A | 0 | 11 | 0 |
| B | 0 | 11 | 0 |
| C | 0 | 11 | 0 |
| D | 0 | 11 | 0 |
| Mode M0 | |||
|---|---|---|---|
| Quadrant | BADHDUFLAG | Total packets | Discarded packets |
| A | 0 | 13277 | 1 |
| B | 0 | 13722 | 1 |
| C | 0 | 13299 | 1 |
| D | 0 | 14424 | 1 |
| Quadrant | Total seconds | Saturated seconds | Saturation percentage |
|---|---|---|---|
| A | 6495 | 36 | 0.554273% |
| B | 6496 | 60 | 0.923645% |
| C | 6496 | 55 | 0.846675% |
| D | 6496 | 103 | 1.585591% |
Noise dominated data is calculated using 1-second bins in cleaned event files. If a bin has >2000 counts, and if more than 50% of those come from <1% of pixels, then it is considered to be noise-dominated and hence unusable.
| Quadrant | # 1 sec bins | Bins with >0 counts | Bins with >2000 counts | High rate bins dominated by noise | Noise dominated (total time) | Noise dominated (detector-on time) | Marked lightcurve |
|---|---|---|---|---|---|---|---|
| A | 7605 | 6496 | 0 | 0 | 0.00% | 0.00% | 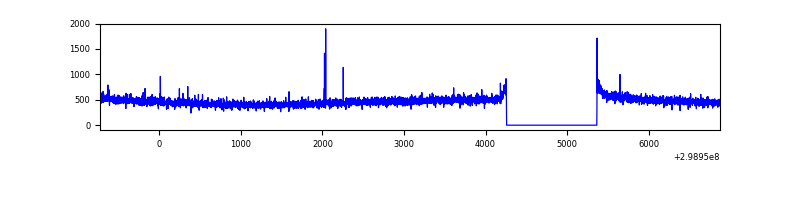 |
| B | 7606 | 6497 | 6 | 6 | 0.08% | 0.09% | 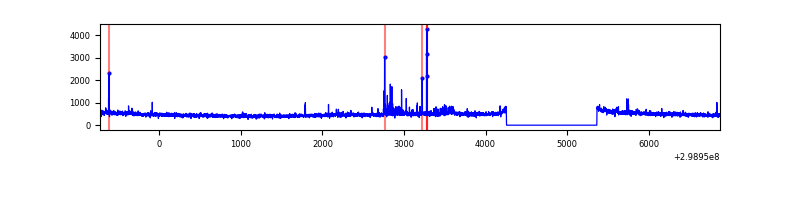 |
| C | 7606 | 6497 | 0 | 0 | 0.00% | 0.00% | 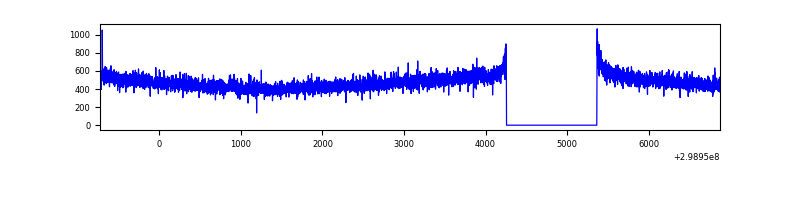 |
| D | 7606 | 6497 | 69 | 69 | 0.91% | 1.06% | 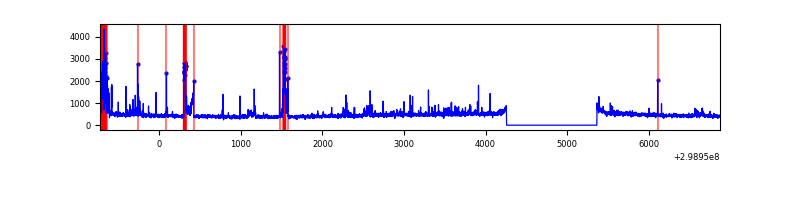 |
Top three noisy pixels from each quadrant. If the there are fewer than three noisy pixels in the level2.evt file, extra rows are filled as -1
| Pixel properties | Quadrant properties | ||||||
|---|---|---|---|---|---|---|---|
| Quadrant | DetID | PixID | Counts | Sigma | Mean | Median | Sigma |
| A | 4 | 2 | 9045 | 52.68 | 781 | 764 | 157.2 |
| A | 14 | 238 | 8124 | 46.82 | 781 | 764 | 157.2 |
| A | 0 | 226 | 6829 | 38.58 | 781 | 764 | 157.2 |
| B | 0 | 197 | 49445 | 335.25 | 777 | 757 | 145.2 |
| B | 7 | 220 | 48050 | 325.65 | 777 | 757 | 145.2 |
| B | 12 | 111 | 17285 | 113.81 | 777 | 757 | 145.2 |
| C | 14 | 238 | 116306 | 664.07 | 745 | 748 | 174.0 |
| C | 3 | 233 | 51260 | 290.27 | 745 | 748 | 174.0 |
| C | 13 | 61 | 5301 | 26.16 | 745 | 748 | 174.0 |
| D | 15 | 0 | 126545 | 698.81 | 750 | 726 | 180.0 |
| D | 12 | 17 | 120055 | 662.76 | 750 | 726 | 180.0 |
| D | 11 | 255 | 93004 | 512.52 | 750 | 726 | 180.0 |
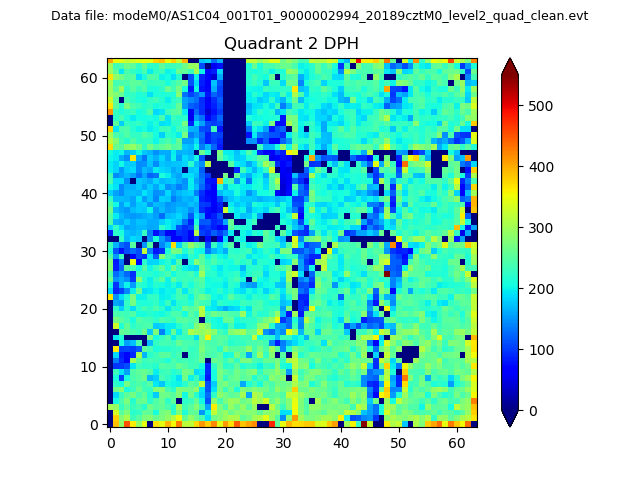
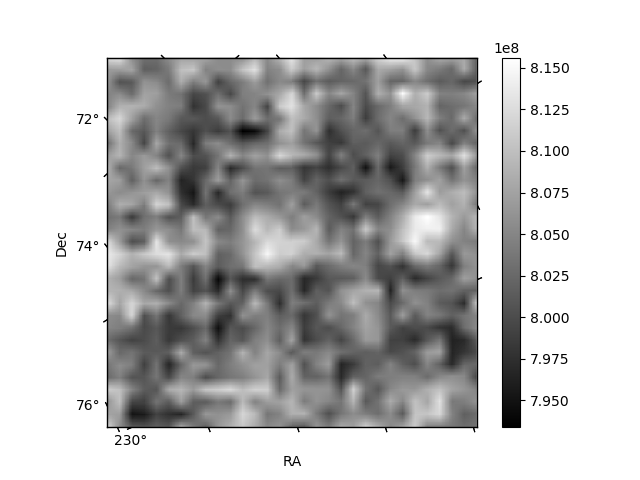
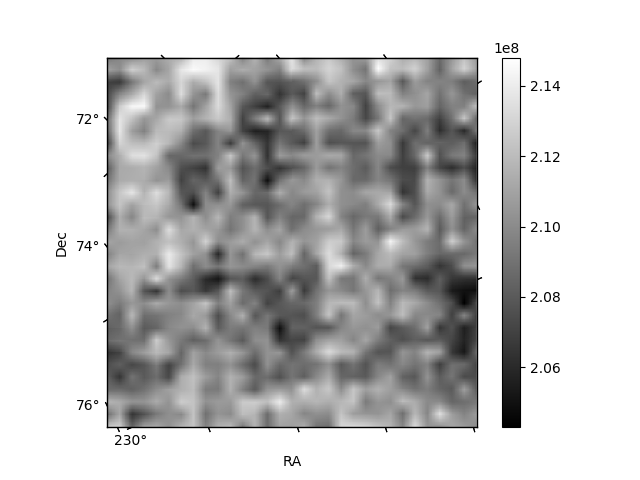
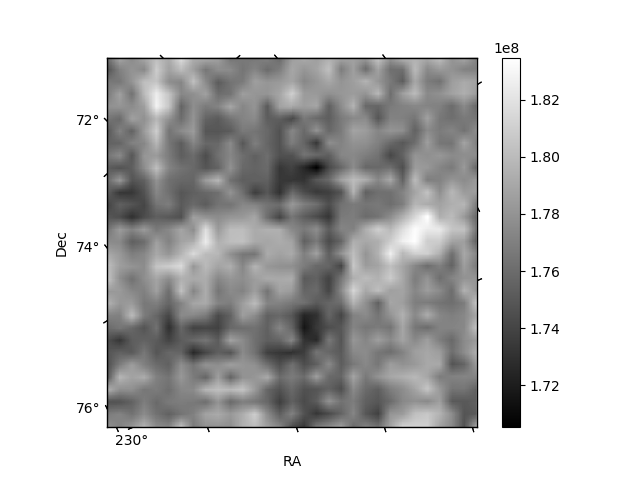
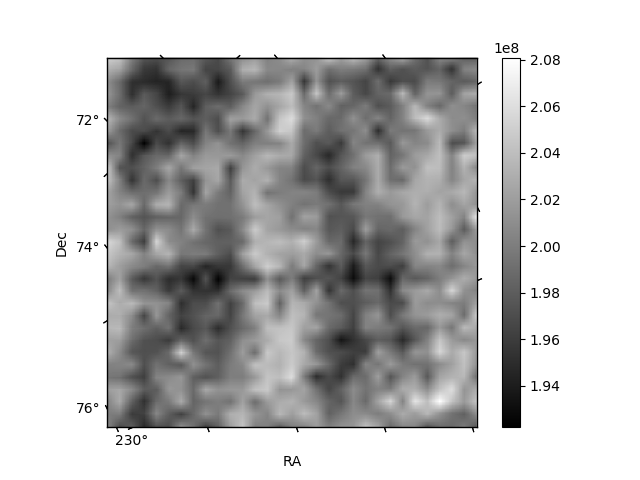
Histogram calculated using DETX and DETY for each event in the final _common_clean file
| Quadrant A | 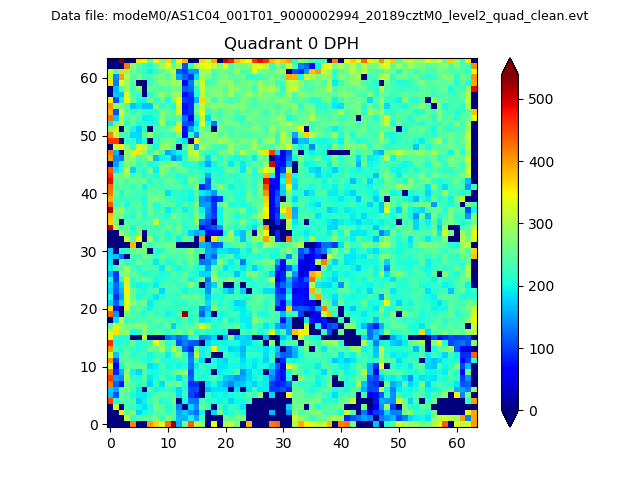 |
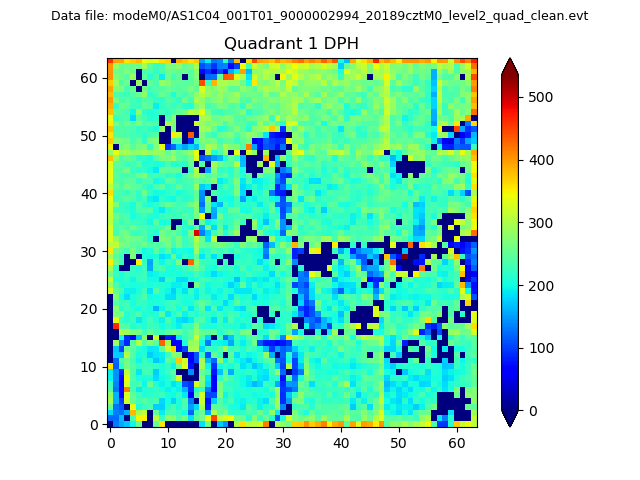 |
Quadrant B |
|---|---|---|---|
| Quadrant D | 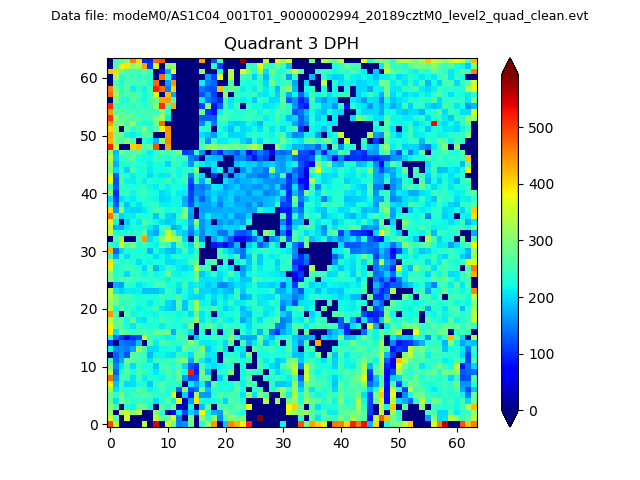 |
 |
Quadrant C |
| Plot type | Count rate plots | Images |
|---|---|---|
| Comparison with Poisson distribution Blue bars denote a histogram of data divided into 1 sec bins. Red curve is a Poisson curve with rate = median count rate of data. |
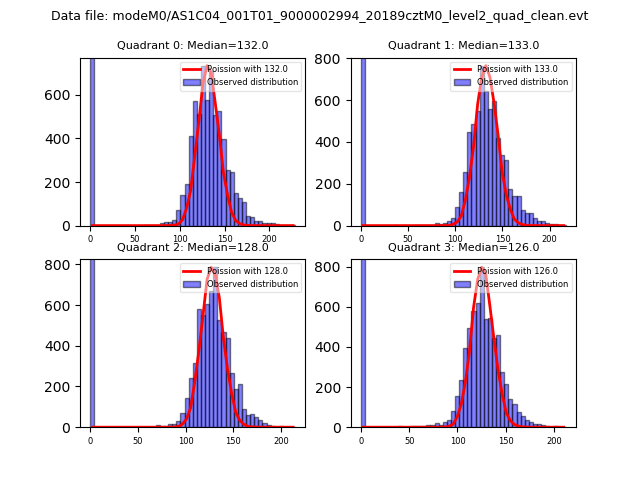 |
 |
| Quadrant-wise count rates Data is divided into 100 sec bins |
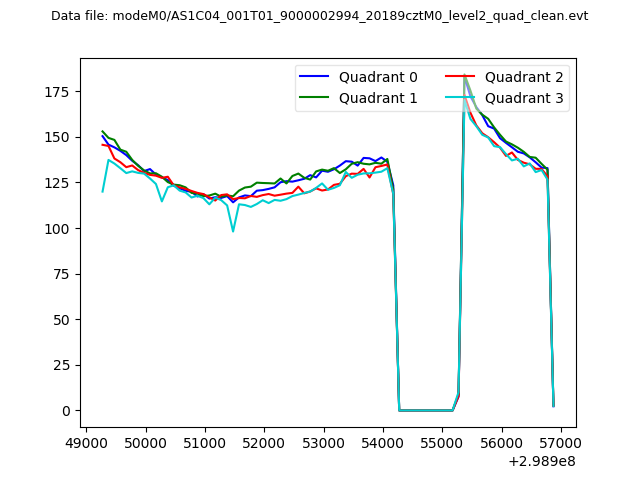 |
|
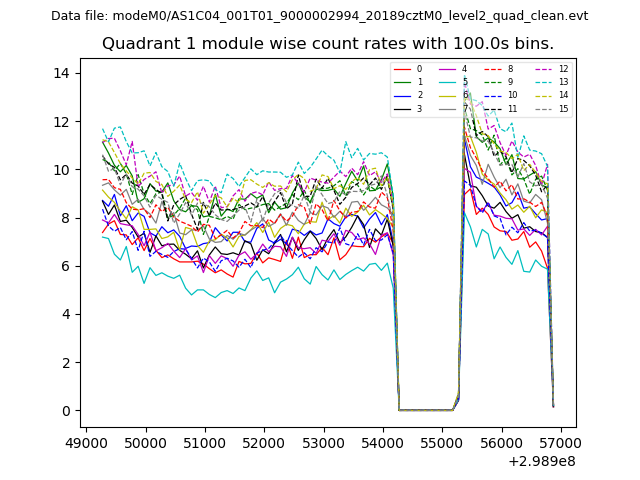
| Module-wise count rates for Quadrant A Data is divided into 100 sec bins |
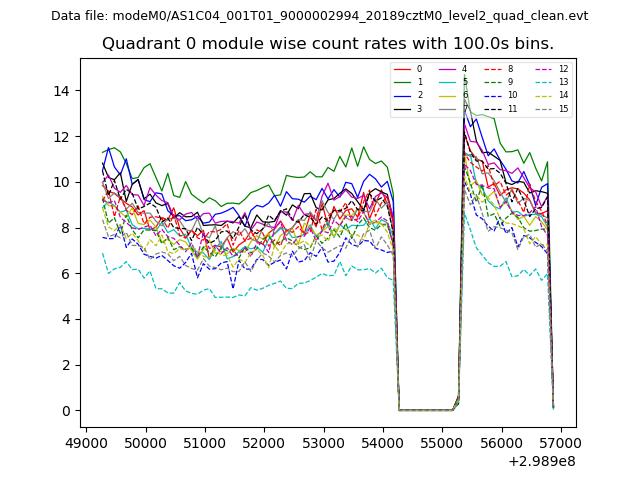 |
 |
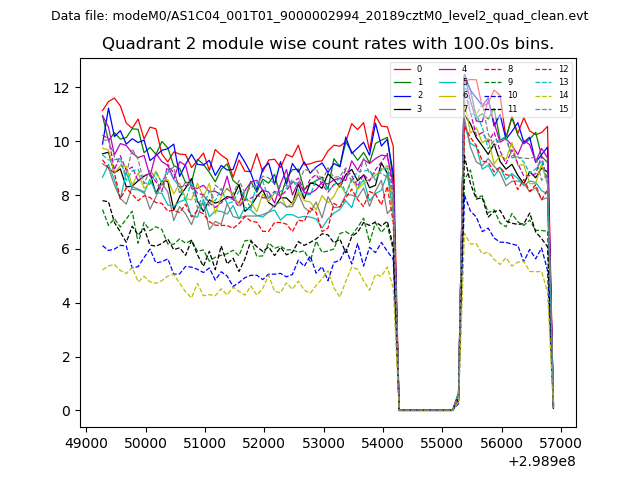
| Module-wise count rates for Quadrant B Data is divided into 100 sec bins |
 |
 |
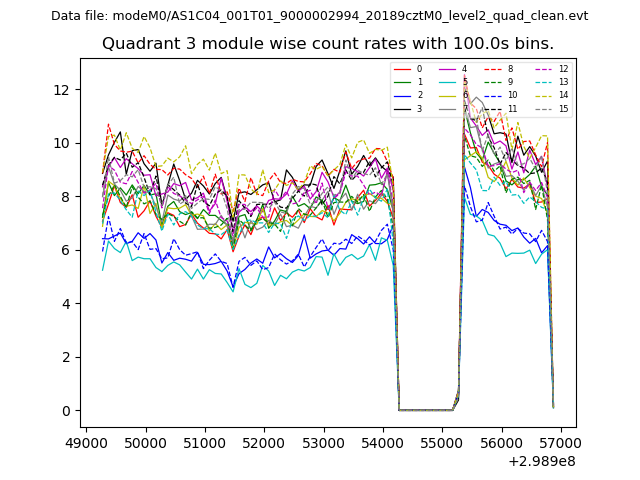
| Module-wise count rates for Quadrant C Data is divided into 100 sec bins |
 |
 |
| Module-wise count rates for Quadrant D Data is divided into 100 sec bins |
 |
 |
| Parameter | Plot |
|---|---|
| CZT HV Monitor | 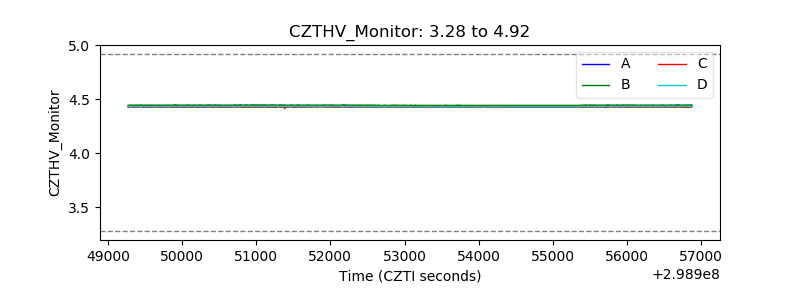 |
| D_VDD | 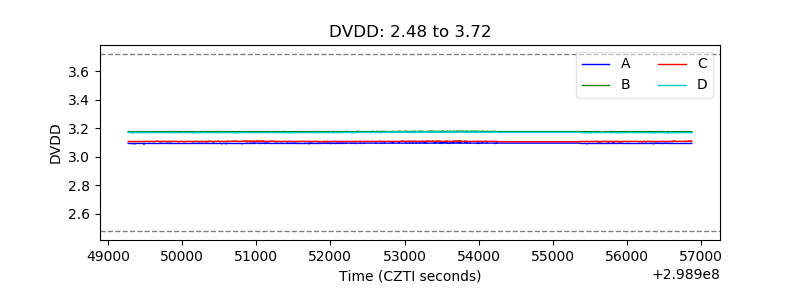 |
| Temperature 1 |  |
| Veto HV Monitor | 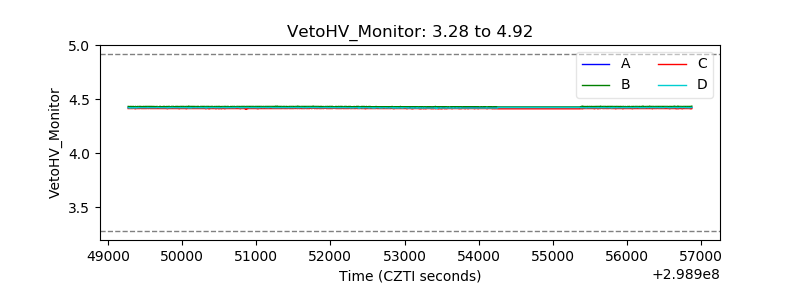 |
| Veto LLD | 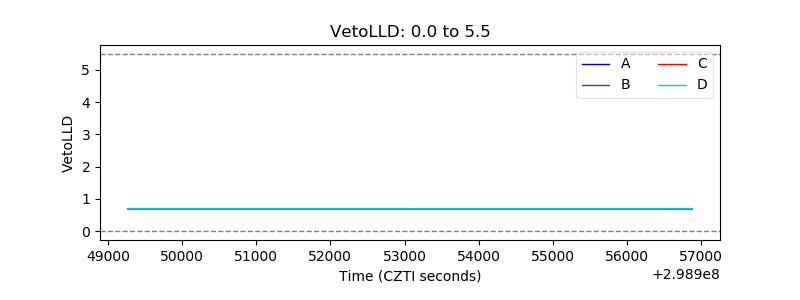 |
| Alpha Counter | 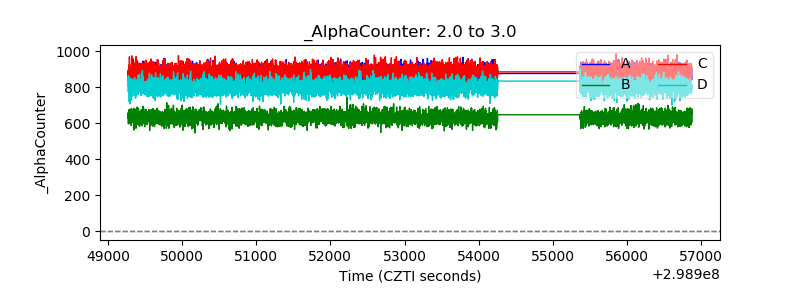 |
| _CPM_Rate | 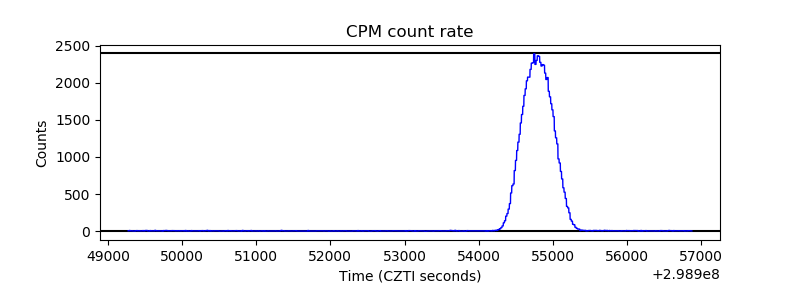 |
| CZT Counter | 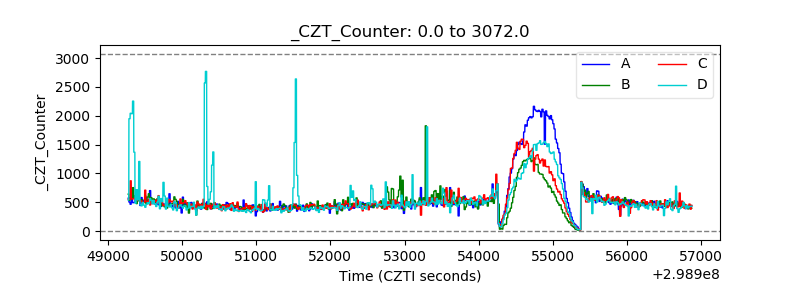 |
| +2.5 Volts monitor |  |
| +5 Volts monitor |  |
| _ROLL_ROT | 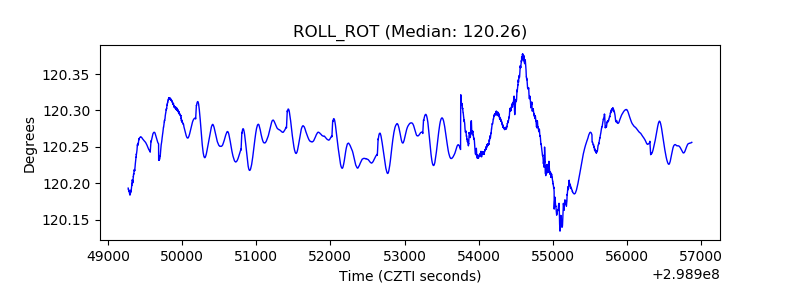 |
| _Roll_DEC |  |
| _Roll_RA | 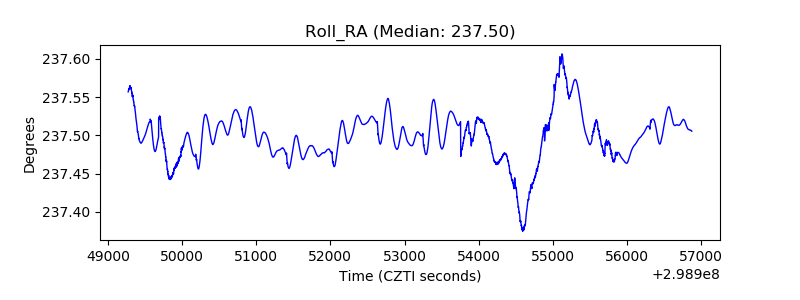 |
| Veto Counter | 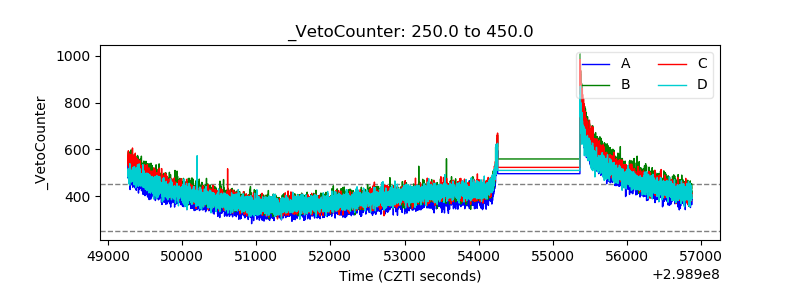 |