| Param | Original file | Final file |
|---|---|---|
| Filename | modeM0/AS1C04_001T01_9000002994_20190cztM0_level2.evt | modeM0/AS1C04_001T01_9000002994_20190cztM0_level2_quad_clean.evt |
| Size (bytes) | 431,686,080 | 133,107,840 |
| Size | 411.7 MB | 126.9 MB |
| Events in quadrant A | 3,128,270 | 917,915 |
| Events in quadrant B | 3,214,145 | 923,570 |
| Events in quadrant C | 3,117,835 | 876,542 |
| Events in quadrant D | 3,177,499 | 866,579 |
| Mode SS | |||
|---|---|---|---|
| Quadrant | BADHDUFLAG | Total packets | Discarded packets |
| A | 0 | 132 | 0 |
| B | 0 | 132 | 0 |
| C | 0 | 132 | 0 |
| D | 0 | 132 | 0 |
| Mode M9 | |||
|---|---|---|---|
| Quadrant | BADHDUFLAG | Total packets | Discarded packets |
| A | 0 | 15 | 0 |
| B | 0 | 16 | 0 |
| C | 0 | 16 | 0 |
| D | 0 | 16 | 0 |
| Mode M0 | |||
|---|---|---|---|
| Quadrant | BADHDUFLAG | Total packets | Discarded packets |
| A | 0 | 13313 | 2 |
| B | 0 | 13601 | 2 |
| C | 0 | 13262 | 2 |
| D | 0 | 13754 | 2 |
| Quadrant | Total seconds | Saturated seconds | Saturation percentage |
|---|---|---|---|
| A | 6405 | 25 | 0.390320% |
| B | 6405 | 45 | 0.702576% |
| C | 6405 | 56 | 0.874317% |
| D | 6405 | 54 | 0.843091% |
Noise dominated data is calculated using 1-second bins in cleaned event files. If a bin has >2000 counts, and if more than 50% of those come from <1% of pixels, then it is considered to be noise-dominated and hence unusable.
| Quadrant | # 1 sec bins | Bins with >0 counts | Bins with >2000 counts | High rate bins dominated by noise | Noise dominated (total time) | Noise dominated (detector-on time) | Marked lightcurve |
|---|---|---|---|---|---|---|---|
| A | 7675 | 6406 | 0 | 0 | 0.00% | 0.00% | 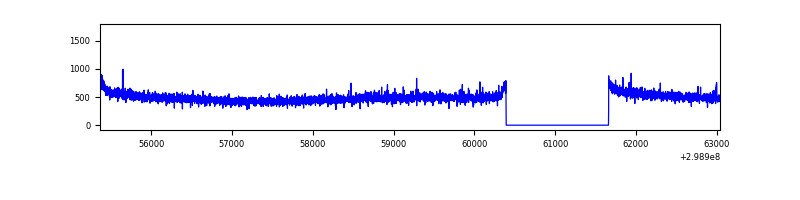 |
| B | 7675 | 6406 | 0 | 0 | 0.00% | 0.00% | 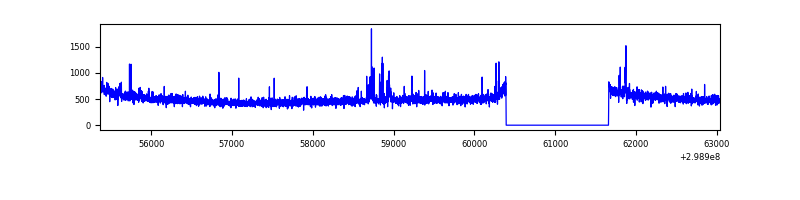 |
| C | 7675 | 6406 | 0 | 0 | 0.00% | 0.00% | 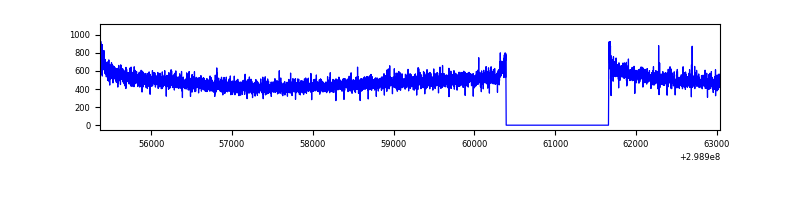 |
| D | 7675 | 6406 | 38 | 38 | 0.50% | 0.59% | 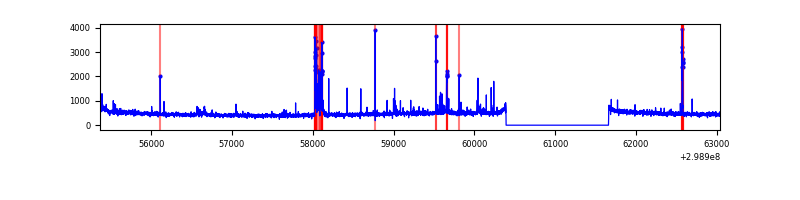 |
Top three noisy pixels from each quadrant. If the there are fewer than three noisy pixels in the level2.evt file, extra rows are filled as -1
| Pixel properties | Quadrant properties | ||||||
|---|---|---|---|---|---|---|---|
| Quadrant | DetID | PixID | Counts | Sigma | Mean | Median | Sigma |
| A | 12 | 16 | 11895 | 69.08 | 805 | 791 | 160.7 |
| A | 4 | 2 | 9395 | 53.53 | 805 | 791 | 160.7 |
| A | 12 | 194 | 7882 | 44.11 | 805 | 791 | 160.7 |
| B | 0 | 197 | 20269 | 130.22 | 800 | 781 | 149.7 |
| B | 4 | 171 | 18608 | 119.12 | 800 | 781 | 149.7 |
| B | 7 | 220 | 18204 | 116.42 | 800 | 781 | 149.7 |
| C | 14 | 238 | 121214 | 685.99 | 760 | 763 | 175.6 |
| C | 3 | 233 | 30371 | 168.62 | 760 | 763 | 175.6 |
| C | 13 | 61 | 5263 | 25.63 | 760 | 763 | 175.6 |
| D | 7 | 96 | 112623 | 603.84 | 770 | 748 | 185.3 |
| D | 2 | 120 | 36392 | 192.39 | 770 | 748 | 185.3 |
| D | 2 | 234 | 25606 | 134.17 | 770 | 748 | 185.3 |
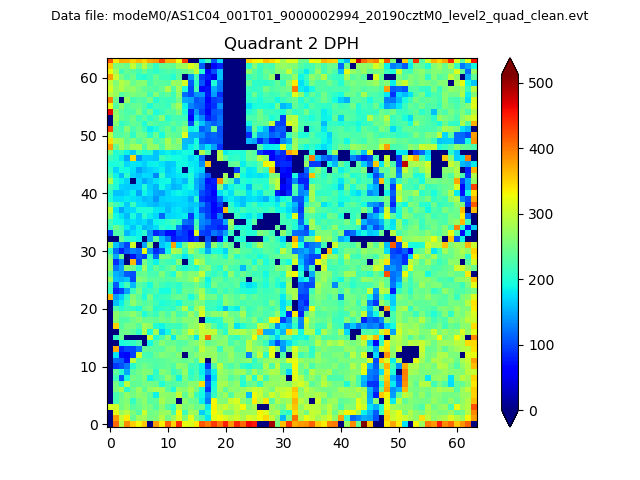
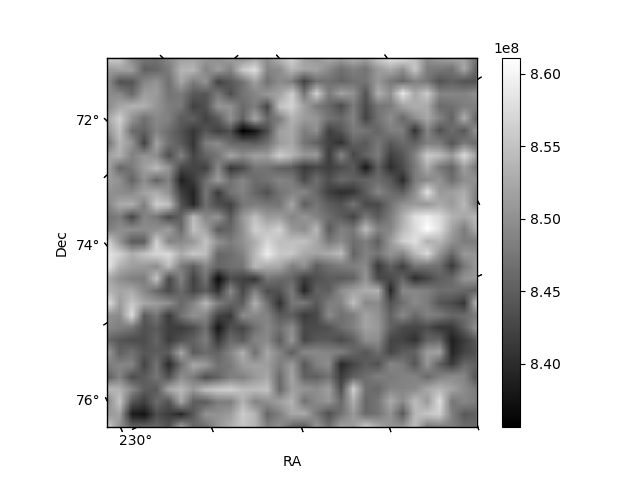
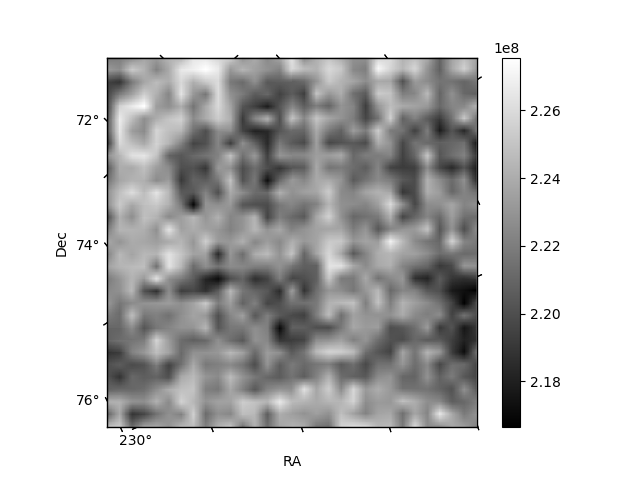
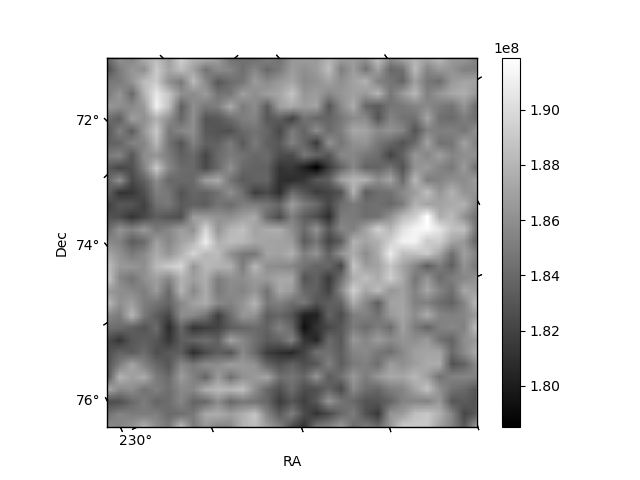
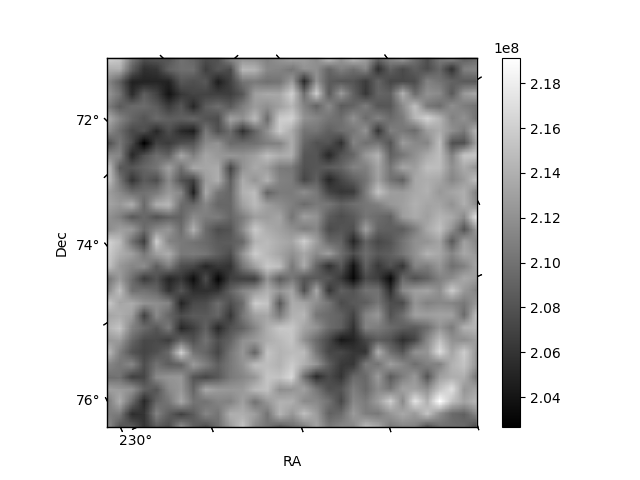
Histogram calculated using DETX and DETY for each event in the final _common_clean file
| Quadrant A | 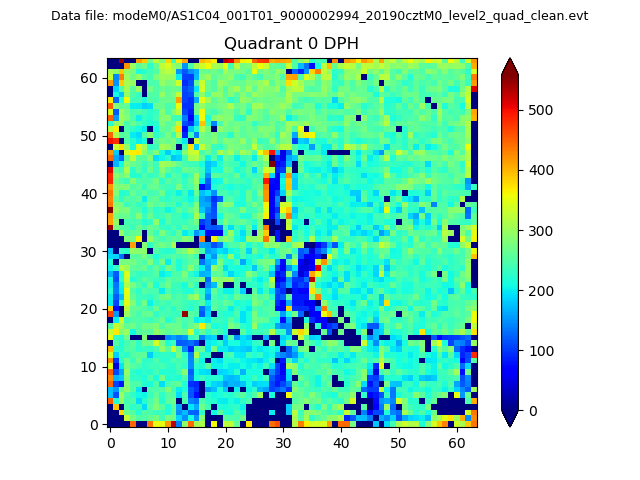 |
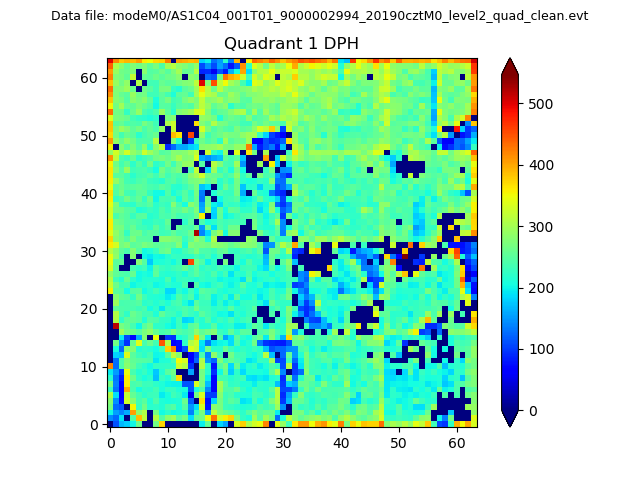 |
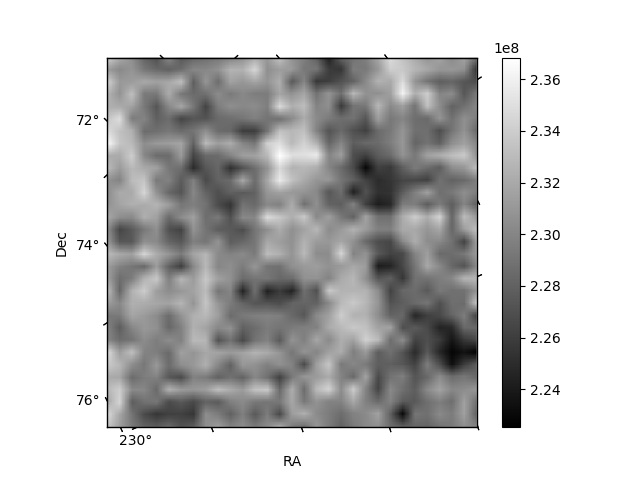
Quadrant B |
|---|---|---|---|
| Quadrant D | 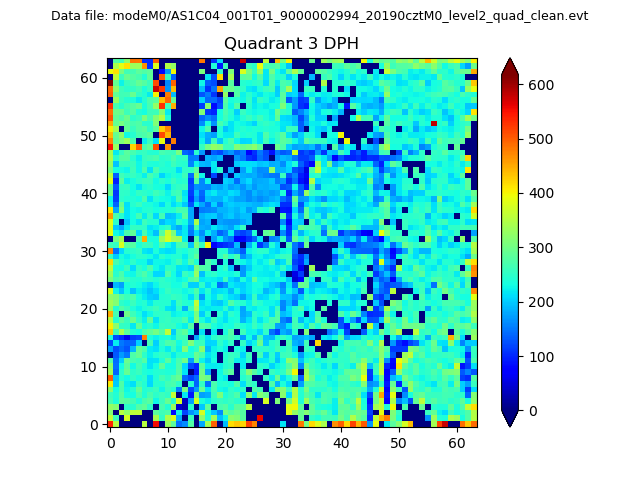 |
 |
Quadrant C |
| Plot type | Count rate plots | Images |
|---|---|---|
| Comparison with Poisson distribution Blue bars denote a histogram of data divided into 1 sec bins. Red curve is a Poisson curve with rate = median count rate of data. |
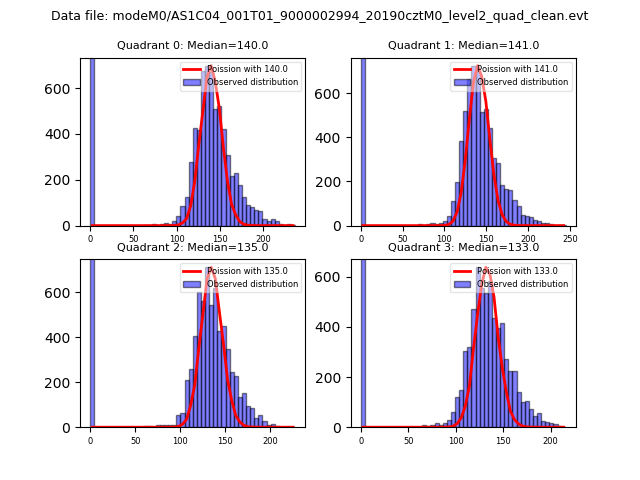 |
 |
| Quadrant-wise count rates Data is divided into 100 sec bins |
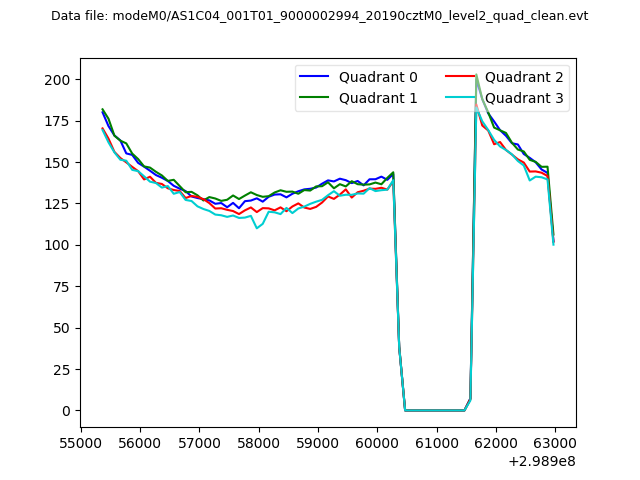 |
|
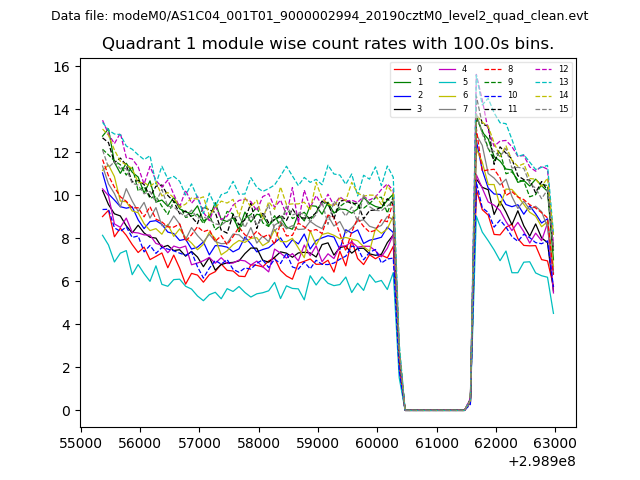
| Module-wise count rates for Quadrant A Data is divided into 100 sec bins |
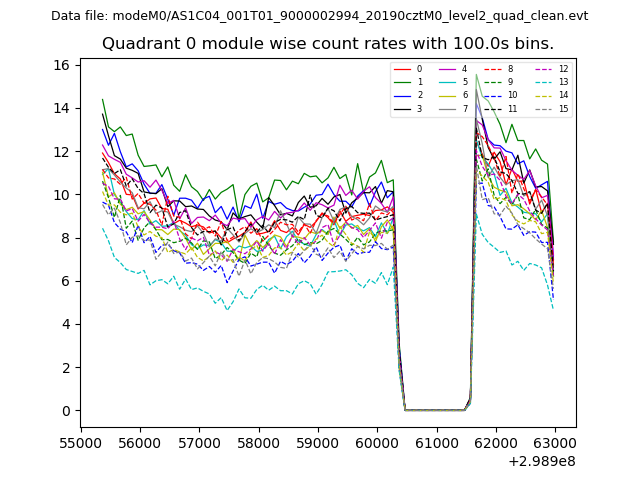 |
 |
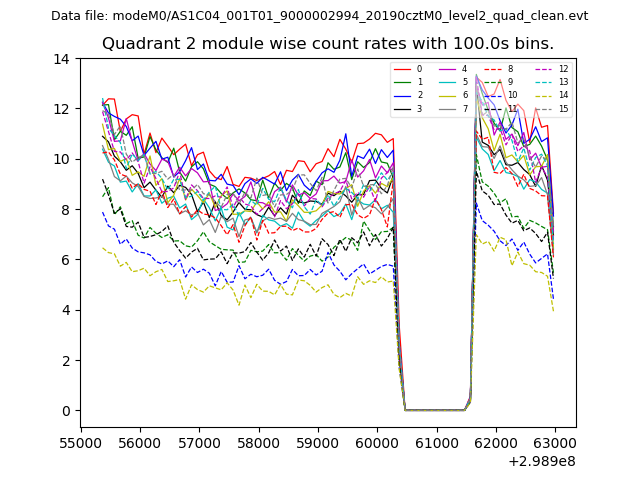
| Module-wise count rates for Quadrant B Data is divided into 100 sec bins |
 |
 |
| Module-wise count rates for Quadrant C Data is divided into 100 sec bins |
 |
 |
| Module-wise count rates for Quadrant D Data is divided into 100 sec bins |
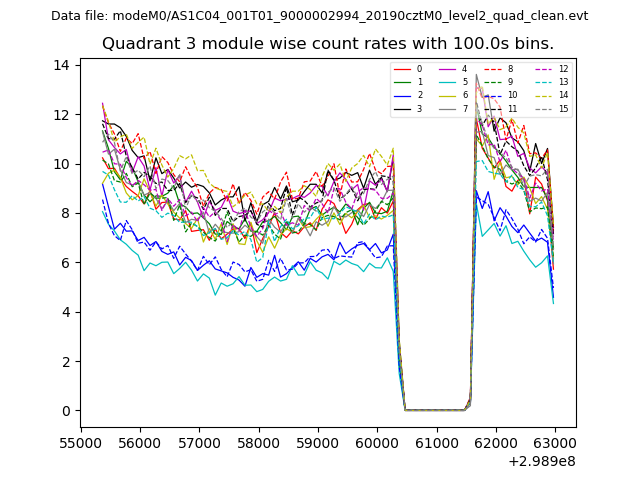 |
 |
| Parameter | Plot |
|---|---|
| CZT HV Monitor | 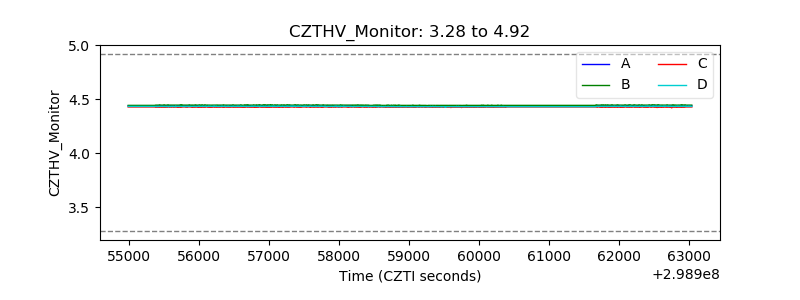 |
| D_VDD | 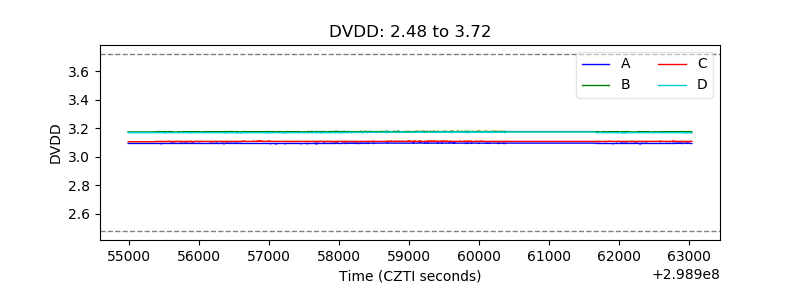 |
| Temperature 1 | 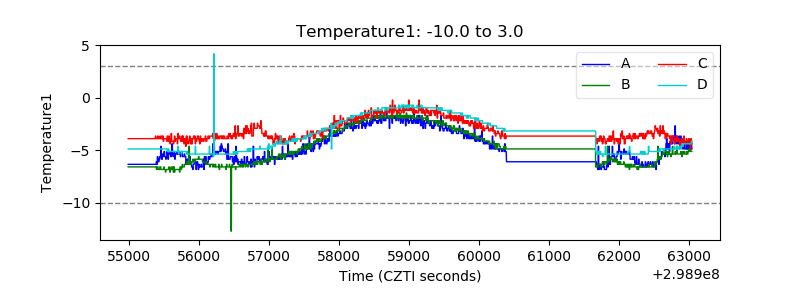 |
| Veto HV Monitor | 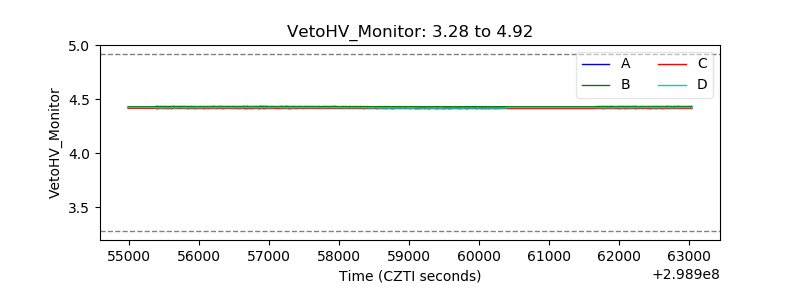 |
| Veto LLD | 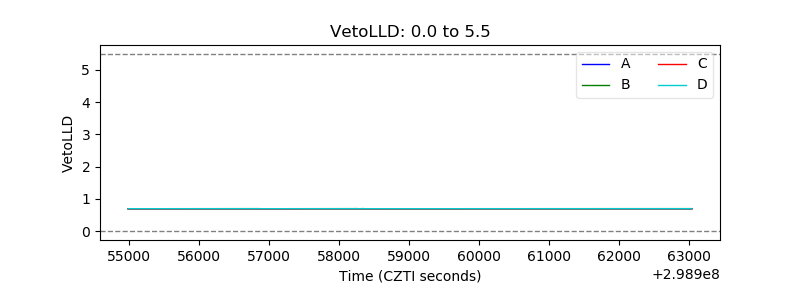 |
| Alpha Counter | 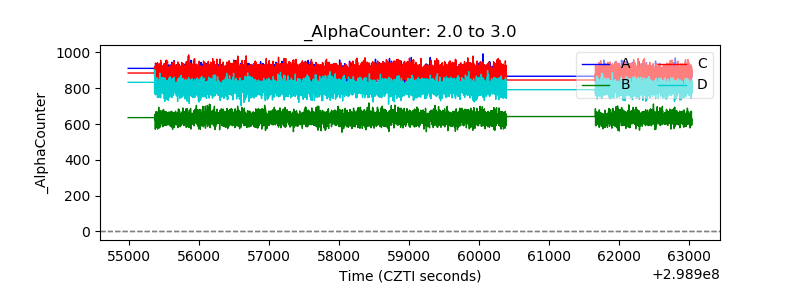 |
| _CPM_Rate | 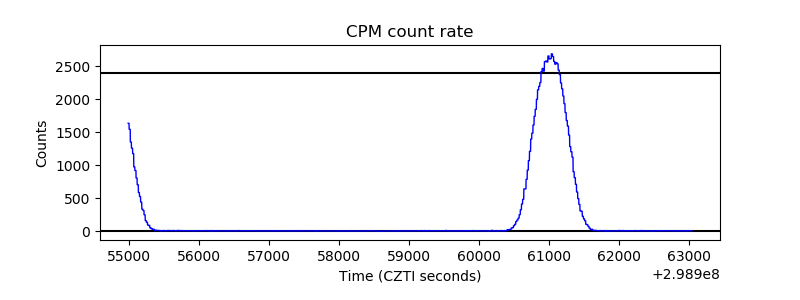 |
| CZT Counter | 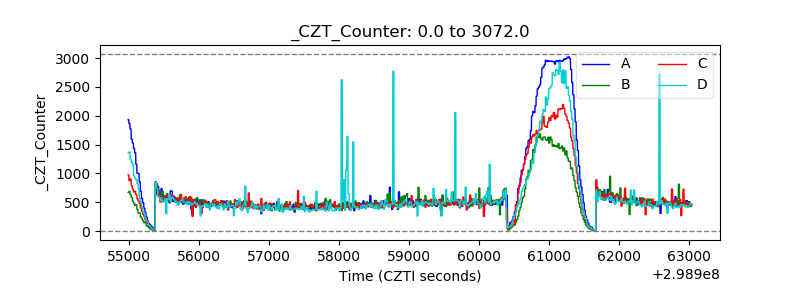 |
| +2.5 Volts monitor |  |
| +5 Volts monitor | 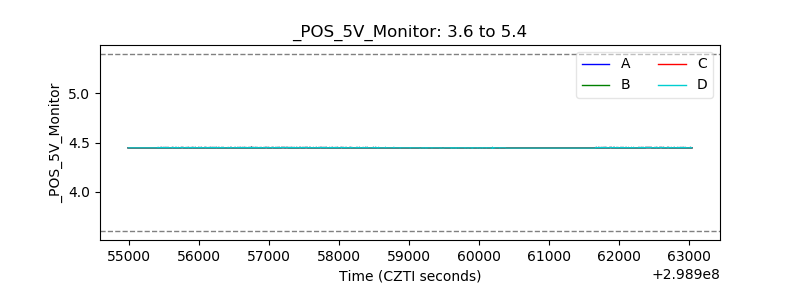 |
| _ROLL_ROT | 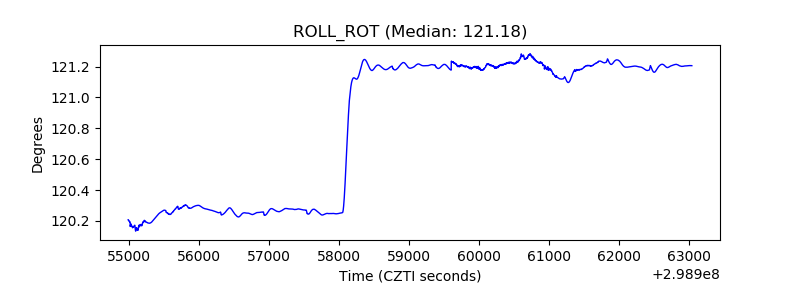 |
| _Roll_DEC |  |
| _Roll_RA | 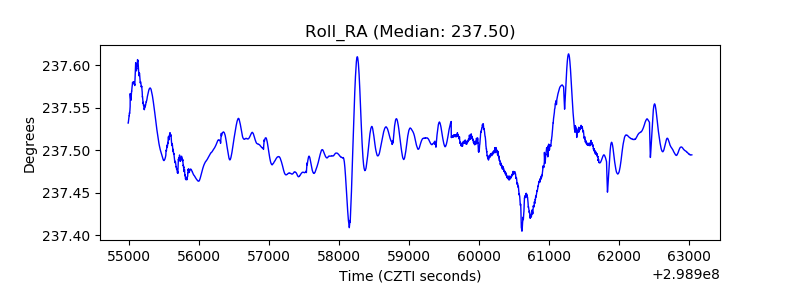 |
| Veto Counter | 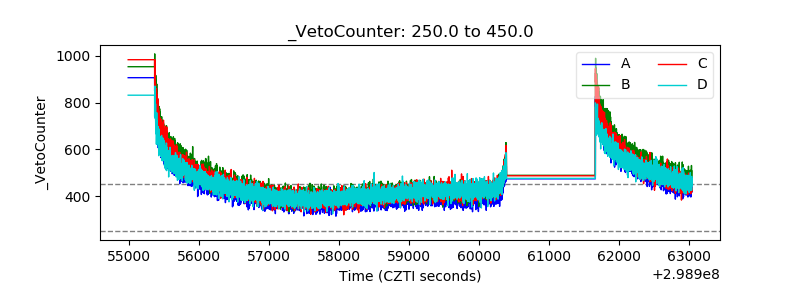 |