| Param | Original file | Final file |
|---|---|---|
| Filename | modeM0/AS1C04_001T01_9000002994_20191cztM0_level2.evt | modeM0/AS1C04_001T01_9000002994_20191cztM0_level2_quad_clean.evt |
| Size (bytes) | 412,744,320 | 123,508,800 |
| Size | 393.6 MB | 117.8 MB |
| Events in quadrant A | 2,914,244 | 863,085 |
| Events in quadrant B | 3,004,417 | 865,011 |
| Events in quadrant C | 2,883,097 | 818,417 |
| Events in quadrant D | 3,305,243 | 790,479 |
| Mode SS | |||
|---|---|---|---|
| Quadrant | BADHDUFLAG | Total packets | Discarded packets |
| A | 0 | 116 | 0 |
| B | 0 | 116 | 0 |
| C | 0 | 116 | 0 |
| D | 0 | 116 | 0 |
| Mode M9 | |||
|---|---|---|---|
| Quadrant | BADHDUFLAG | Total packets | Discarded packets |
| A | 0 | 14 | 0 |
| B | 0 | 14 | 0 |
| C | 0 | 14 | 0 |
| D | 0 | 14 | 0 |
| Mode M0 | |||
|---|---|---|---|
| Quadrant | BADHDUFLAG | Total packets | Discarded packets |
| A | 0 | 12122 | 1 |
| B | 0 | 12384 | 2 |
| C | 0 | 12038 | 1 |
| D | 0 | 13525 | 1 |
| Quadrant | Total seconds | Saturated seconds | Saturation percentage |
|---|---|---|---|
| A | 5784 | 52 | 0.899032% |
| B | 5784 | 65 | 1.123790% |
| C | 5784 | 65 | 1.123790% |
| D | 5784 | 216 | 3.734440% |
Noise dominated data is calculated using 1-second bins in cleaned event files. If a bin has >2000 counts, and if more than 50% of those come from <1% of pixels, then it is considered to be noise-dominated and hence unusable.
| Quadrant | # 1 sec bins | Bins with >0 counts | Bins with >2000 counts | High rate bins dominated by noise | Noise dominated (total time) | Noise dominated (detector-on time) | Marked lightcurve |
|---|---|---|---|---|---|---|---|
| A | 7094 | 5785 | 1 | 1 | 0.01% | 0.02% | 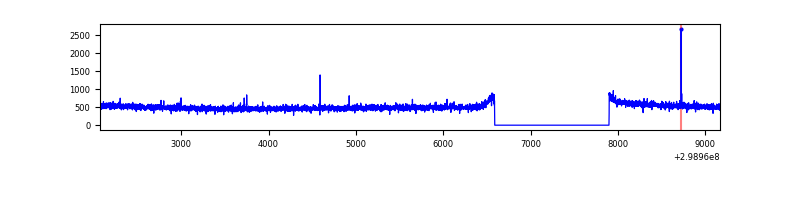 |
| B | 7094 | 5785 | 6 | 6 | 0.08% | 0.10% | 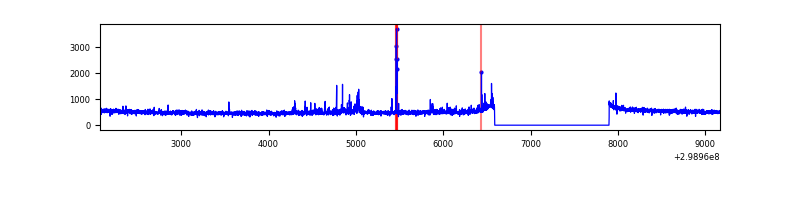 |
| C | 7094 | 5785 | 0 | 0 | 0.00% | 0.00% | 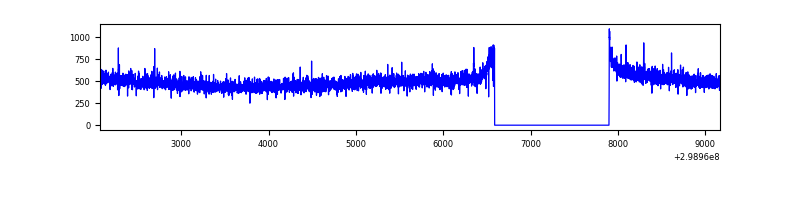 |
| D | 7094 | 5784 | 160 | 160 | 2.26% | 2.77% | 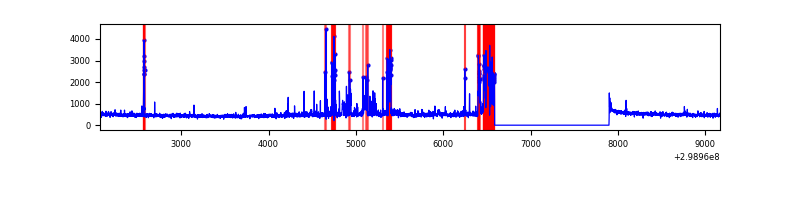 |
Top three noisy pixels from each quadrant. If the there are fewer than three noisy pixels in the level2.evt file, extra rows are filled as -1
| Pixel properties | Quadrant properties | ||||||
|---|---|---|---|---|---|---|---|
| Quadrant | DetID | PixID | Counts | Sigma | Mean | Median | Sigma |
| A | 4 | 2 | 18380 | 116.84 | 752 | 738 | 151.0 |
| A | 0 | 226 | 6652 | 39.17 | 752 | 738 | 151.0 |
| A | 12 | 194 | 5584 | 32.1 | 752 | 738 | 151.0 |
| B | 0 | 197 | 57072 | 410.15 | 739 | 722 | 137.4 |
| B | 15 | 36 | 22969 | 161.93 | 739 | 722 | 137.4 |
| B | 12 | 111 | 15512 | 107.65 | 739 | 722 | 137.4 |
| C | 14 | 238 | 112343 | 689.31 | 702 | 705 | 162.0 |
| C | 3 | 233 | 33618 | 203.22 | 702 | 705 | 162.0 |
| C | 13 | 61 | 5089 | 27.07 | 702 | 705 | 162.0 |
| D | 9 | 1 | 291166 | 1745.41 | 698 | 679 | 166.4 |
| D | 15 | 0 | 111056 | 663.21 | 698 | 679 | 166.4 |
| D | 7 | 38 | 83300 | 496.43 | 698 | 679 | 166.4 |
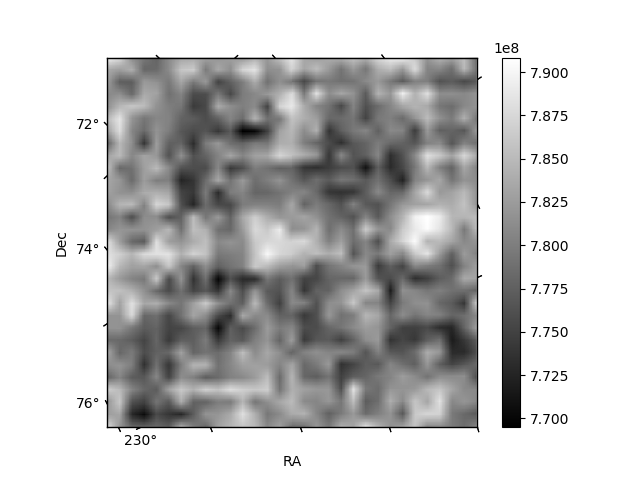
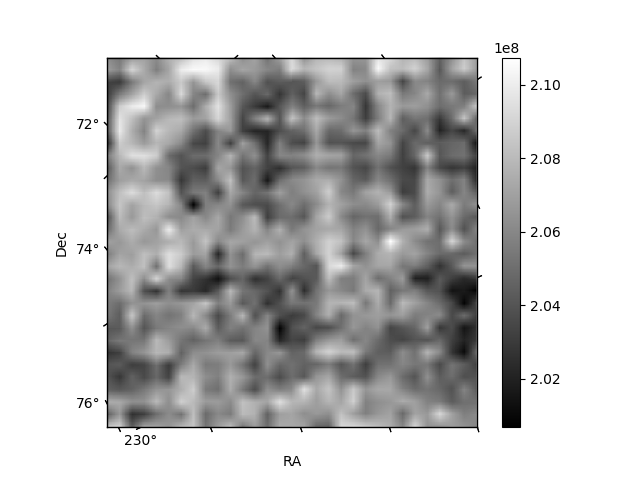
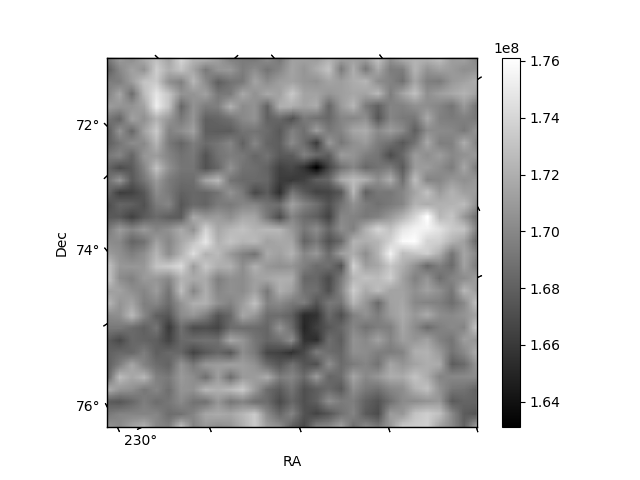
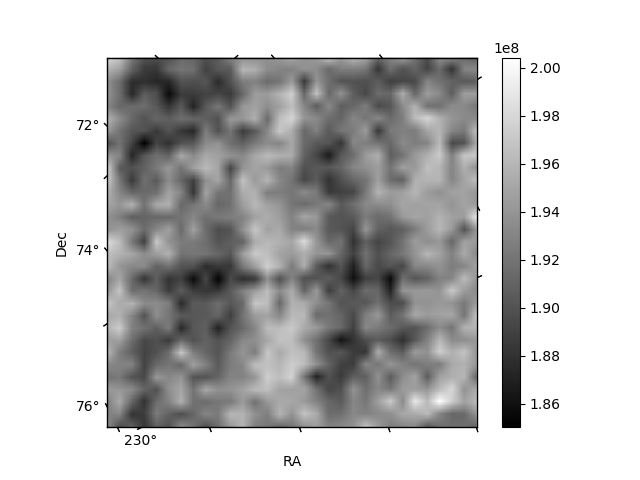
Histogram calculated using DETX and DETY for each event in the final _common_clean file
| Quadrant A | 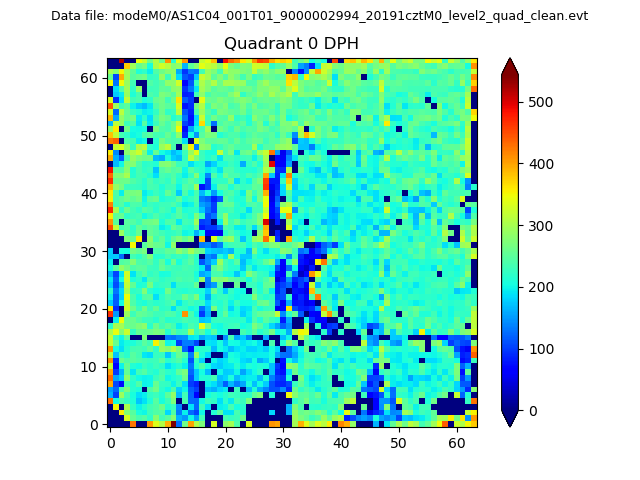 |
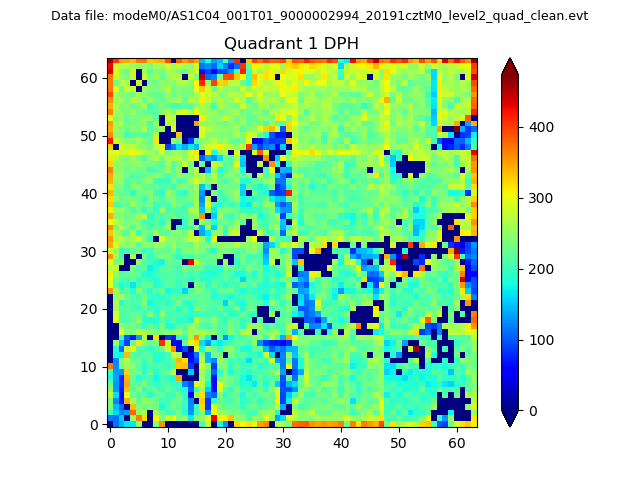 |
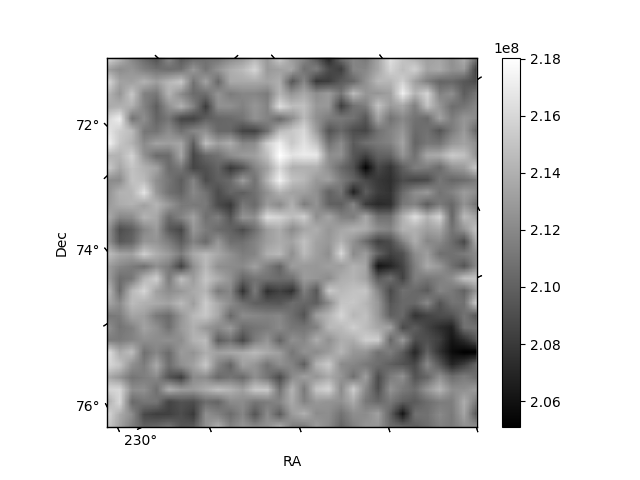
Quadrant B |
|---|---|---|---|
| Quadrant D | 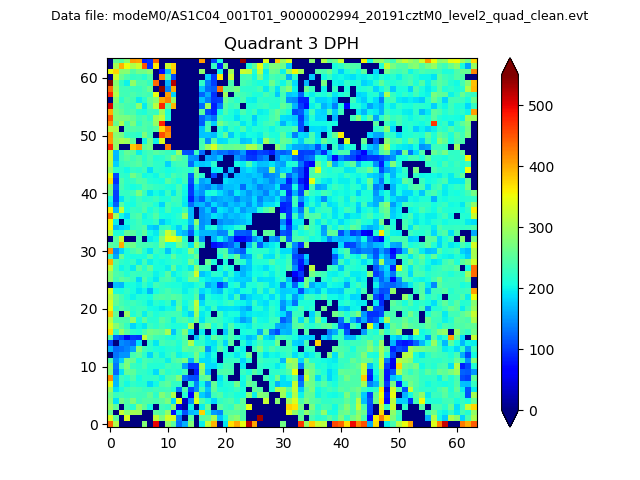 |
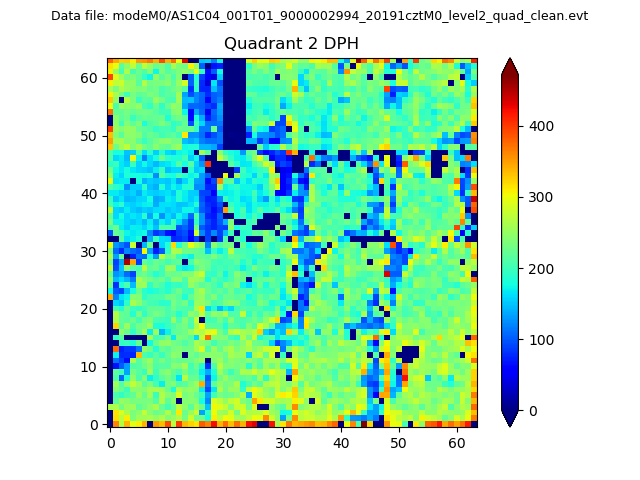 |
Quadrant C |
| Plot type | Count rate plots | Images |
|---|---|---|
| Comparison with Poisson distribution Blue bars denote a histogram of data divided into 1 sec bins. Red curve is a Poisson curve with rate = median count rate of data. |
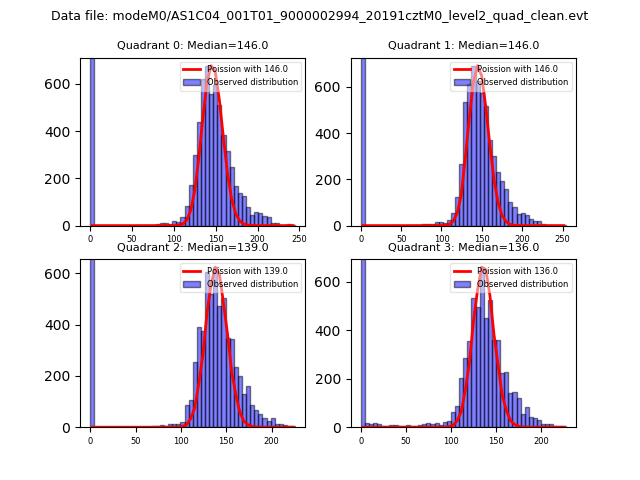 |
 |
| Quadrant-wise count rates Data is divided into 100 sec bins |
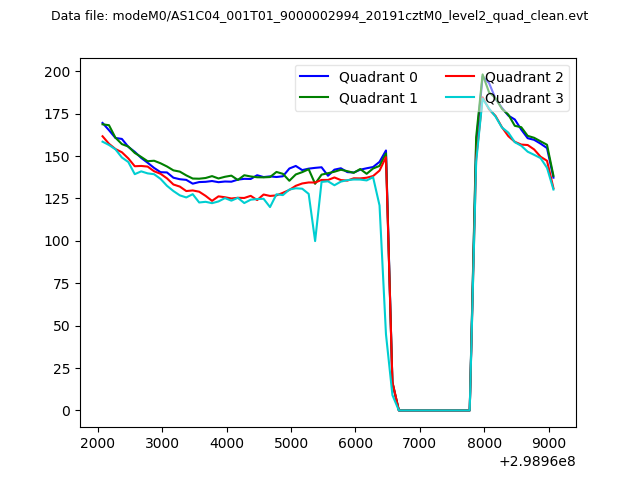 |
|
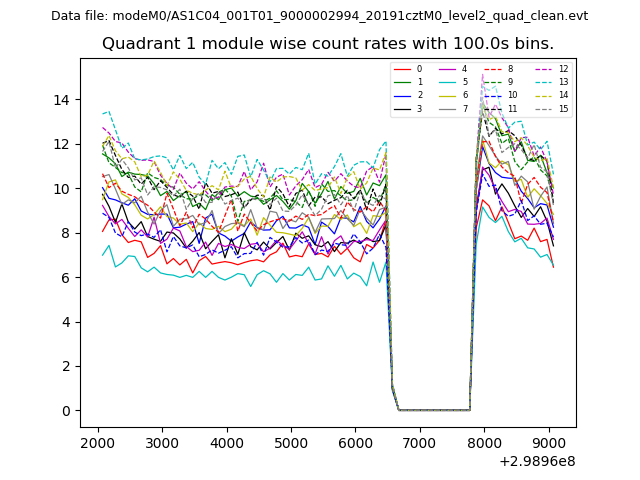
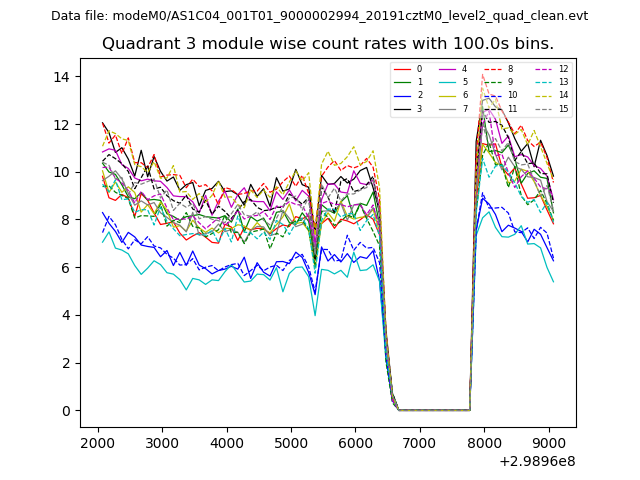
| Module-wise count rates for Quadrant A Data is divided into 100 sec bins |
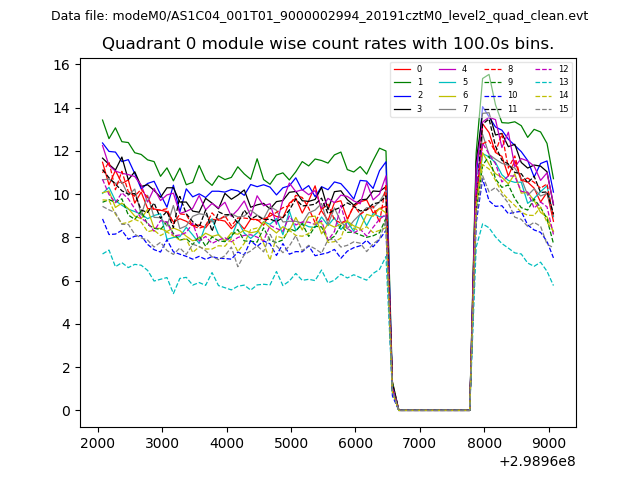 |
 |
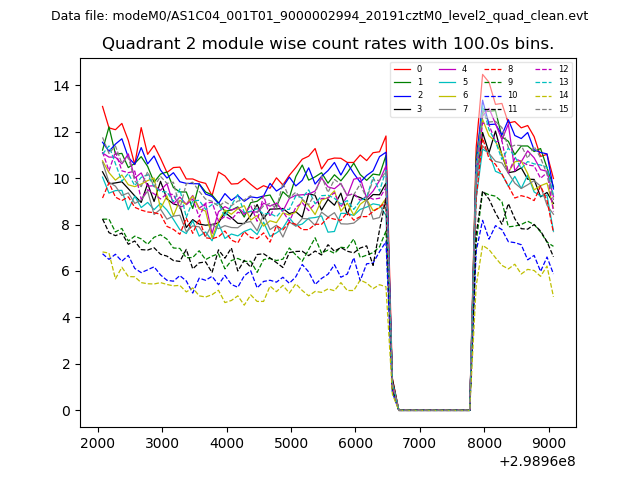
| Module-wise count rates for Quadrant B Data is divided into 100 sec bins |
 |
 |
| Module-wise count rates for Quadrant C Data is divided into 100 sec bins |
 |
 |
| Module-wise count rates for Quadrant D Data is divided into 100 sec bins |
 |
 |
| Parameter | Plot |
|---|---|
| CZT HV Monitor | 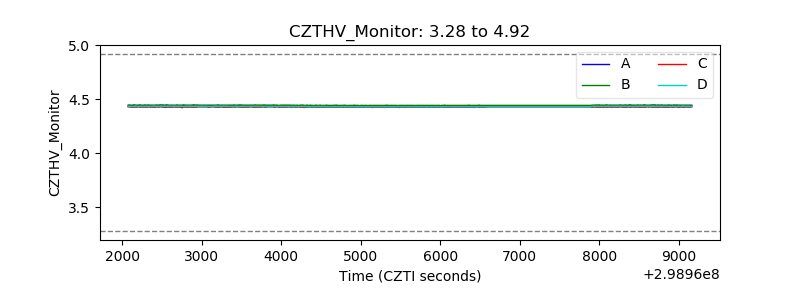 |
| D_VDD | 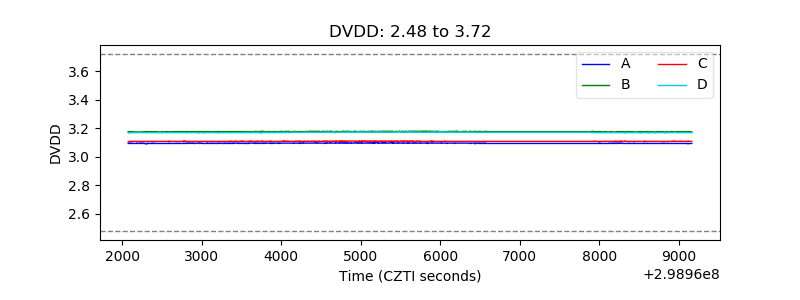 |
| Temperature 1 | 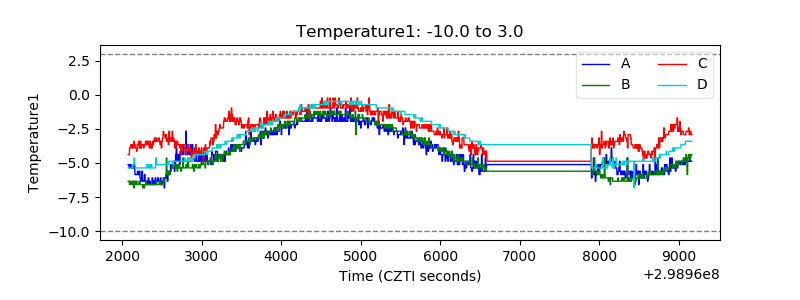 |
| Veto HV Monitor | 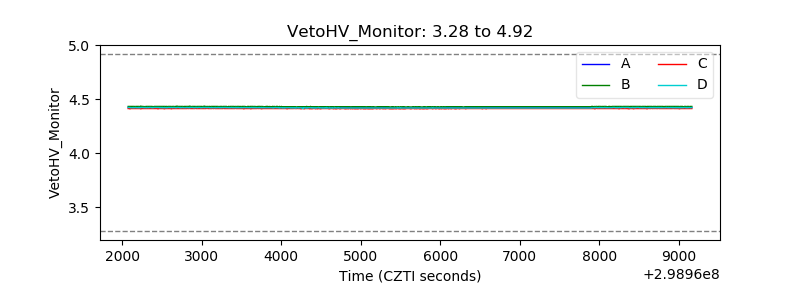 |
| Veto LLD | 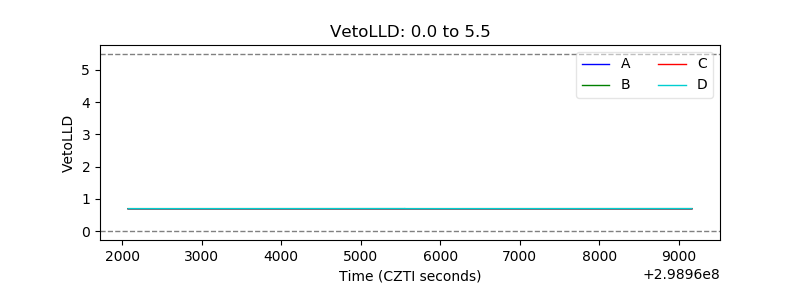 |
| Alpha Counter | 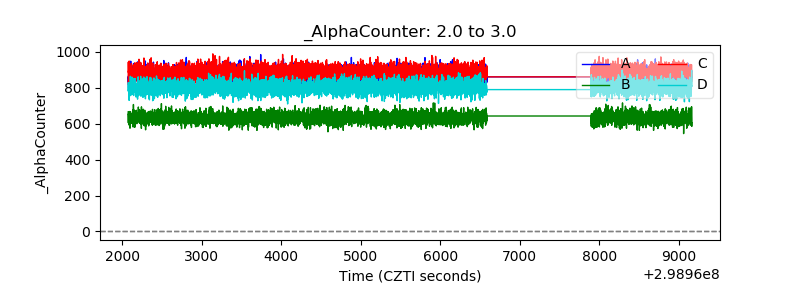 |
| _CPM_Rate | 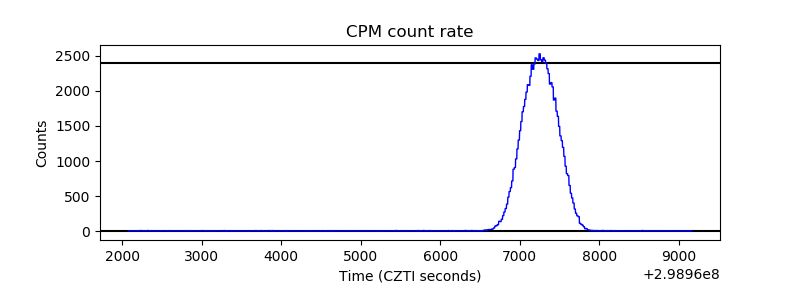 |
| CZT Counter | 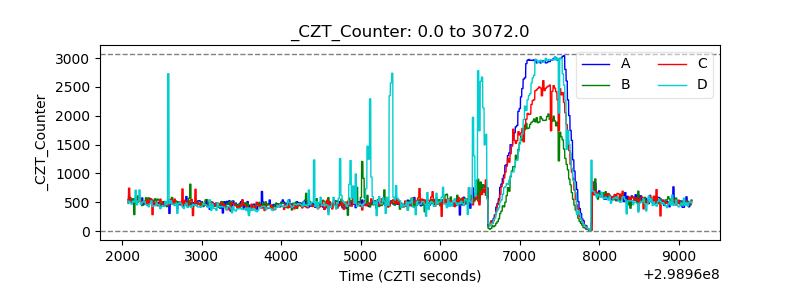 |
| +2.5 Volts monitor |  |
| +5 Volts monitor |  |
| _ROLL_ROT | 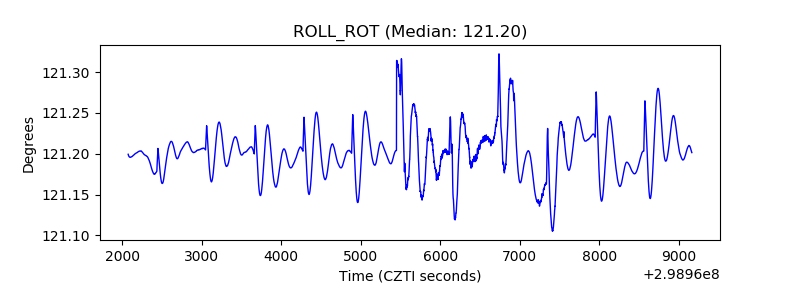 |
| _Roll_DEC | 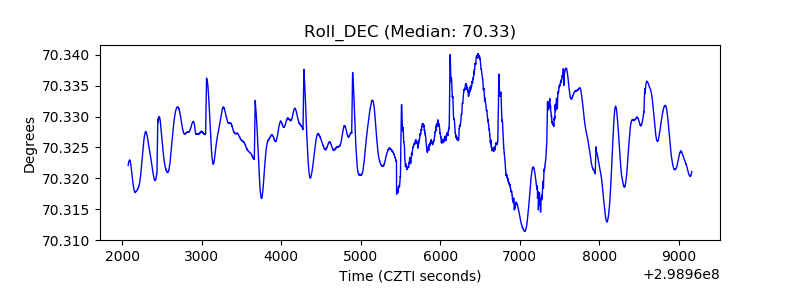 |
| _Roll_RA | 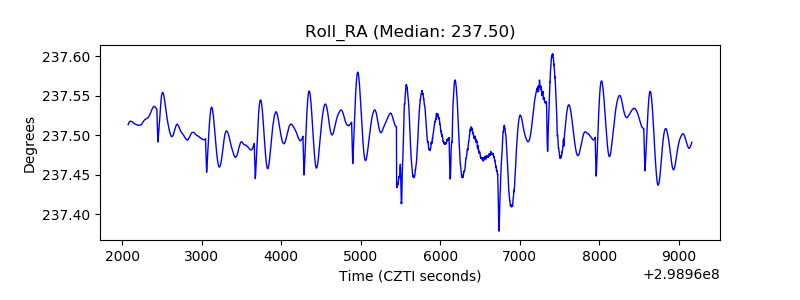 |
| Veto Counter | 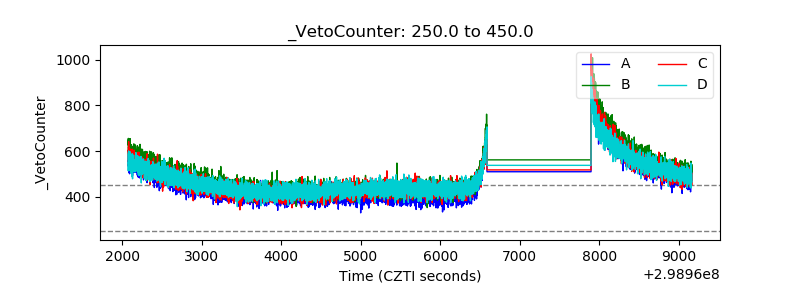 |