| Param | Original file | Final file |
|---|---|---|
| Filename | modeM0/AS1C04_001T01_9000002994_20193cztM0_level2.evt | modeM0/AS1C04_001T01_9000002994_20193cztM0_level2_quad_clean.evt |
| Size (bytes) | 417,974,400 | 123,598,080 |
| Size | 398.6 MB | 117.9 MB |
| Events in quadrant A | 2,963,450 | 861,893 |
| Events in quadrant B | 3,075,981 | 857,832 |
| Events in quadrant C | 2,969,621 | 813,315 |
| Events in quadrant D | 3,251,664 | 801,822 |
| Mode SS | |||
|---|---|---|---|
| Quadrant | BADHDUFLAG | Total packets | Discarded packets |
| A | 0 | 118 | 0 |
| B | 0 | 118 | 0 |
| C | 0 | 118 | 0 |
| D | 0 | 118 | 0 |
| Mode M9 | |||
|---|---|---|---|
| Quadrant | BADHDUFLAG | Total packets | Discarded packets |
| A | 0 | 13 | 0 |
| B | 0 | 13 | 0 |
| C | 0 | 13 | 0 |
| D | 0 | 13 | 0 |
| Mode M0 | |||
|---|---|---|---|
| Quadrant | BADHDUFLAG | Total packets | Discarded packets |
| A | 0 | 12243 | 1 |
| B | 0 | 12560 | 1 |
| C | 0 | 12212 | 1 |
| D | 0 | 13325 | 1 |
| Quadrant | Total seconds | Saturated seconds | Saturation percentage |
|---|---|---|---|
| A | 5852 | 101 | 1.725906% |
| B | 5852 | 116 | 1.982228% |
| C | 5853 | 93 | 1.588929% |
| D | 5853 | 147 | 2.511533% |
Noise dominated data is calculated using 1-second bins in cleaned event files. If a bin has >2000 counts, and if more than 50% of those come from <1% of pixels, then it is considered to be noise-dominated and hence unusable.
| Quadrant | # 1 sec bins | Bins with >0 counts | Bins with >2000 counts | High rate bins dominated by noise | Noise dominated (total time) | Noise dominated (detector-on time) | Marked lightcurve |
|---|---|---|---|---|---|---|---|
| A | 7132 | 5853 | 13 | 13 | 0.18% | 0.22% | 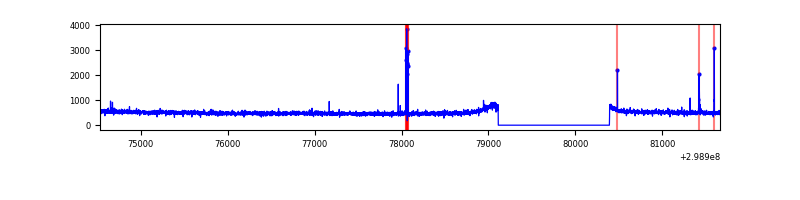 |
| B | 7132 | 5853 | 7 | 7 | 0.10% | 0.12% | 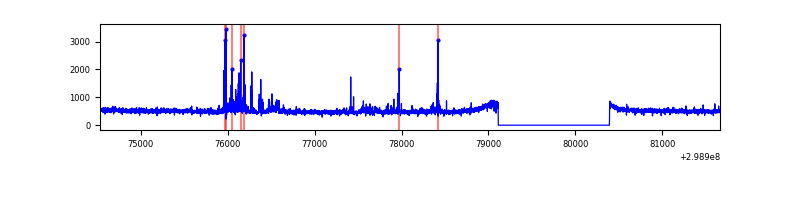 |
| C | 7133 | 5854 | 0 | 0 | 0.00% | 0.00% | 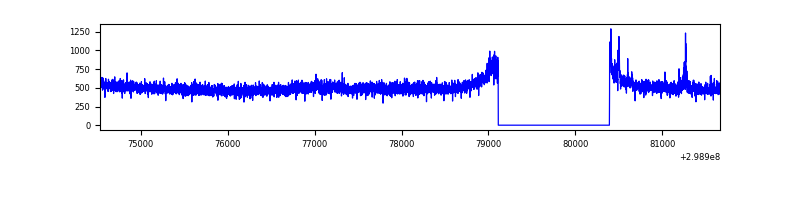 |
| D | 7133 | 5854 | 73 | 73 | 1.02% | 1.25% | 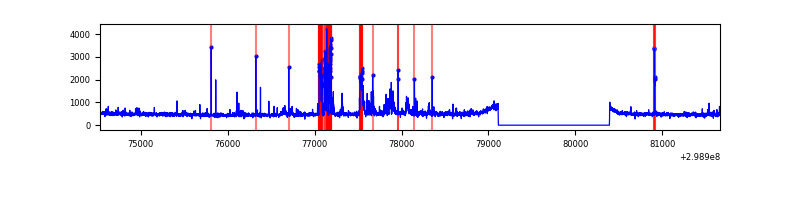 |
Top three noisy pixels from each quadrant. If the there are fewer than three noisy pixels in the level2.evt file, extra rows are filled as -1
| Pixel properties | Quadrant properties | ||||||
|---|---|---|---|---|---|---|---|
| Quadrant | DetID | PixID | Counts | Sigma | Mean | Median | Sigma |
| A | 14 | 238 | 35970 | 233.77 | 755 | 740 | 150.7 |
| A | 4 | 2 | 19065 | 121.6 | 755 | 740 | 150.7 |
| A | 0 | 226 | 6721 | 39.69 | 755 | 740 | 150.7 |
| B | 7 | 220 | 63124 | 450.03 | 742 | 726 | 138.7 |
| B | 0 | 197 | 57534 | 409.71 | 742 | 726 | 138.7 |
| B | 0 | 190 | 16765 | 115.68 | 742 | 726 | 138.7 |
| C | 14 | 238 | 112974 | 693.68 | 708 | 712 | 161.8 |
| C | 3 | 233 | 86808 | 532.0 | 708 | 712 | 161.8 |
| C | 13 | 61 | 5056 | 26.84 | 708 | 712 | 161.8 |
| D | 7 | 38 | 294368 | 1693.49 | 727 | 706 | 173.4 |
| D | 9 | 1 | 49582 | 281.86 | 727 | 706 | 173.4 |
| D | 15 | 0 | 30657 | 172.72 | 727 | 706 | 173.4 |
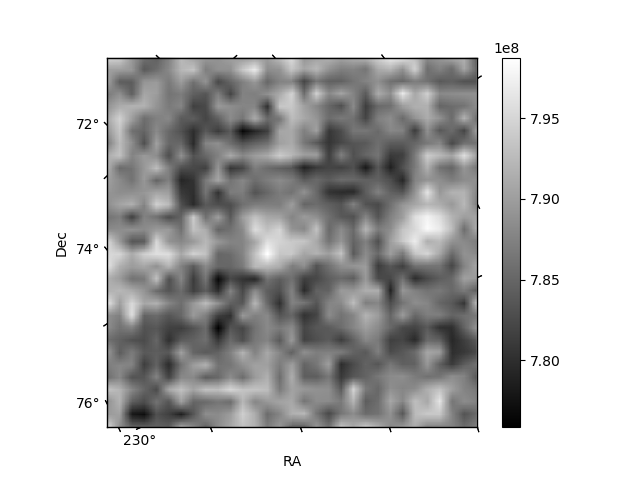
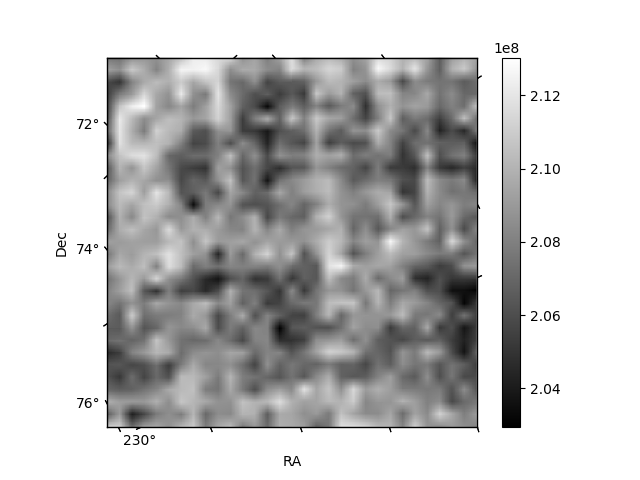
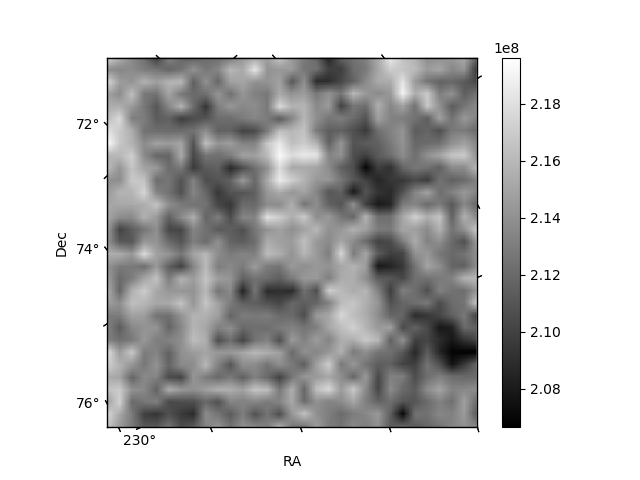
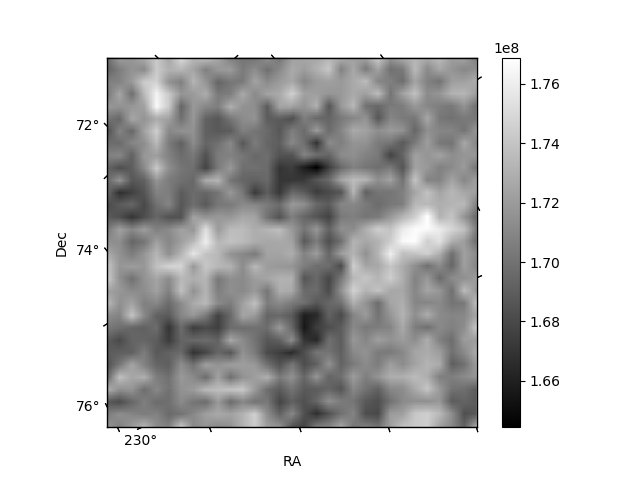
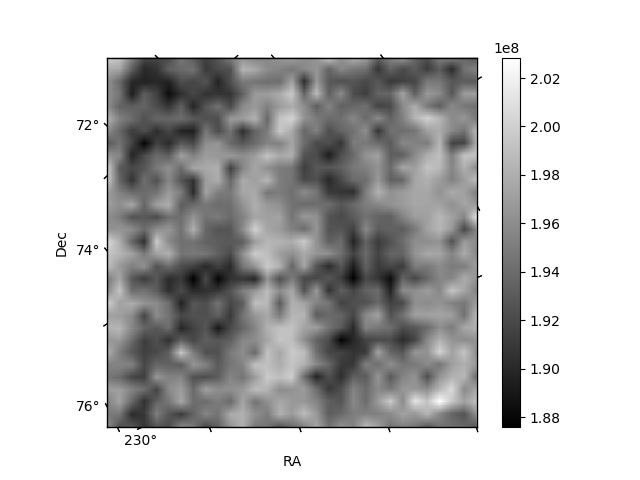
Histogram calculated using DETX and DETY for each event in the final _common_clean file
| Quadrant A | 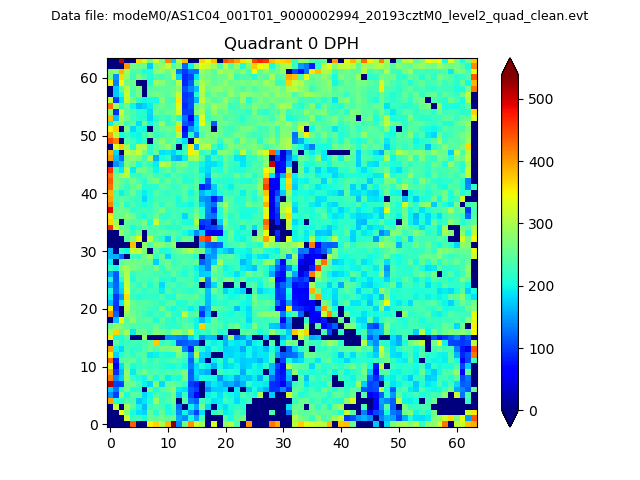 |
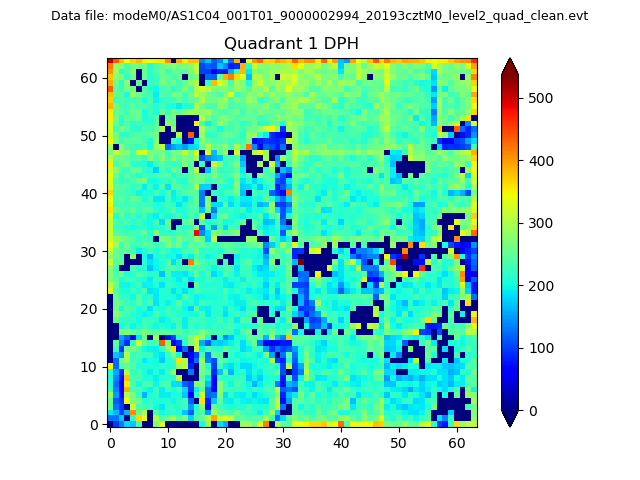 |
Quadrant B |
|---|---|---|---|
| Quadrant D | 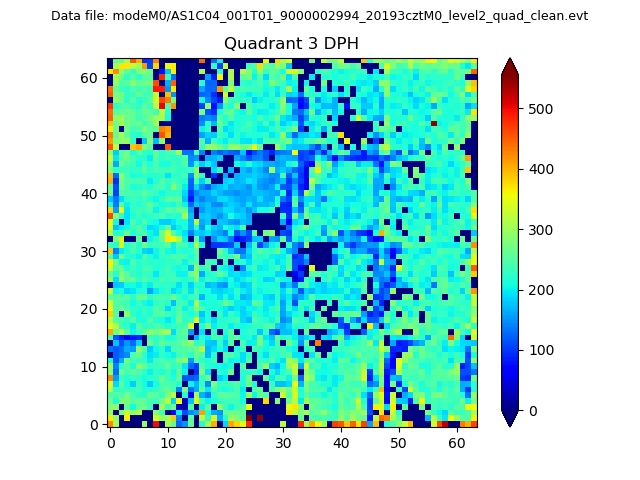 |
 |
Quadrant C |
| Plot type | Count rate plots | Images |
|---|---|---|
| Comparison with Poisson distribution Blue bars denote a histogram of data divided into 1 sec bins. Red curve is a Poisson curve with rate = median count rate of data. |
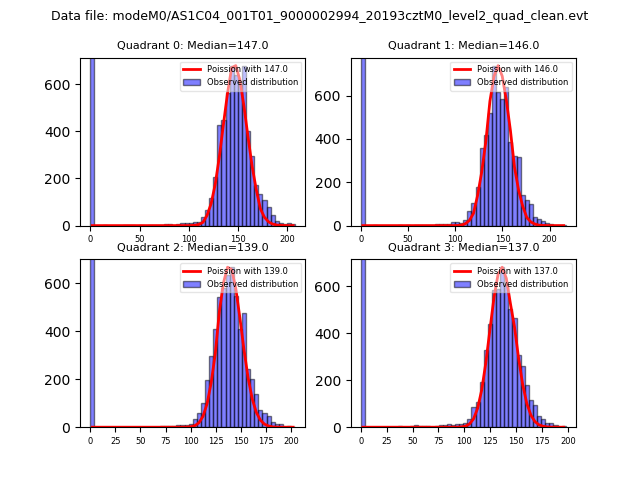 |
 |
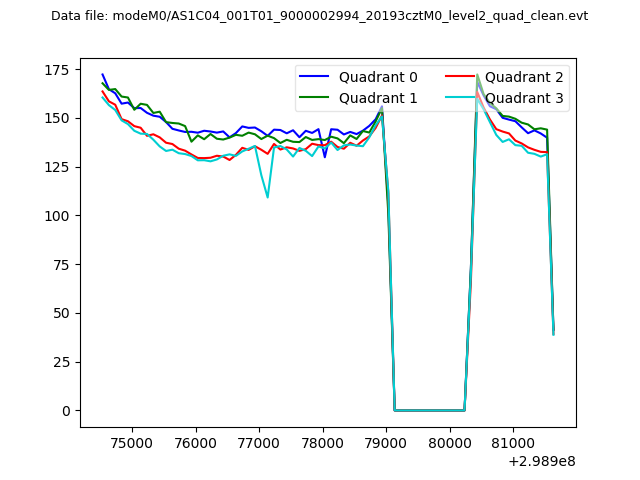
| Quadrant-wise count rates Data is divided into 100 sec bins |
 |
|
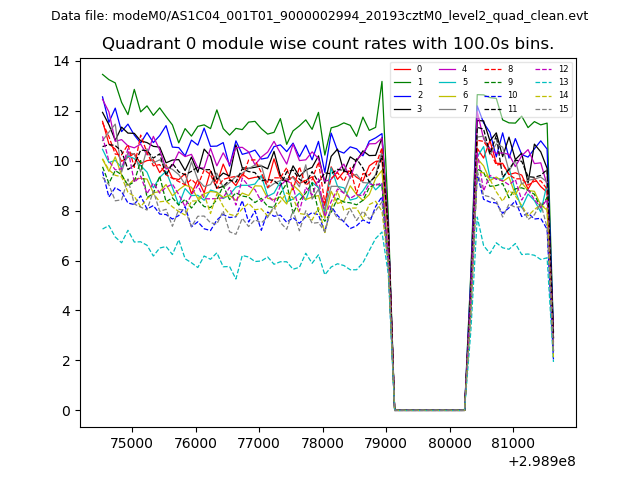
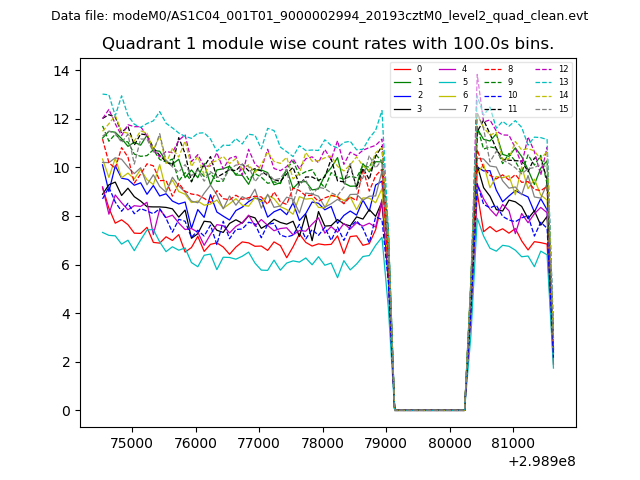
| Module-wise count rates for Quadrant A Data is divided into 100 sec bins |
 |
 |
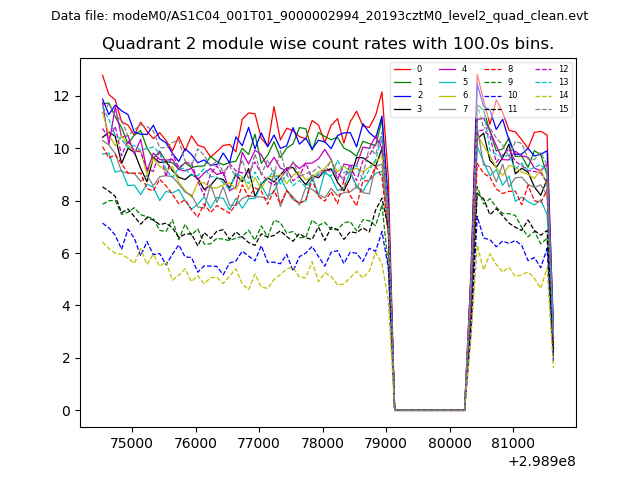
| Module-wise count rates for Quadrant B Data is divided into 100 sec bins |
 |
 |
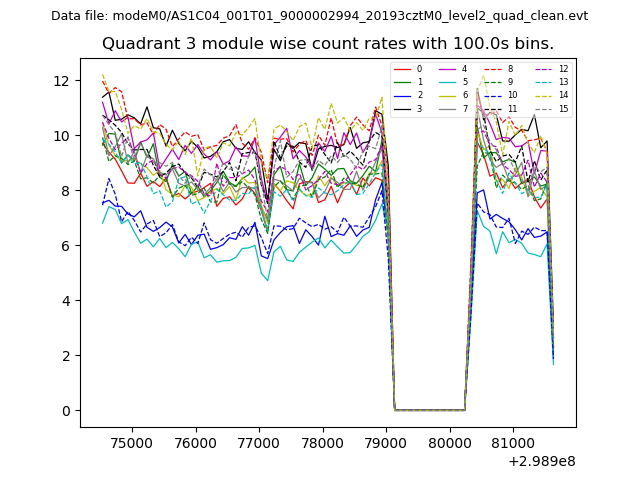
| Module-wise count rates for Quadrant C Data is divided into 100 sec bins |
 |
 |
| Module-wise count rates for Quadrant D Data is divided into 100 sec bins |
 |
 |
| Parameter | Plot |
|---|---|
| CZT HV Monitor | 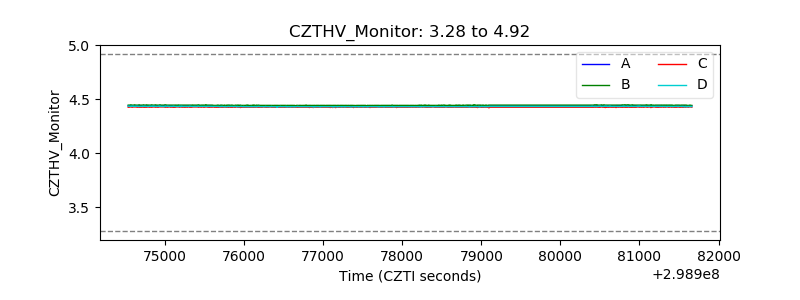 |
| D_VDD | 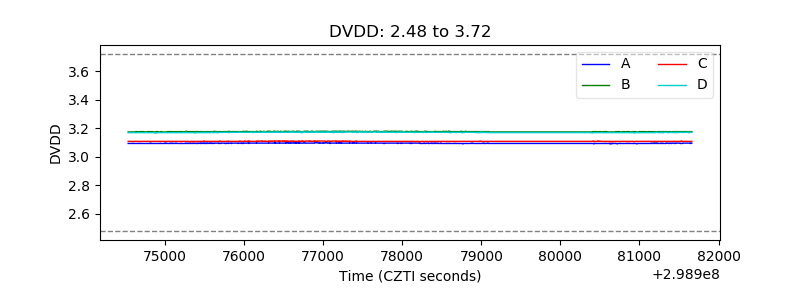 |
| Temperature 1 | 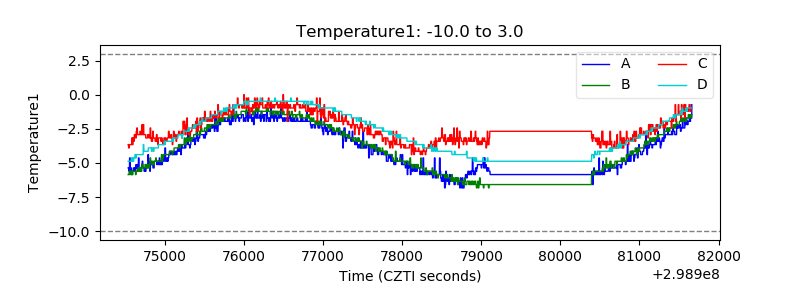 |
| Veto HV Monitor | 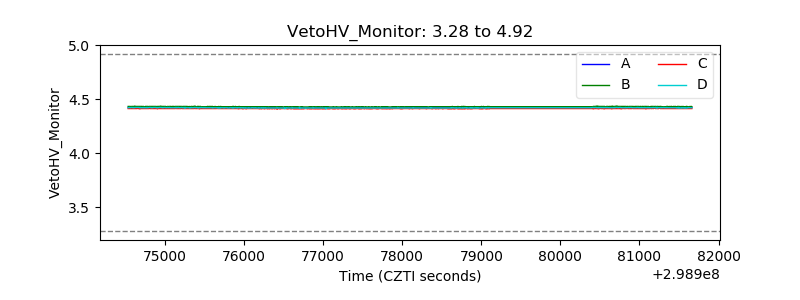 |
| Veto LLD | 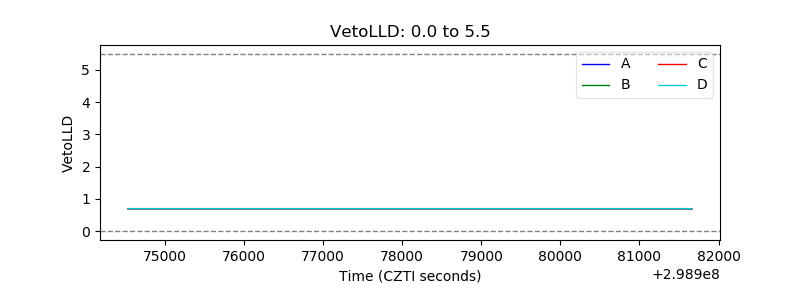 |
| Alpha Counter | 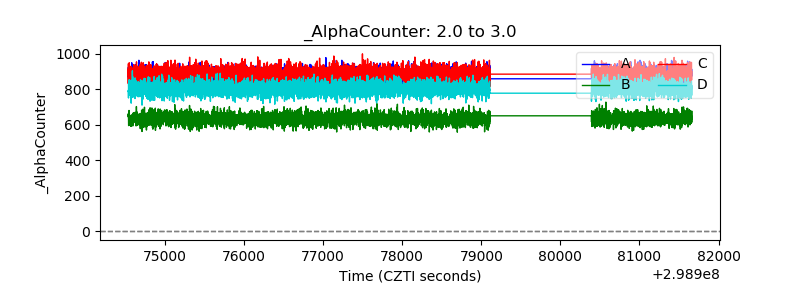 |
| _CPM_Rate | 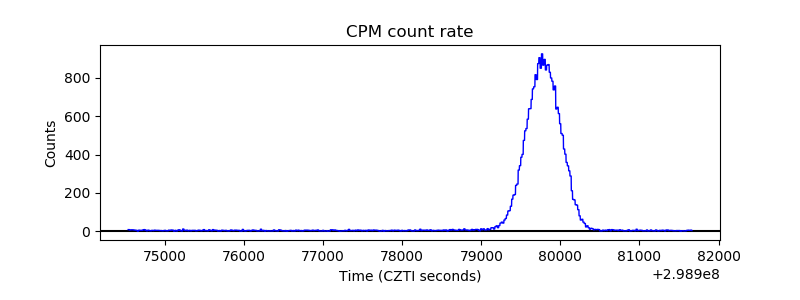 |
| CZT Counter | 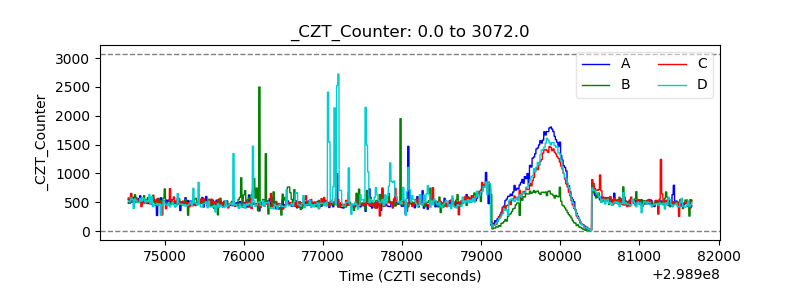 |
| +2.5 Volts monitor |  |
| +5 Volts monitor |  |
| _ROLL_ROT | 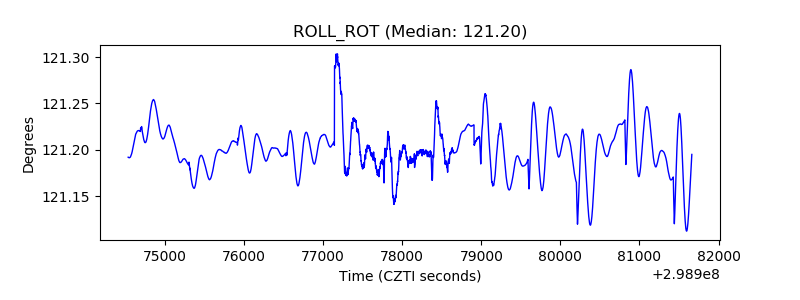 |
| _Roll_DEC | 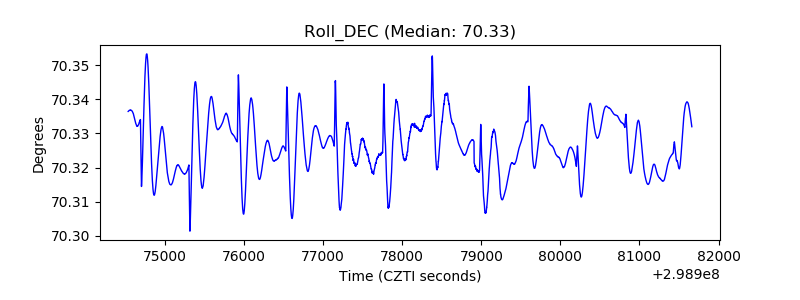 |
| _Roll_RA | 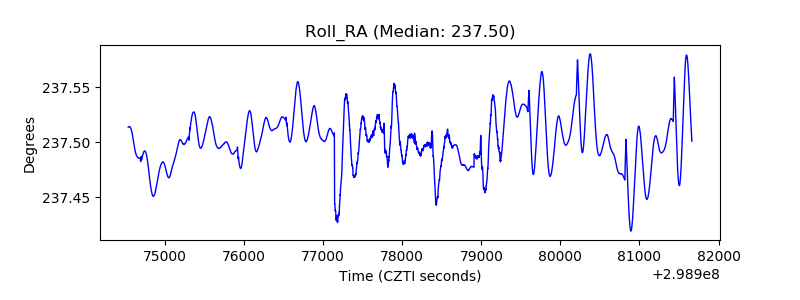 |
| Veto Counter | 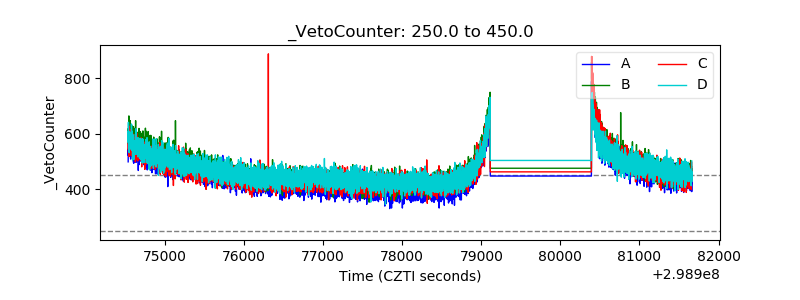 |