| Param | Original file | Final file |
|---|---|---|
| Filename | modeM0/AS1C04_001T01_9000002994_20194cztM0_level2.evt | modeM0/AS1C04_001T01_9000002994_20194cztM0_level2_quad_clean.evt |
| Size (bytes) | 497,738,880 | 129,680,640 |
| Size | 474.7 MB | 123.7 MB |
| Events in quadrant A | 3,152,698 | 904,648 |
| Events in quadrant B | 3,622,271 | 894,690 |
| Events in quadrant C | 3,185,635 | 856,480 |
| Events in quadrant D | 4,669,072 | 815,642 |
| Mode SS | |||
|---|---|---|---|
| Quadrant | BADHDUFLAG | Total packets | Discarded packets |
| A | 0 | 132 | 0 |
| B | 0 | 132 | 0 |
| C | 0 | 132 | 0 |
| D | 0 | 132 | 0 |
| Mode M9 | |||
|---|---|---|---|
| Quadrant | BADHDUFLAG | Total packets | Discarded packets |
| A | 0 | 10 | 0 |
| B | 0 | 10 | 0 |
| C | 0 | 10 | 0 |
| D | 0 | 10 | 0 |
| Mode M0 | |||
|---|---|---|---|
| Quadrant | BADHDUFLAG | Total packets | Discarded packets |
| A | 0 | 13426 | 1 |
| B | 0 | 14835 | 1 |
| C | 0 | 13449 | 1 |
| D | 0 | 18155 | 1 |
| Quadrant | Total seconds | Saturated seconds | Saturation percentage |
|---|---|---|---|
| A | 6544 | 103 | 1.573961% |
| B | 6544 | 172 | 2.628362% |
| C | 6544 | 115 | 1.757335% |
| D | 6545 | 553 | 8.449198% |
Noise dominated data is calculated using 1-second bins in cleaned event files. If a bin has >2000 counts, and if more than 50% of those come from <1% of pixels, then it is considered to be noise-dominated and hence unusable.
| Quadrant | # 1 sec bins | Bins with >0 counts | Bins with >2000 counts | High rate bins dominated by noise | Noise dominated (total time) | Noise dominated (detector-on time) | Marked lightcurve |
|---|---|---|---|---|---|---|---|
| A | 7584 | 6545 | 2 | 2 | 0.03% | 0.03% | 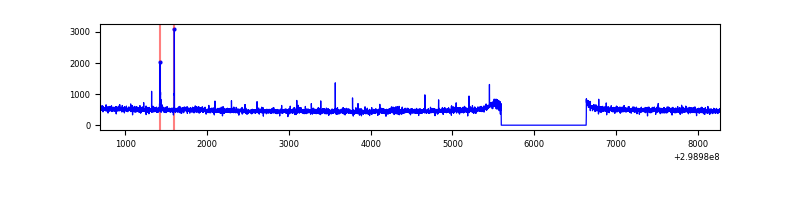 |
| B | 7584 | 6545 | 40 | 40 | 0.53% | 0.61% | 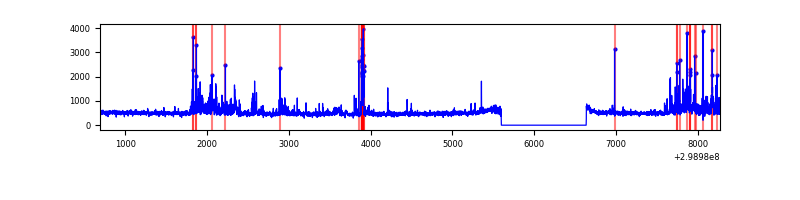 |
| C | 7584 | 6545 | 0 | 0 | 0.00% | 0.00% | 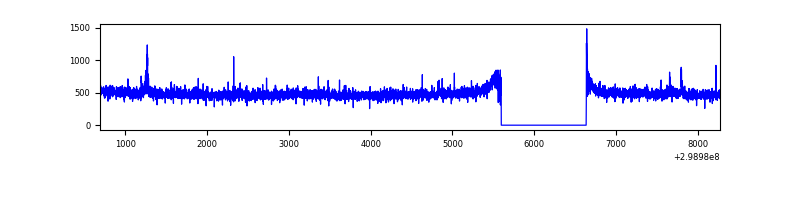 |
| D | 7585 | 6546 | 350 | 350 | 4.61% | 5.35% | 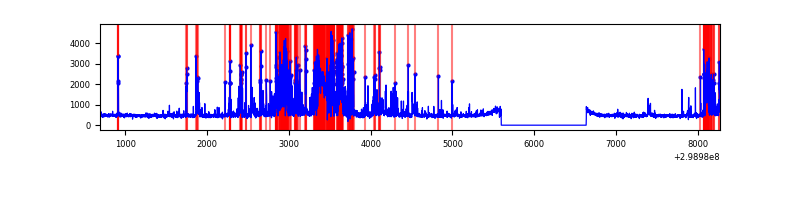 |
Top three noisy pixels from each quadrant. If the there are fewer than three noisy pixels in the level2.evt file, extra rows are filled as -1
| Pixel properties | Quadrant properties | ||||||
|---|---|---|---|---|---|---|---|
| Quadrant | DetID | PixID | Counts | Sigma | Mean | Median | Sigma |
| A | 4 | 2 | 18390 | 107.92 | 809 | 792 | 163.1 |
| A | 14 | 238 | 7966 | 43.99 | 809 | 792 | 163.1 |
| A | 0 | 226 | 7164 | 39.07 | 809 | 792 | 163.1 |
| B | 7 | 220 | 304529 | 2043.79 | 793 | 774 | 148.6 |
| B | 0 | 197 | 93712 | 625.32 | 793 | 774 | 148.6 |
| B | 0 | 190 | 53353 | 353.77 | 793 | 774 | 148.6 |
| C | 14 | 238 | 119992 | 678.68 | 765 | 768 | 175.7 |
| C | 3 | 233 | 76804 | 432.83 | 765 | 768 | 175.7 |
| C | 1 | 16 | 5751 | 28.37 | 765 | 768 | 175.7 |
| D | 9 | 1 | 879022 | 4790.91 | 758 | 734 | 183.3 |
| D | 11 | 176 | 437299 | 2381.39 | 758 | 734 | 183.3 |
| D | 7 | 238 | 118012 | 639.73 | 758 | 734 | 183.3 |
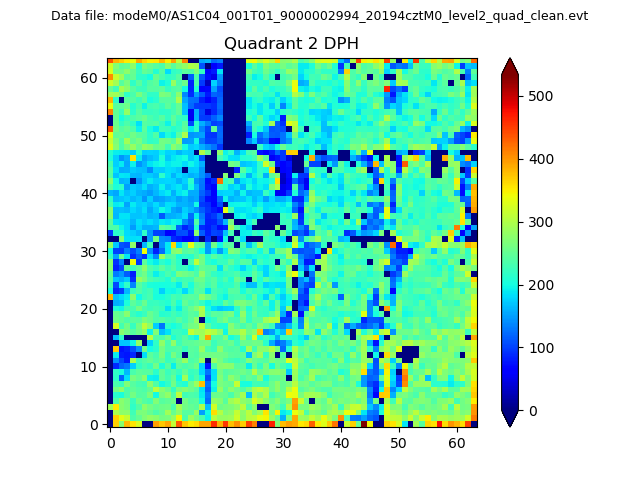
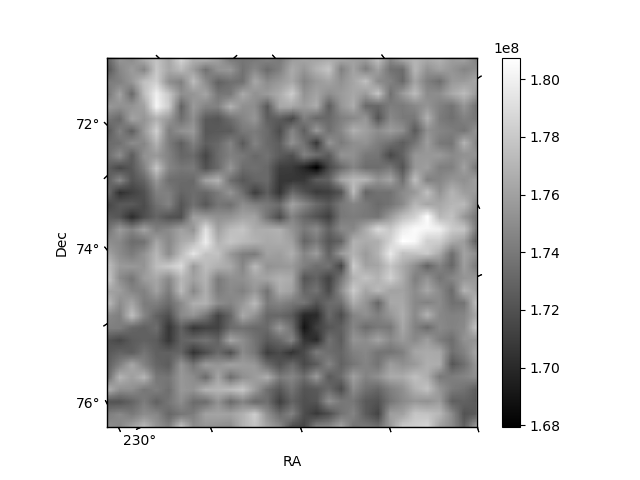
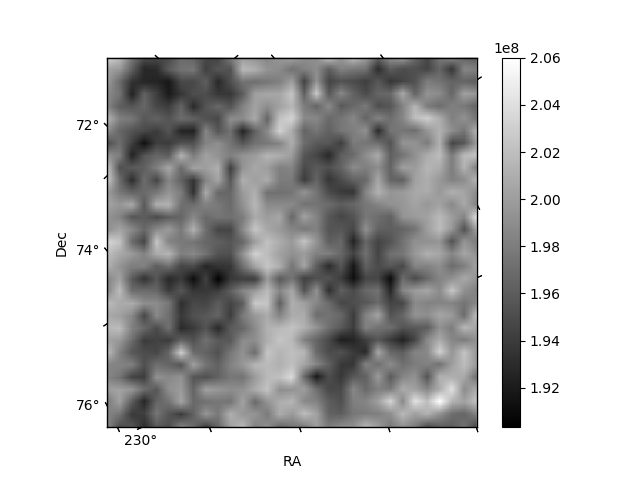
Histogram calculated using DETX and DETY for each event in the final _common_clean file
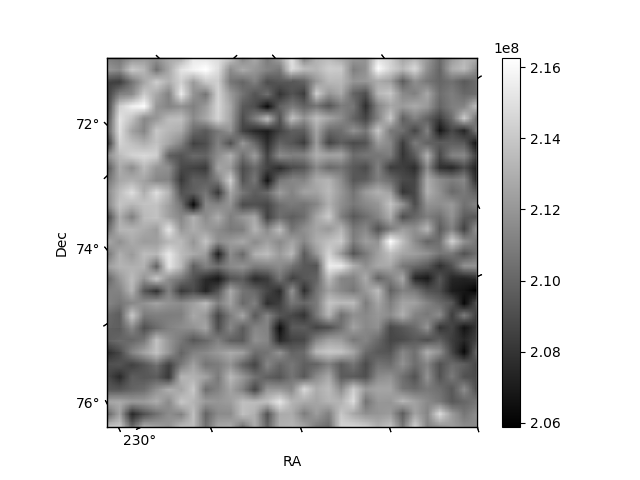
| Quadrant A | 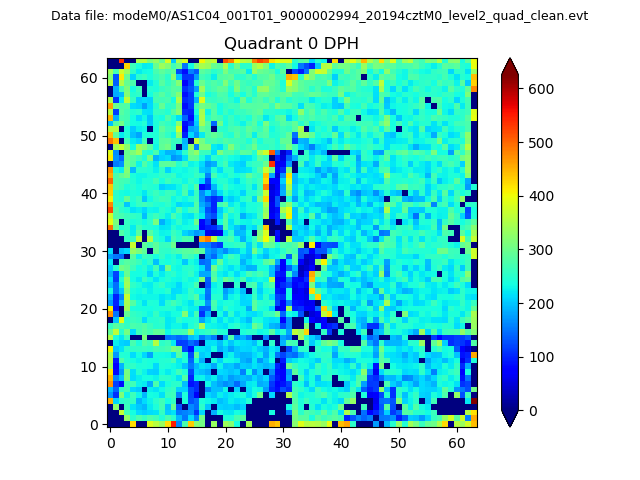 |
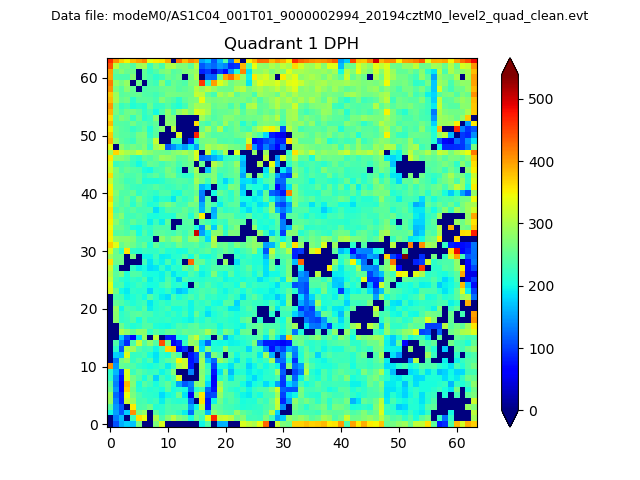 |
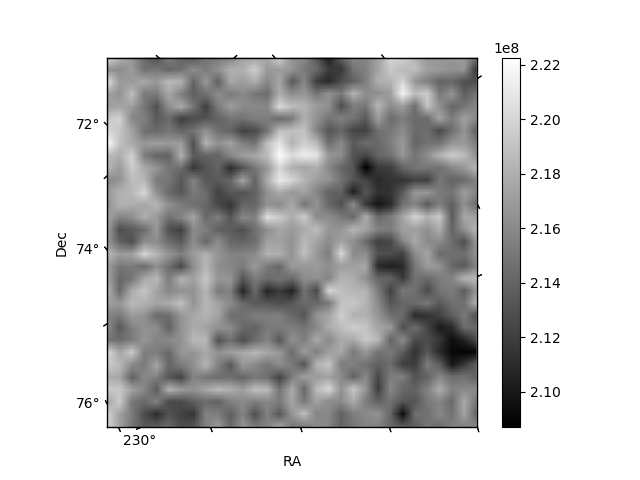
Quadrant B |
|---|---|---|---|
| Quadrant D | 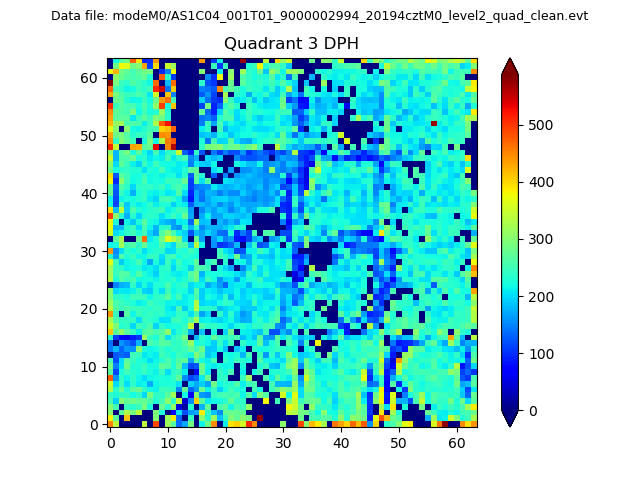 |
 |
Quadrant C |
| Plot type | Count rate plots | Images |
|---|---|---|
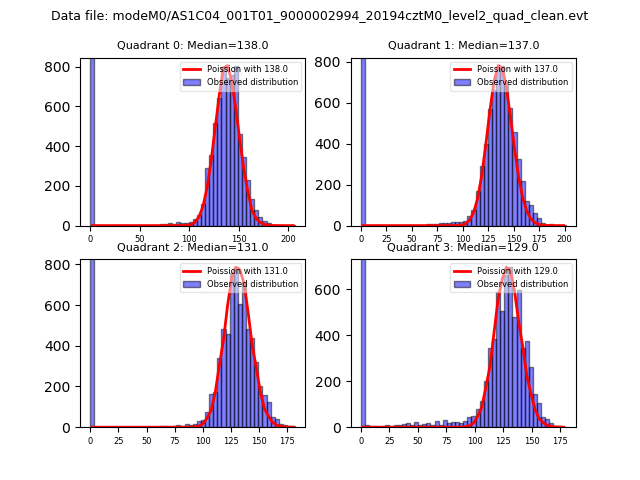
| Comparison with Poisson distribution Blue bars denote a histogram of data divided into 1 sec bins. Red curve is a Poisson curve with rate = median count rate of data. |
 |
 |
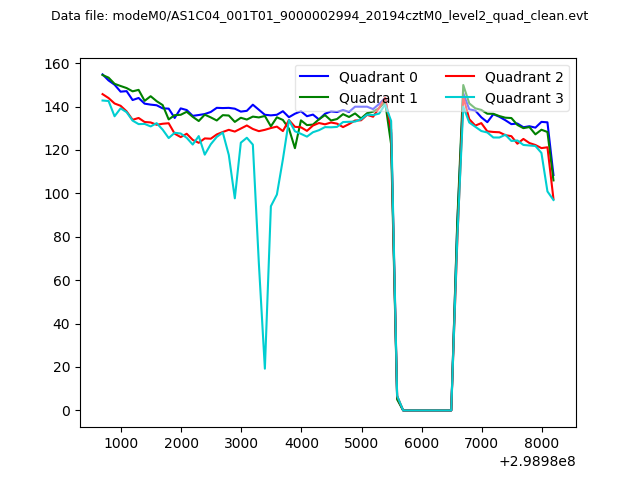
| Quadrant-wise count rates Data is divided into 100 sec bins |
 |
|
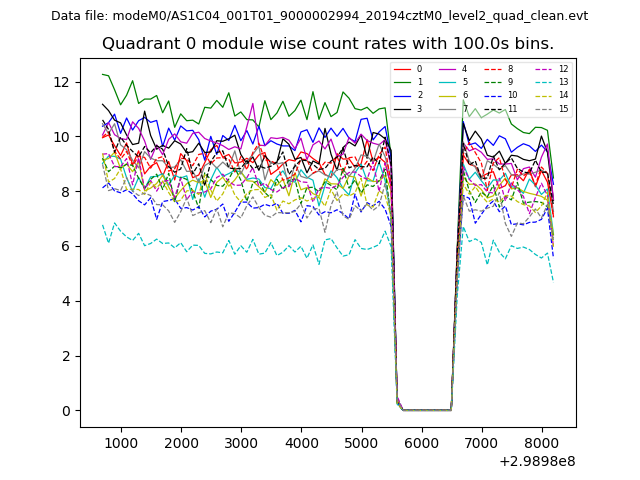
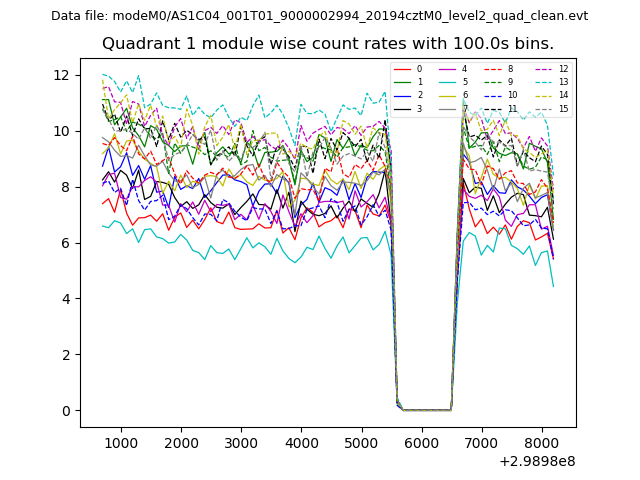
| Module-wise count rates for Quadrant A Data is divided into 100 sec bins |
 |
 |
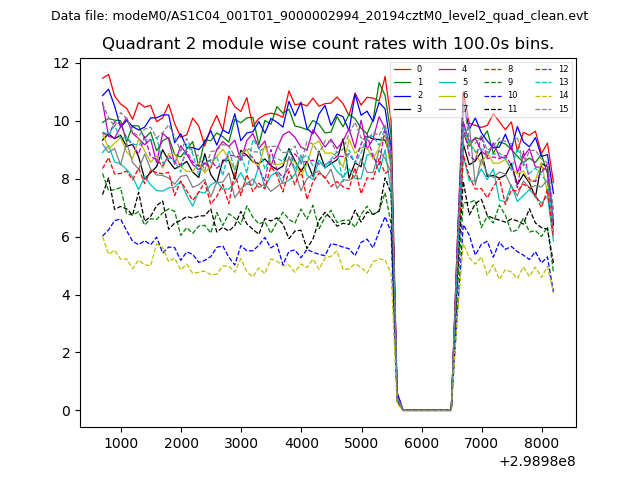
| Module-wise count rates for Quadrant B Data is divided into 100 sec bins |
 |
 |
| Module-wise count rates for Quadrant C Data is divided into 100 sec bins |
 |
 |
| Module-wise count rates for Quadrant D Data is divided into 100 sec bins |
 |
 |
| Parameter | Plot |
|---|---|
| CZT HV Monitor | 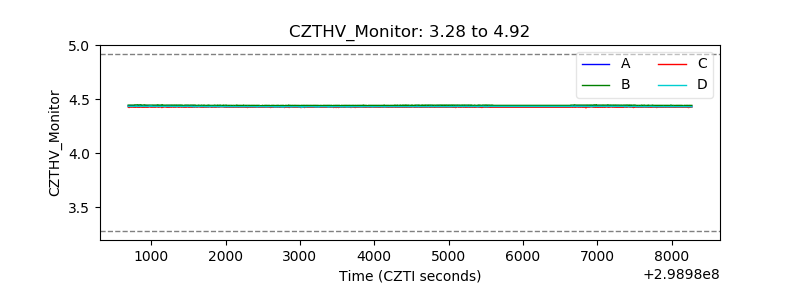 |
| D_VDD | 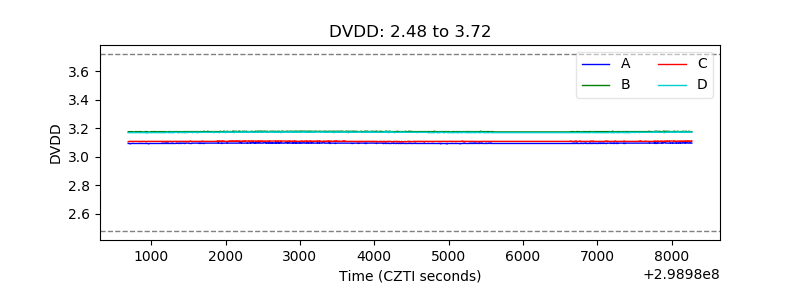 |
| Temperature 1 | 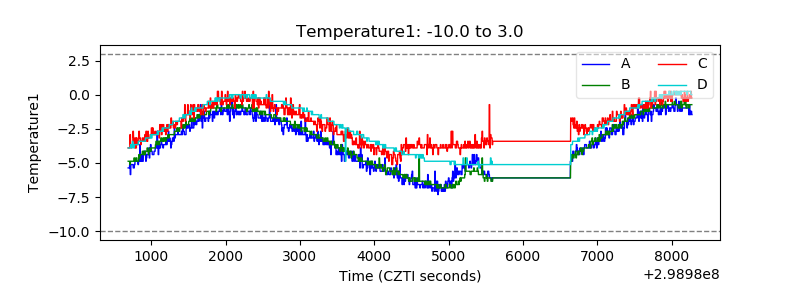 |
| Veto HV Monitor | 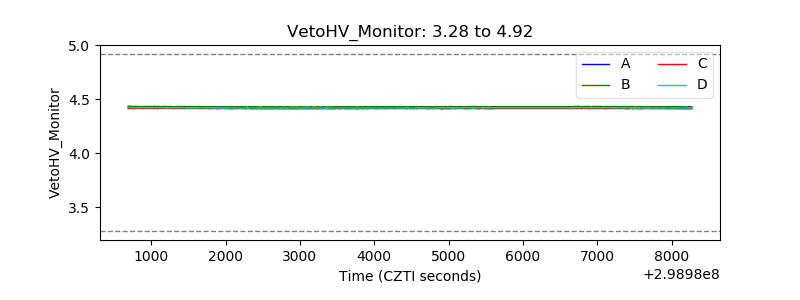 |
| Veto LLD | 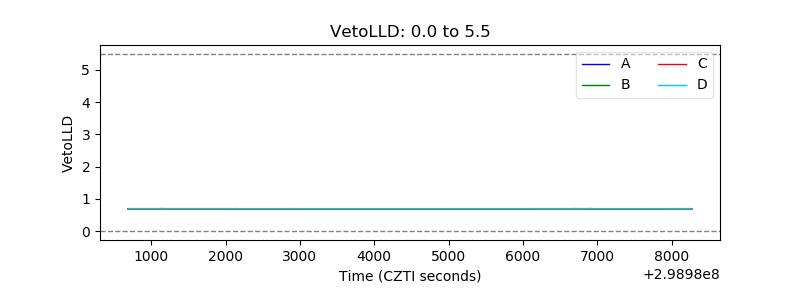 |
| Alpha Counter | 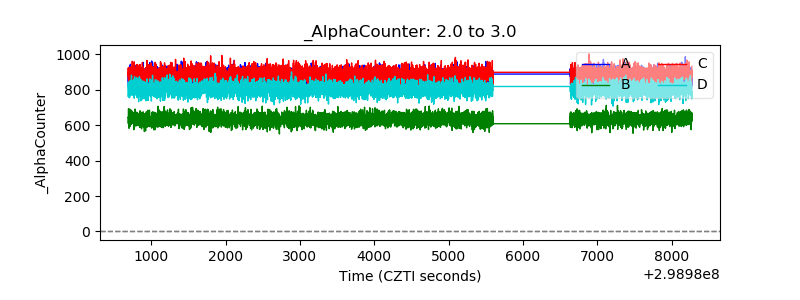 |
| _CPM_Rate | 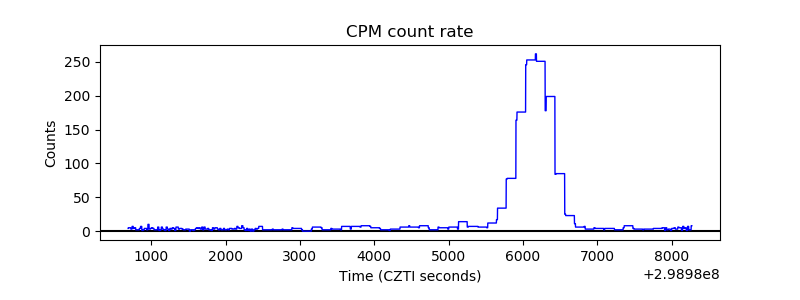 |
| CZT Counter | 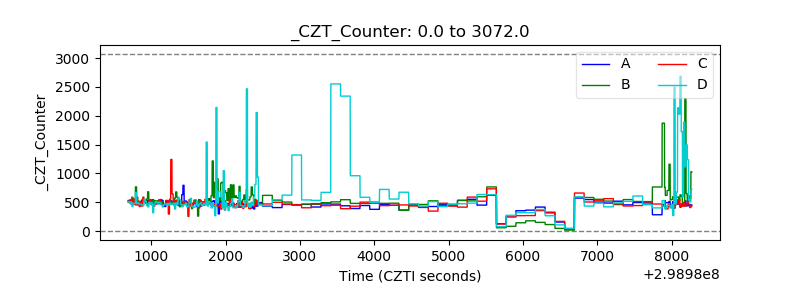 |
| +2.5 Volts monitor |  |
| +5 Volts monitor |  |
| _ROLL_ROT |  |
| _Roll_DEC | 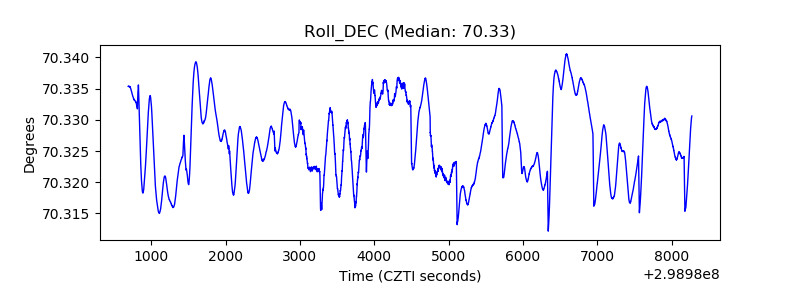 |
| _Roll_RA | 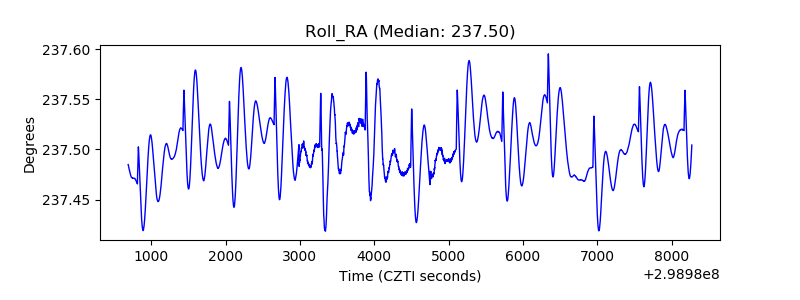 |
| Veto Counter | 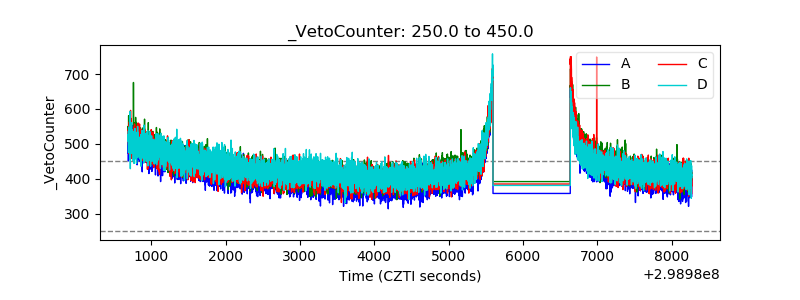 |