| Param | Original file | Final file |
|---|---|---|
| Filename | modeM0/AS1C04_001T01_9000002994_20195cztM0_level2.evt | modeM0/AS1C04_001T01_9000002994_20195cztM0_level2_quad_clean.evt |
| Size (bytes) | 1,186,856,640 | 322,202,880 |
| Size | 1.1 GB | 307.3 MB |
| Events in quadrant A | 7,839,596 | 2,233,889 |
| Events in quadrant B | 8,763,543 | 2,213,722 |
| Events in quadrant C | 7,924,992 | 2,127,256 |
| Events in quadrant D | 10,314,984 | 2,061,903 |
| Mode SS | |||
|---|---|---|---|
| Quadrant | BADHDUFLAG | Total packets | Discarded packets |
| A | 0 | 330 | 0 |
| B | 0 | 330 | 0 |
| C | 0 | 330 | 0 |
| D | 0 | 330 | 0 |
| Mode M9 | |||
|---|---|---|---|
| Quadrant | BADHDUFLAG | Total packets | Discarded packets |
| A | 0 | 30 | 0 |
| B | 0 | 30 | 0 |
| C | 0 | 30 | 0 |
| D | 0 | 30 | 0 |
| Mode M0 | |||
|---|---|---|---|
| Quadrant | BADHDUFLAG | Total packets | Discarded packets |
| A | 0 | 33693 | 3 |
| B | 0 | 36336 | 5 |
| C | 0 | 33601 | 3 |
| D | 0 | 41319 | 3 |
| Quadrant | Total seconds | Saturated seconds | Saturation percentage |
|---|---|---|---|
| A | 16287 | 299 | 1.835820% |
| B | 16287 | 412 | 2.529625% |
| C | 16288 | 303 | 1.860265% |
| D | 16288 | 841 | 5.163310% |
Noise dominated data is calculated using 1-second bins in cleaned event files. If a bin has >2000 counts, and if more than 50% of those come from <1% of pixels, then it is considered to be noise-dominated and hence unusable.
| Quadrant | # 1 sec bins | Bins with >0 counts | Bins with >2000 counts | High rate bins dominated by noise | Noise dominated (total time) | Noise dominated (detector-on time) | Marked lightcurve |
|---|---|---|---|---|---|---|---|
| A | 19242 | 16291 | 16 | 16 | 0.08% | 0.10% | 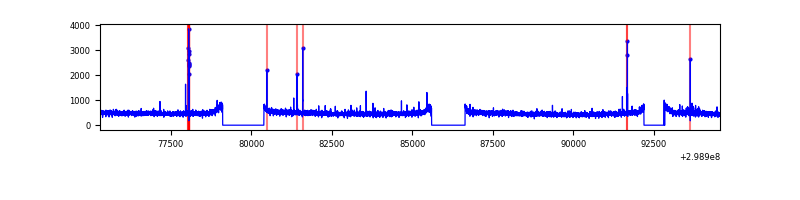 |
| B | 19243 | 16292 | 80 | 80 | 0.42% | 0.49% | 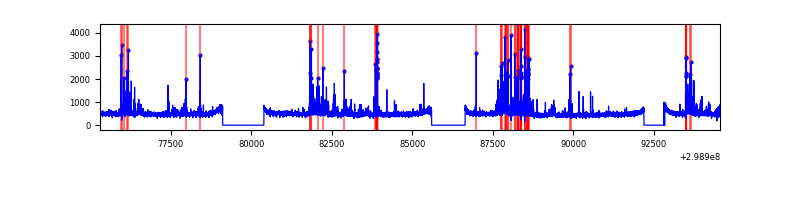 |
| C | 19243 | 16292 | 0 | 0 | 0.00% | 0.00% | 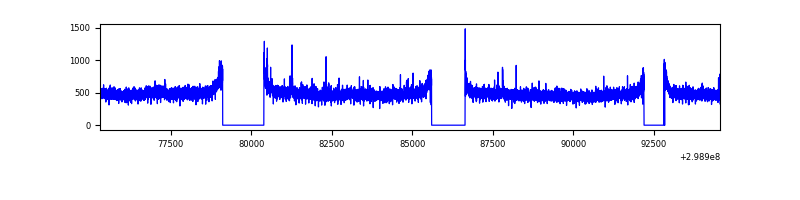 |
| D | 19243 | 16292 | 482 | 482 | 2.50% | 2.96% | 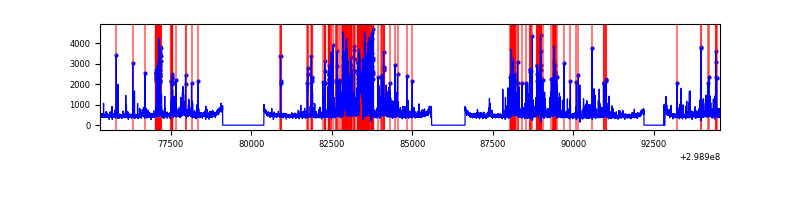 |
Top three noisy pixels from each quadrant. If the there are fewer than three noisy pixels in the level2.evt file, extra rows are filled as -1
| Pixel properties | Quadrant properties | ||||||
|---|---|---|---|---|---|---|---|
| Quadrant | DetID | PixID | Counts | Sigma | Mean | Median | Sigma |
| A | 4 | 2 | 47841 | 113.98 | 2004 | 1959 | 402.5 |
| A | 14 | 238 | 45634 | 108.5 | 2004 | 1959 | 402.5 |
| A | 13 | 254 | 19132 | 42.66 | 2004 | 1959 | 402.5 |
| B | 7 | 220 | 589673 | 1600.83 | 1973 | 1923 | 367.2 |
| B | 0 | 197 | 227194 | 613.56 | 1973 | 1923 | 367.2 |
| B | 0 | 190 | 90308 | 240.73 | 1973 | 1923 | 367.2 |
| C | 14 | 238 | 298390 | 679.24 | 1905 | 1911 | 436.5 |
| C | 3 | 233 | 179497 | 406.85 | 1905 | 1911 | 436.5 |
| C | 1 | 16 | 17164 | 34.95 | 1905 | 1911 | 436.5 |
| D | 9 | 1 | 1122247 | 2416.08 | 1923 | 1867 | 463.7 |
| D | 11 | 176 | 582387 | 1251.88 | 1923 | 1867 | 463.7 |
| D | 7 | 38 | 420749 | 903.31 | 1923 | 1867 | 463.7 |
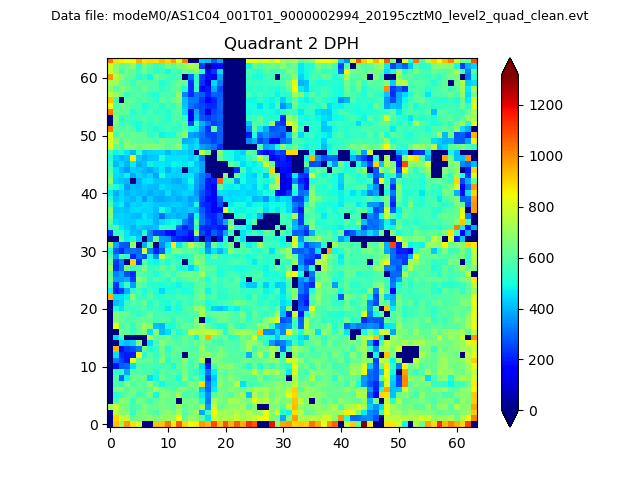
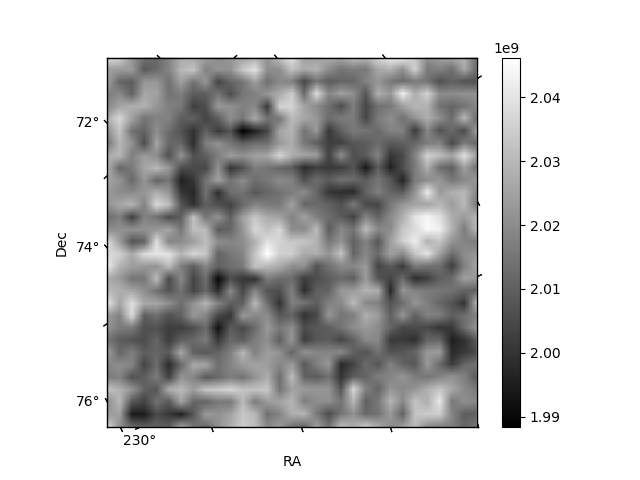
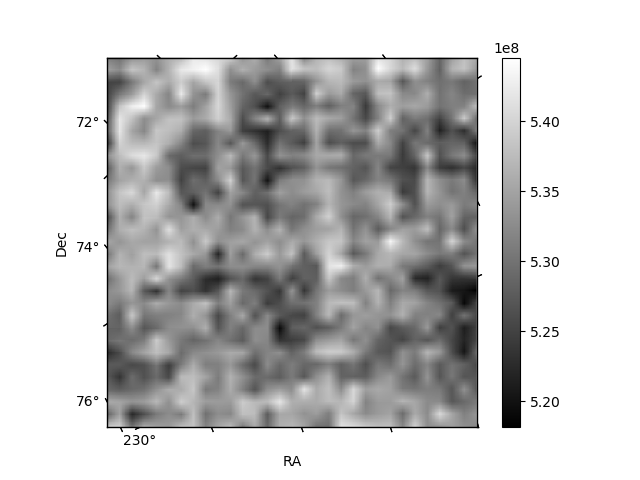
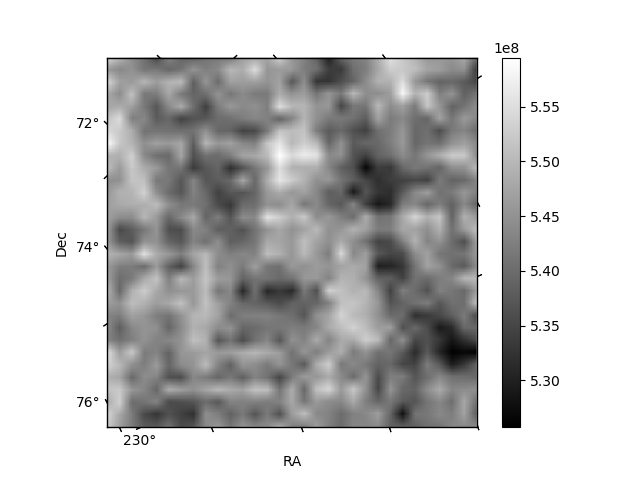
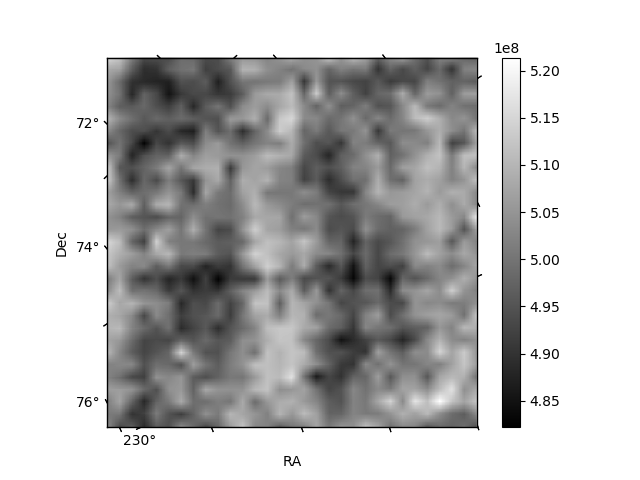
Histogram calculated using DETX and DETY for each event in the final _common_clean file
| Quadrant A | 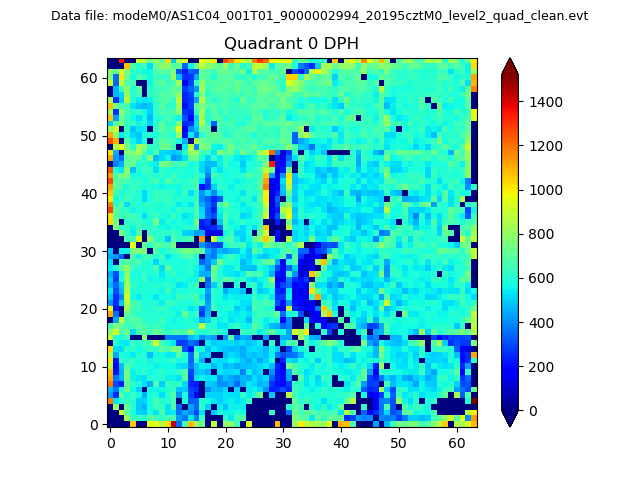 |
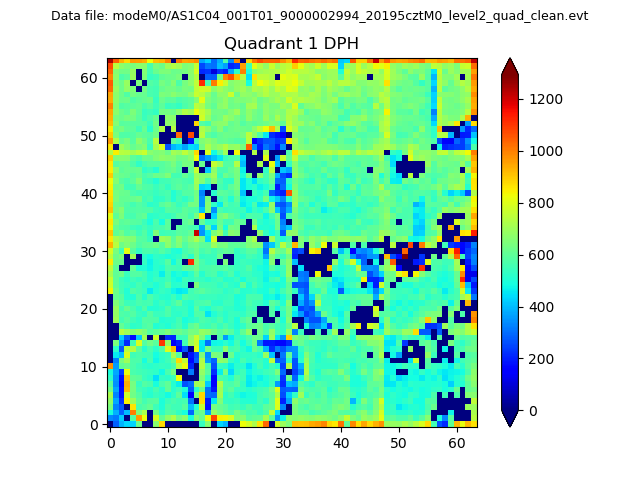 |
Quadrant B |
|---|---|---|---|
| Quadrant D | 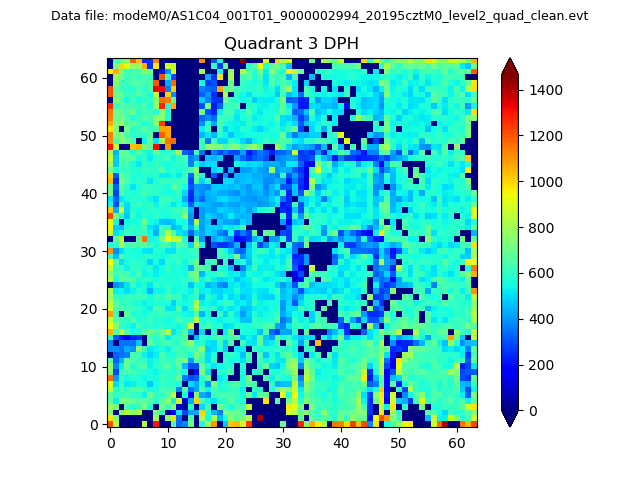 |
 |
Quadrant C |
| Plot type | Count rate plots | Images |
|---|---|---|
| Comparison with Poisson distribution Blue bars denote a histogram of data divided into 1 sec bins. Red curve is a Poisson curve with rate = median count rate of data. |
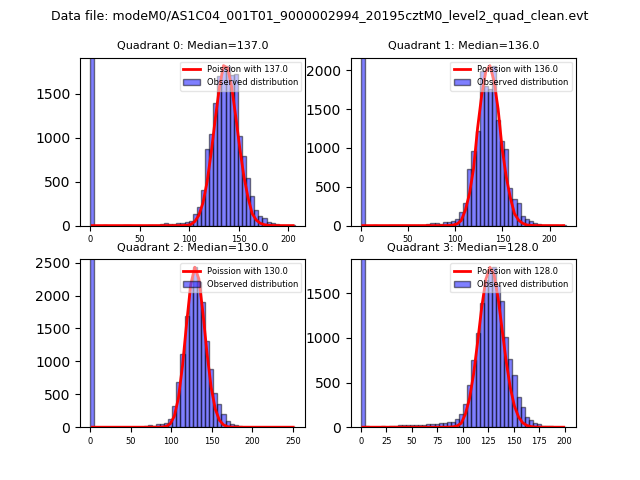 |
 |
| Quadrant-wise count rates Data is divided into 100 sec bins |
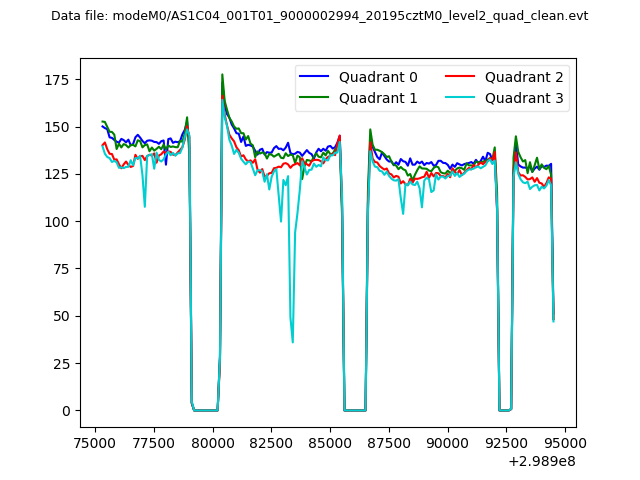 |
|
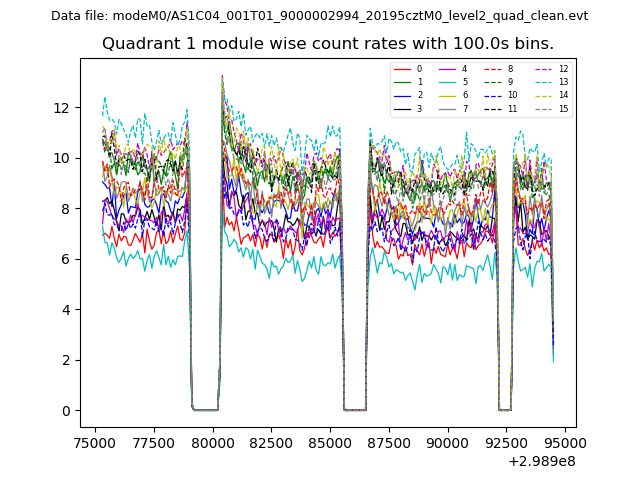
| Module-wise count rates for Quadrant A Data is divided into 100 sec bins |
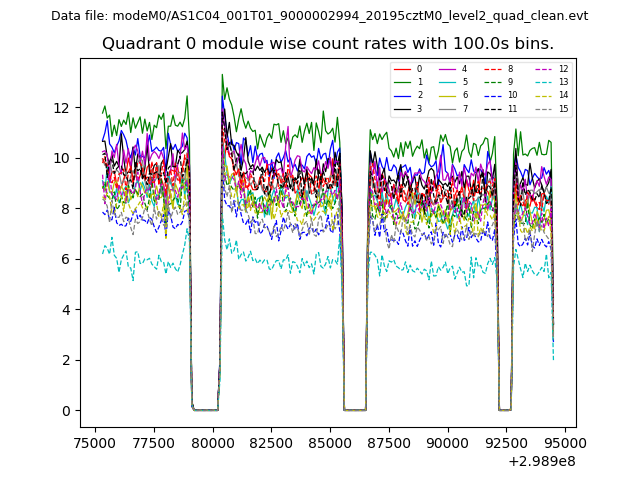 |
 |
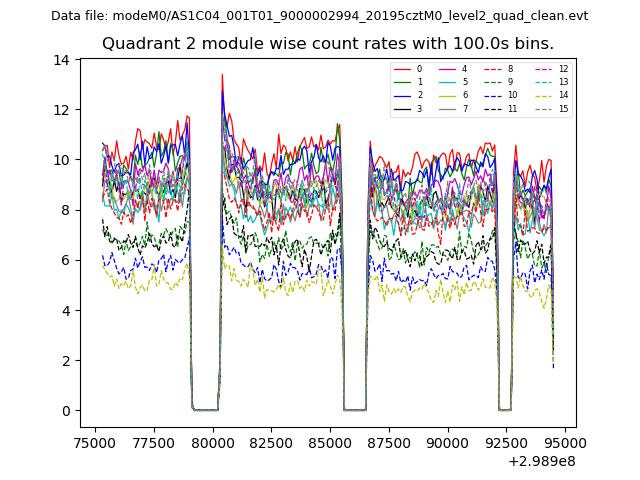
| Module-wise count rates for Quadrant B Data is divided into 100 sec bins |
 |
 |
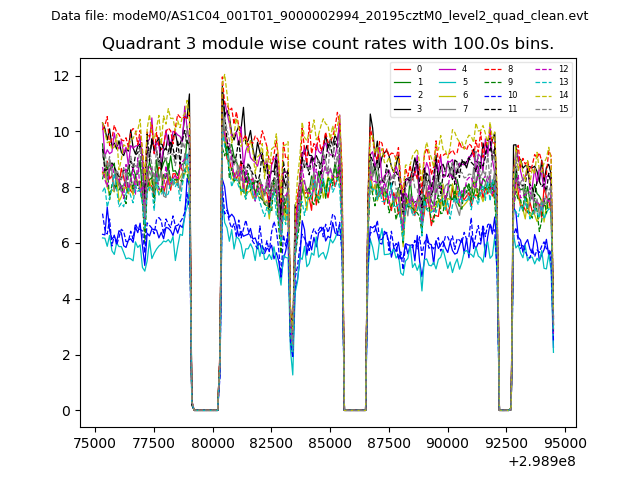
| Module-wise count rates for Quadrant C Data is divided into 100 sec bins |
 |
 |
| Module-wise count rates for Quadrant D Data is divided into 100 sec bins |
 |
 |
| Parameter | Plot |
|---|---|
| CZT HV Monitor |  |
| D_VDD | 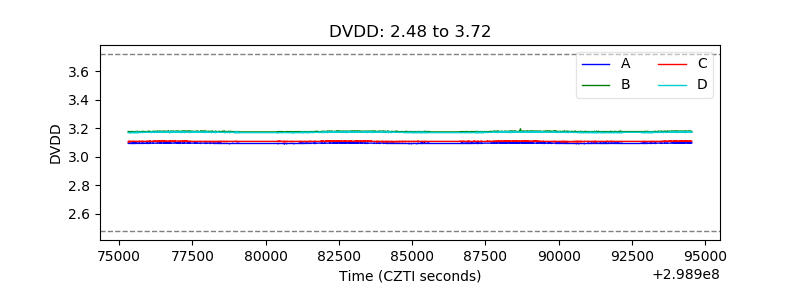 |
| Temperature 1 | 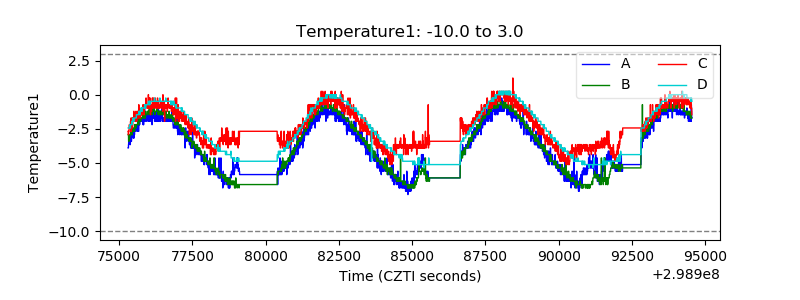 |
| Veto HV Monitor | 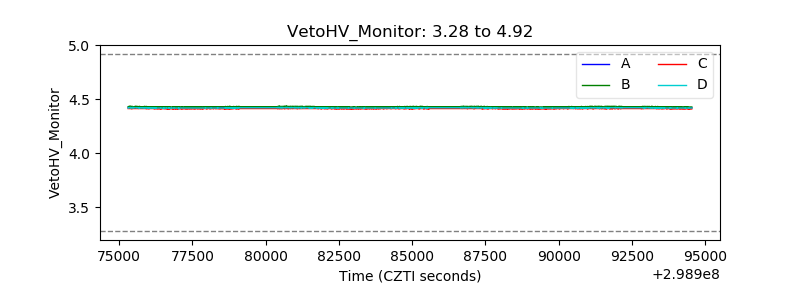 |
| Veto LLD | 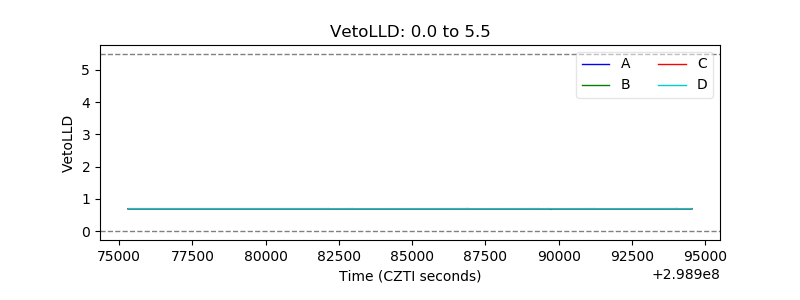 |
| Alpha Counter | 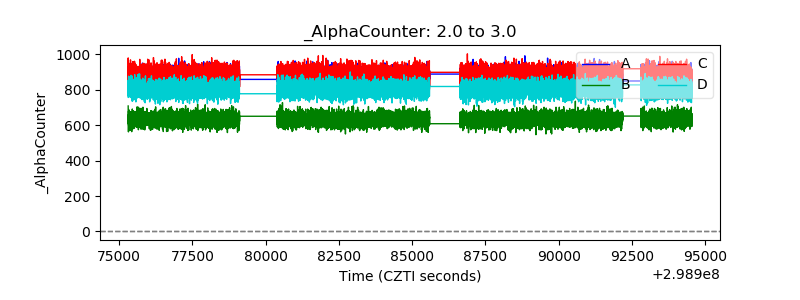 |
| _CPM_Rate | 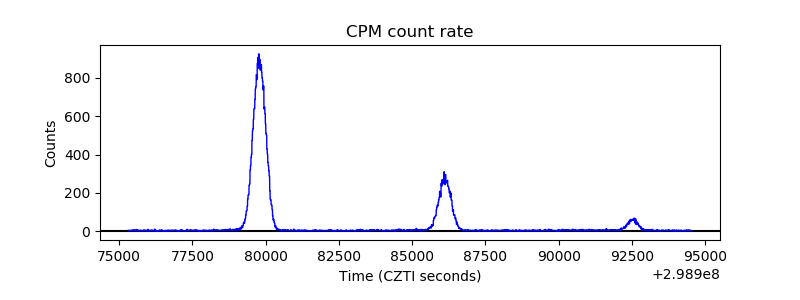 |
| CZT Counter | 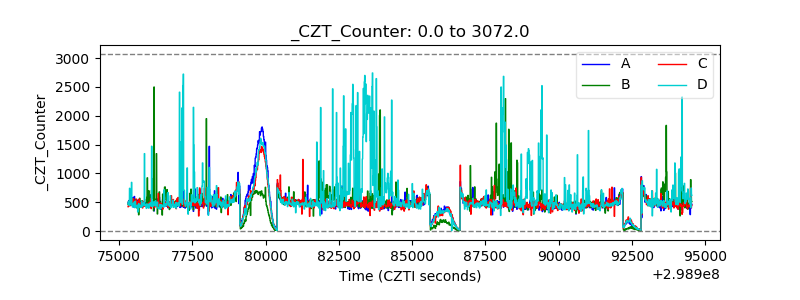 |
| +2.5 Volts monitor |  |
| +5 Volts monitor |  |
| _ROLL_ROT | 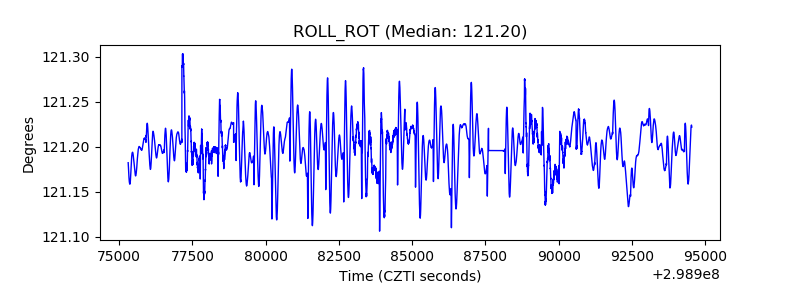 |
| _Roll_DEC | 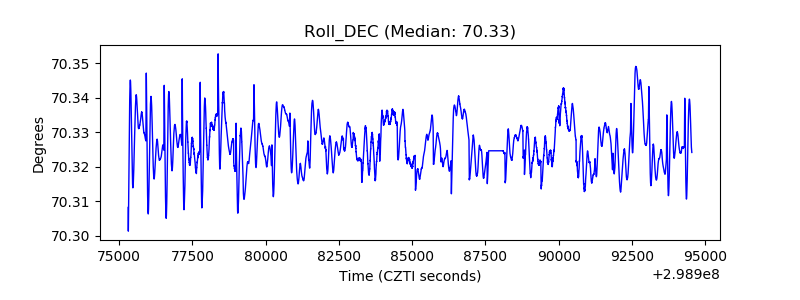 |
| _Roll_RA |  |
| Veto Counter | 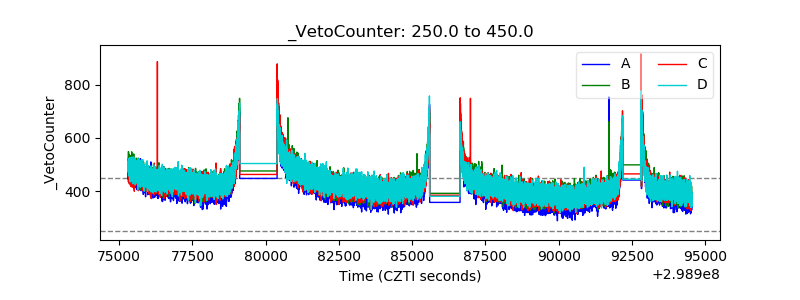 |