| Param | Original file | Final file |
|---|---|---|
| Filename | modeM0/AS1C04_001T01_9000002994_20196cztM0_level2.evt | modeM0/AS1C04_001T01_9000002994_20196cztM0_level2_quad_clean.evt |
| Size (bytes) | 457,456,320 | 125,271,360 |
| Size | 436.3 MB | 119.5 MB |
| Events in quadrant A | 3,158,309 | 851,324 |
| Events in quadrant B | 3,400,319 | 845,536 |
| Events in quadrant C | 3,143,473 | 821,465 |
| Events in quadrant D | 3,699,093 | 811,236 |
| Mode SS | |||
|---|---|---|---|
| Quadrant | BADHDUFLAG | Total packets | Discarded packets |
| A | 0 | 134 | 0 |
| B | 0 | 134 | 0 |
| C | 0 | 134 | 0 |
| D | 0 | 134 | 0 |
| Mode M9 | |||
|---|---|---|---|
| Quadrant | BADHDUFLAG | Total packets | Discarded packets |
| A | 0 | 4 | 0 |
| B | 0 | 4 | 0 |
| C | 0 | 4 | 0 |
| D | 0 | 4 | 0 |
| Mode M0 | |||
|---|---|---|---|
| Quadrant | BADHDUFLAG | Total packets | Discarded packets |
| A | 0 | 13842 | 1 |
| B | 0 | 14470 | 1 |
| C | 0 | 13629 | 1 |
| D | 0 | 15498 | 1 |
| Quadrant | Total seconds | Saturated seconds | Saturation percentage |
|---|---|---|---|
| A | 6670 | 31 | 0.464768% |
| B | 6671 | 56 | 0.839454% |
| C | 6671 | 72 | 1.079298% |
| D | 6671 | 95 | 1.424074% |
Noise dominated data is calculated using 1-second bins in cleaned event files. If a bin has >2000 counts, and if more than 50% of those come from <1% of pixels, then it is considered to be noise-dominated and hence unusable.
| Quadrant | # 1 sec bins | Bins with >0 counts | Bins with >2000 counts | High rate bins dominated by noise | Noise dominated (total time) | Noise dominated (detector-on time) | Marked lightcurve |
|---|---|---|---|---|---|---|---|
| A | 7075 | 6671 | 12 | 12 | 0.17% | 0.18% | 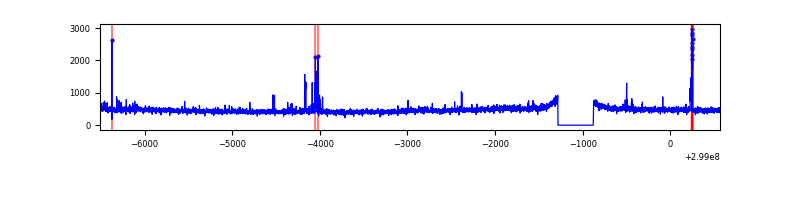 |
| B | 7076 | 6672 | 14 | 14 | 0.20% | 0.21% | 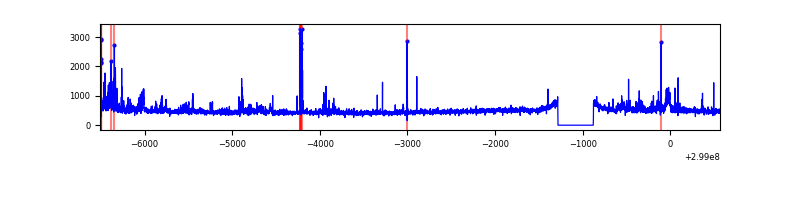 |
| C | 7076 | 6672 | 0 | 0 | 0.00% | 0.00% | 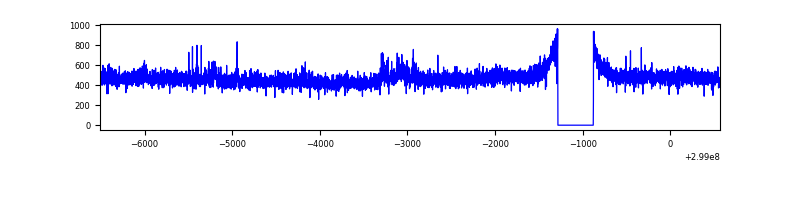 |
| D | 7076 | 6672 | 48 | 48 | 0.68% | 0.72% | 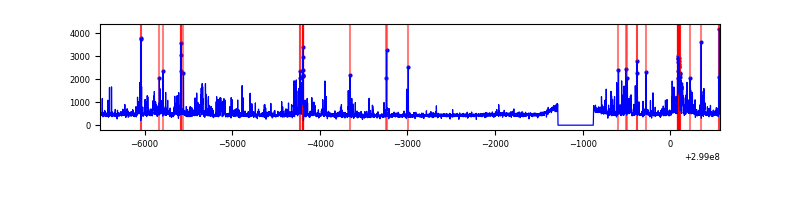 |
Top three noisy pixels from each quadrant. If the there are fewer than three noisy pixels in the level2.evt file, extra rows are filled as -1
| Pixel properties | Quadrant properties | ||||||
|---|---|---|---|---|---|---|---|
| Quadrant | DetID | PixID | Counts | Sigma | Mean | Median | Sigma |
| A | 4 | 2 | 46813 | 289.04 | 789 | 771 | 159.3 |
| A | 14 | 111 | 34771 | 213.44 | 789 | 771 | 159.3 |
| A | 10 | 253 | 26359 | 160.63 | 789 | 771 | 159.3 |
| B | 0 | 197 | 122022 | 817.99 | 781 | 761 | 148.2 |
| B | 7 | 220 | 96342 | 644.76 | 781 | 761 | 148.2 |
| B | 0 | 190 | 28331 | 185.98 | 781 | 761 | 148.2 |
| C | 14 | 238 | 117863 | 662.84 | 756 | 761 | 176.7 |
| C | 3 | 233 | 63374 | 354.41 | 756 | 761 | 176.7 |
| C | 1 | 16 | 13801 | 73.81 | 756 | 761 | 176.7 |
| D | 7 | 38 | 244917 | 1310.92 | 769 | 746 | 186.3 |
| D | 11 | 176 | 157849 | 843.47 | 769 | 746 | 186.3 |
| D | 2 | 184 | 74717 | 397.14 | 769 | 746 | 186.3 |
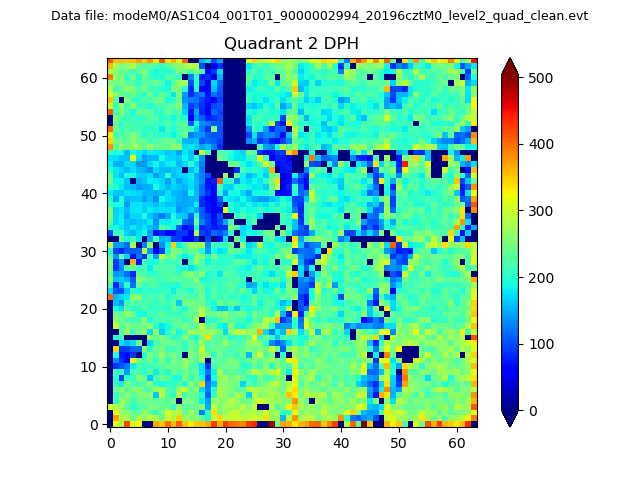
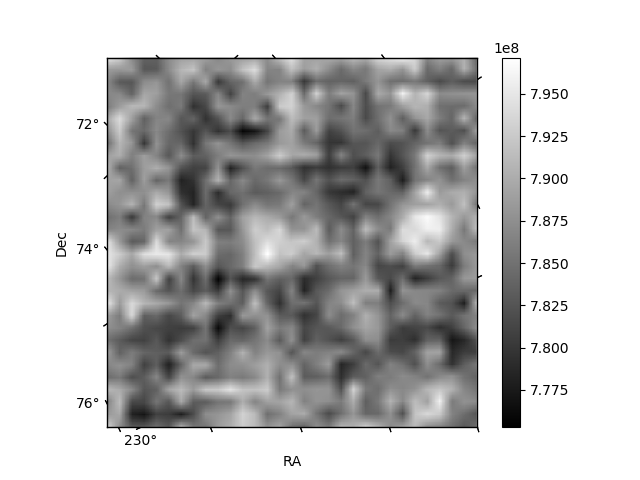
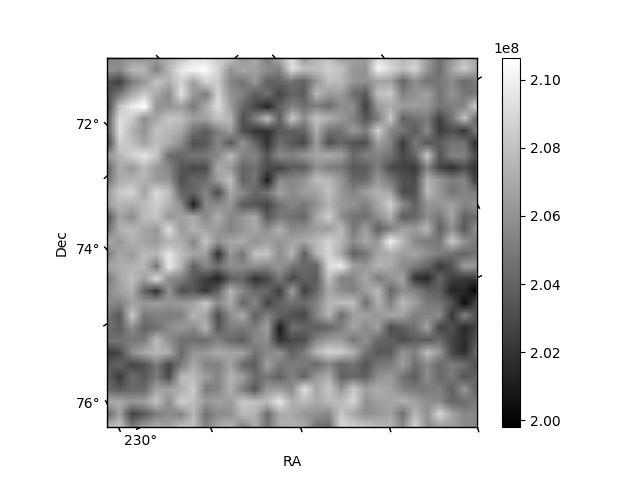
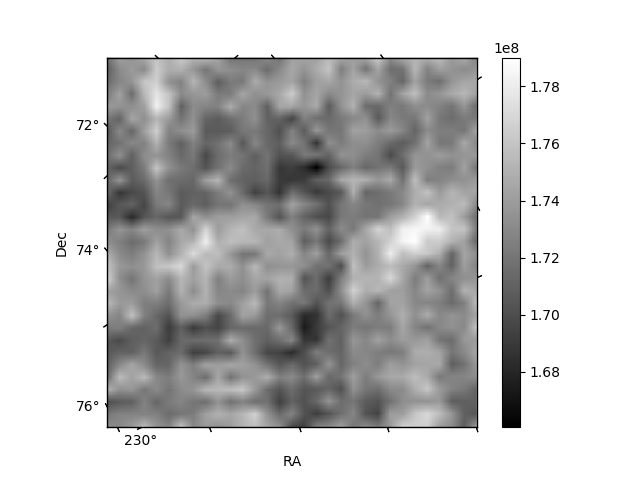
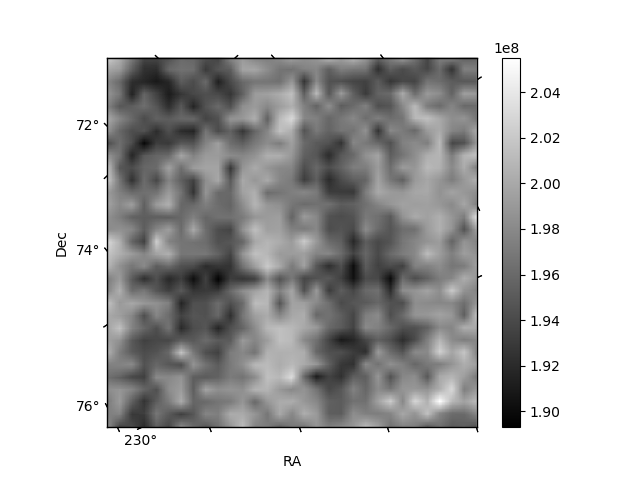
Histogram calculated using DETX and DETY for each event in the final _common_clean file
| Quadrant A | 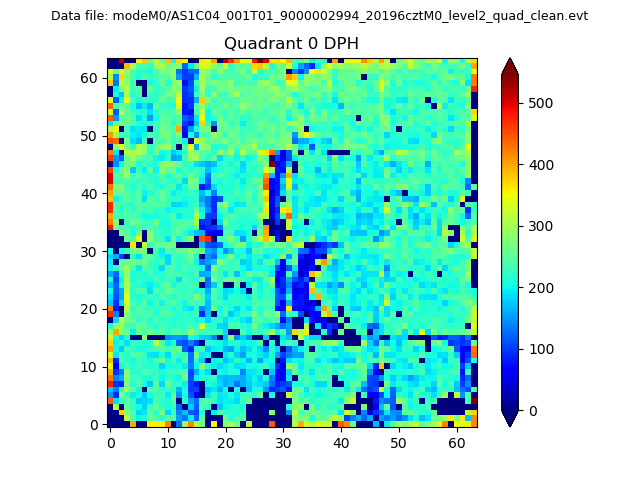 |
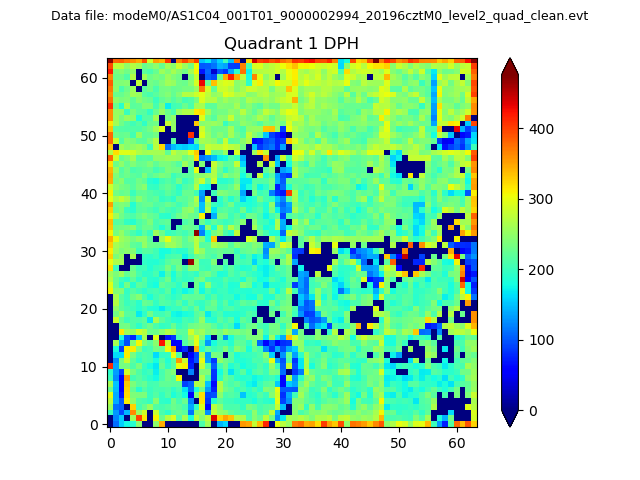 |
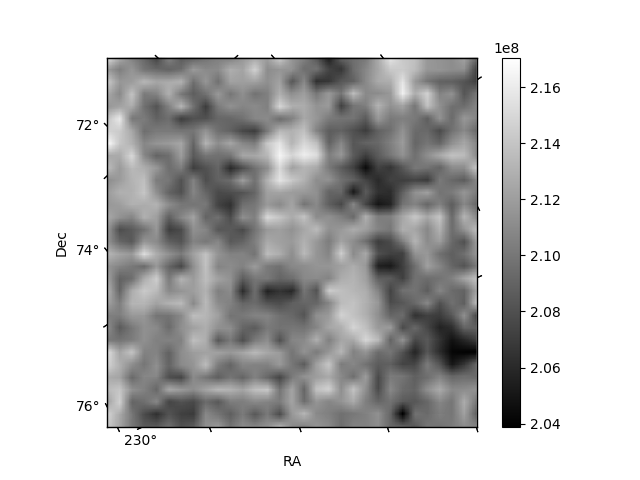
Quadrant B |
|---|---|---|---|
| Quadrant D | 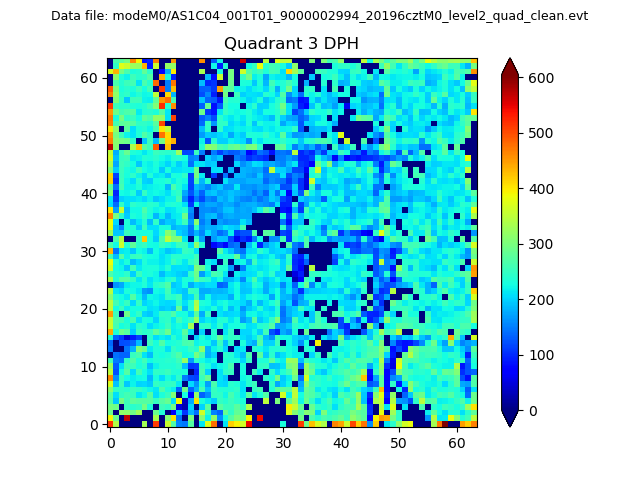 |
 |
Quadrant C |
| Plot type | Count rate plots | Images |
|---|---|---|
| Comparison with Poisson distribution Blue bars denote a histogram of data divided into 1 sec bins. Red curve is a Poisson curve with rate = median count rate of data. |
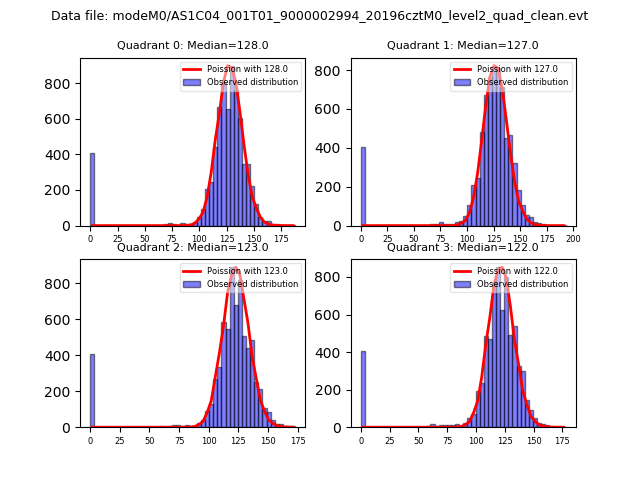 |
 |
| Quadrant-wise count rates Data is divided into 100 sec bins |
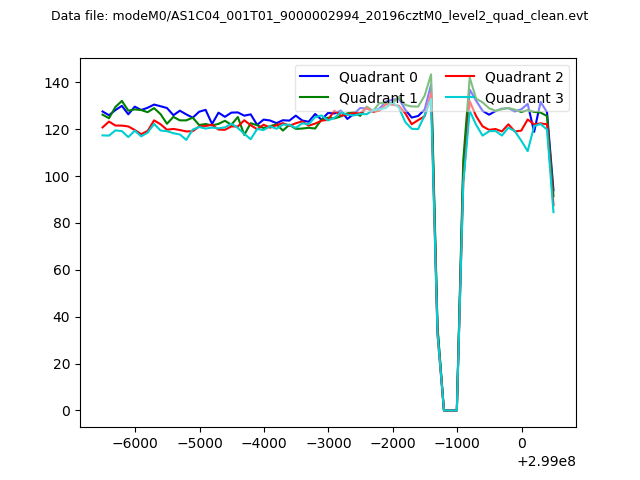 |
|
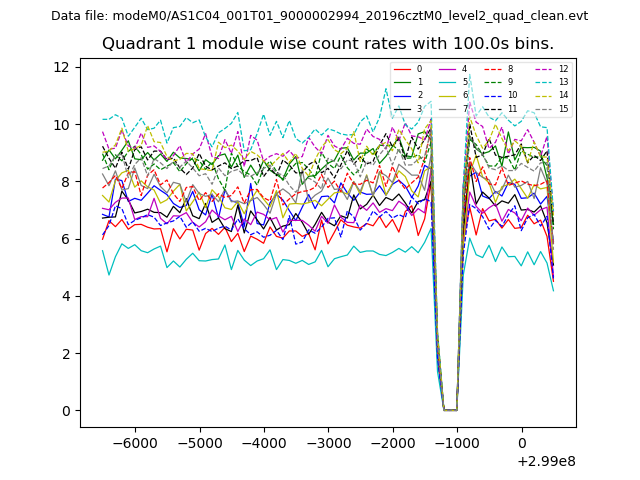
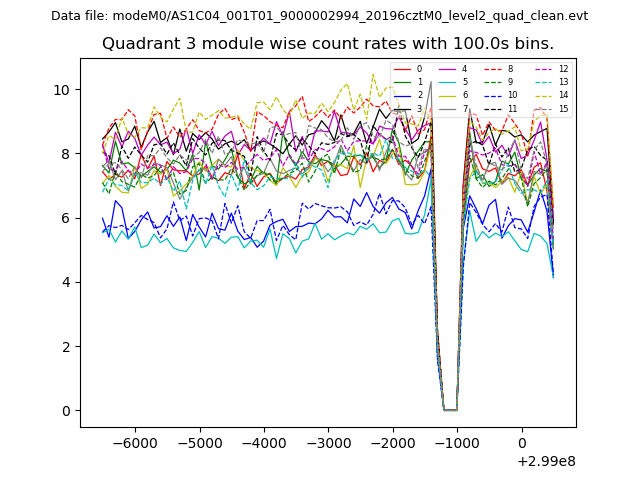
| Module-wise count rates for Quadrant A Data is divided into 100 sec bins |
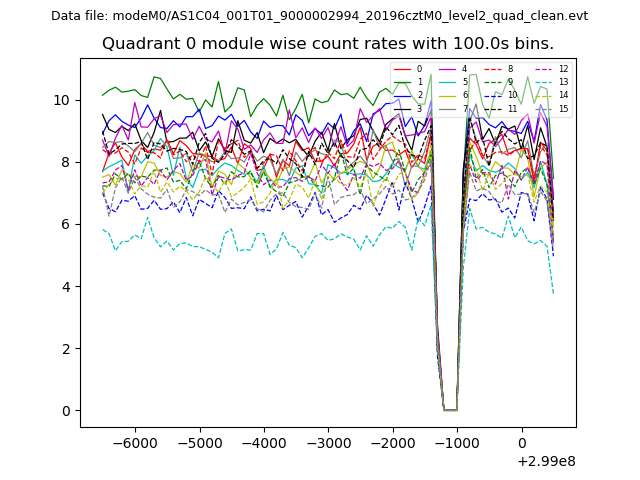 |
 |
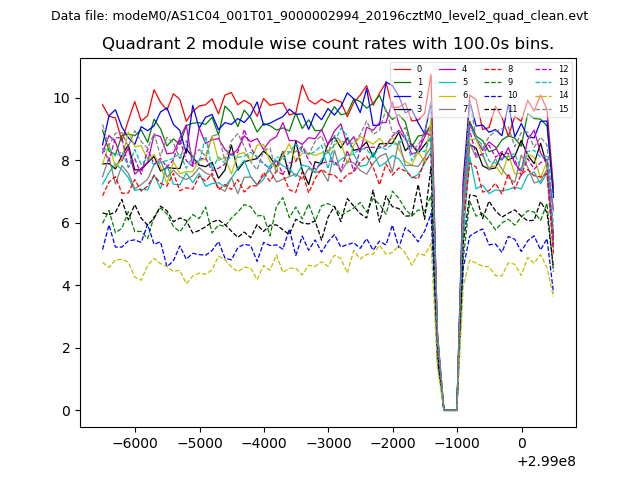
| Module-wise count rates for Quadrant B Data is divided into 100 sec bins |
 |
 |
| Module-wise count rates for Quadrant C Data is divided into 100 sec bins |
 |
 |
| Module-wise count rates for Quadrant D Data is divided into 100 sec bins |
 |
 |
| Parameter | Plot |
|---|---|
| CZT HV Monitor | 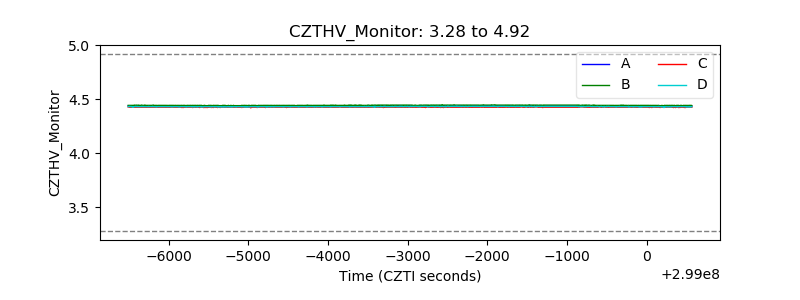 |
| D_VDD | 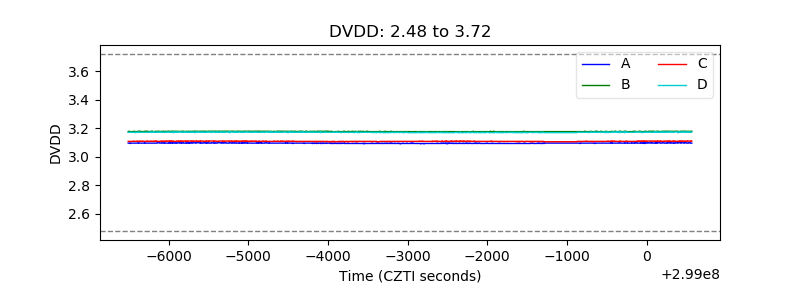 |
| Temperature 1 | 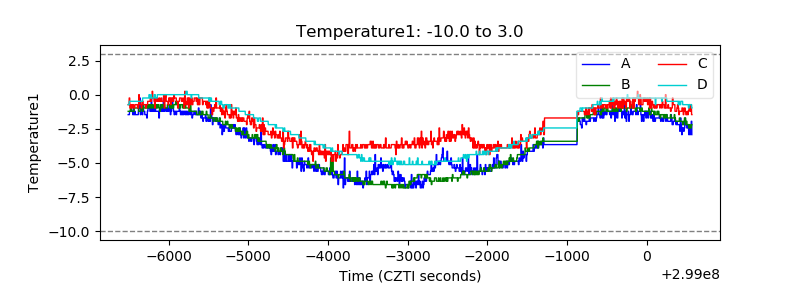 |
| Veto HV Monitor | 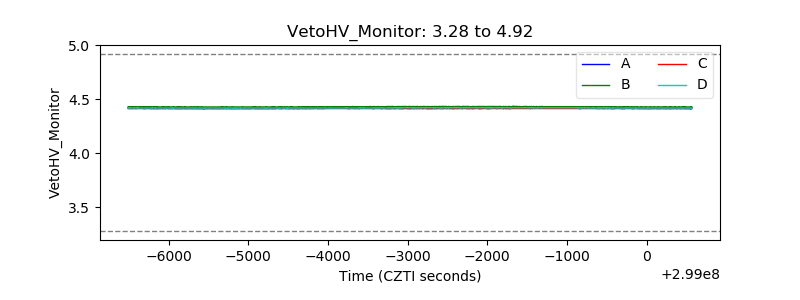 |
| Veto LLD | 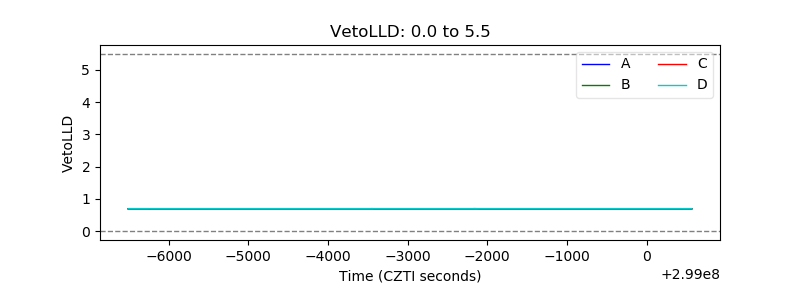 |
| Alpha Counter | 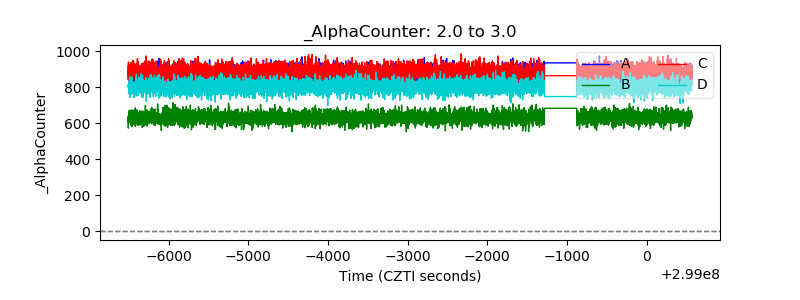 |
| _CPM_Rate | 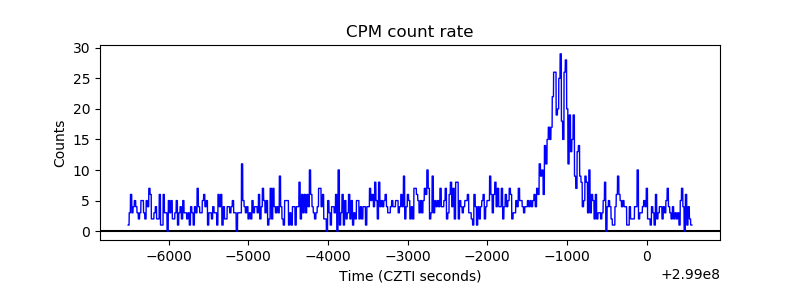 |
| CZT Counter | 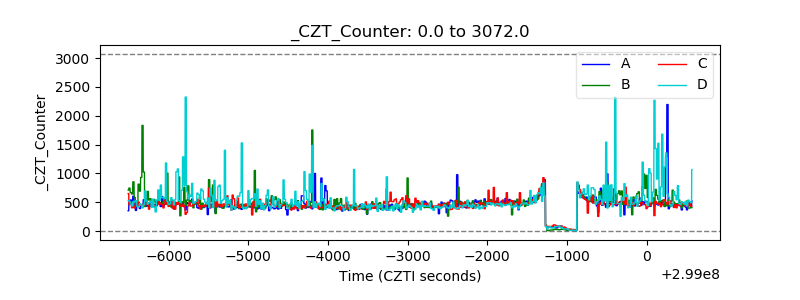 |
| +2.5 Volts monitor |  |
| +5 Volts monitor |  |
| _ROLL_ROT |  |
| _Roll_DEC | 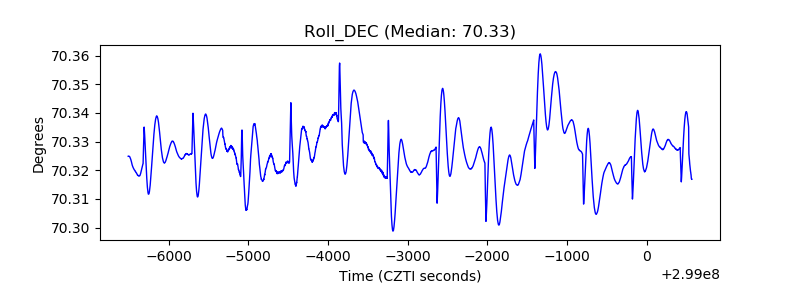 |
| _Roll_RA | 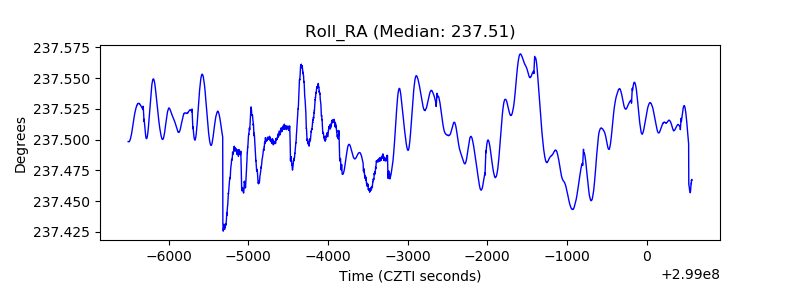 |
| Veto Counter | 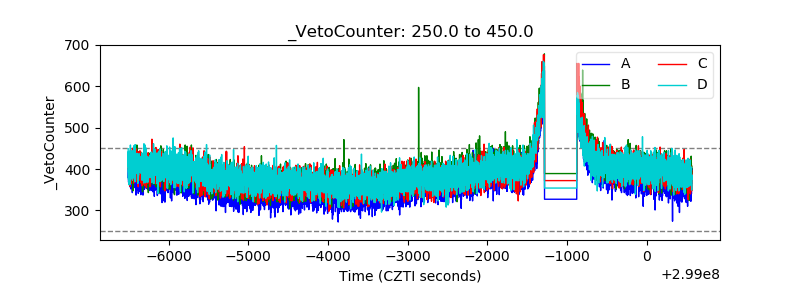 |